Quantcast
Channel: Biosciences Biotechnology Research Asia
Viewing all 1376 articles
Browse latest View live

Indiscriminate use of Agricultural Azoles Causing Azole-Resistance in Clinical Candida Isolates

$
0
0

Introduction

Soil is a dynamic entity and a good platform for the exchange of matter and energy. It provides the main niche for all kinds of microorganisms including fungi (90% of biomass of soil is composed of bacteria and fungi)1. Mycotoxins produced by some fungi like Fusarium not only spoil farm yield but also harm the consumers. Hence, antimycotics are used over crop plants to prevent post-harvest loss that indirectly also effect human health. The last five decades has heralded the introduction of azoles as a popular fungicide in agriculture and clinics. Azoles such as dithiocarbamates, griseofulvin, ciclopirox, and strobilurins are commonly used as antimycotics2. Lately, it has been observed that overuse of azoles as fungicides in agriculture can lead to cross-resistance among various fungal species and is the main cause of emergence of novel resistant fungi such as Candida aurisin clinical samples3.

Human fungal infections generally do not receive much attention as compared to bacterial and viral diseases; however, mortality rate from invasive fungal infections is increasing exponentially despite the use of antifungal drugs4. Among the common fungal infections afflicting human, candidiasis affects millions of people annually. Mainly associated with hospitalization, the infection usually spares the vast majority of immunocompetent patients but has a predilection for immunocompromised individuals5. It has been reflected as the predominant systemic infection causing pathogen in patients with COPD, AIDS, and cancer6,7,8,9,10,11. Most importantly, the resistant isolates of Candida have the potential to form biofilms. The thick polymeric extracellular layer protects Candida aggregates as it forms a tough barrier against the known antimicrobial substances12.

The emergence of clinical Candida isolates with multi drug resistance (MDR) has further alarmed microbiologists. The usual Candida species predominantly found in clinics are susceptible to amphotericin B, azoles, and echinocandins, but certain novel emerging fungal species have demonstrated resistance to all the three primary antifungal drugs13. Ironically, amphotericin B performs slightly better whereas azoles have confirmed to be the least effective against such species14. Though in most clinical isolates, resistance to antifungal is due to long term azole therapy, wherein the fungus was adapting rapidly to the azole drug being used; however it was also seen that certain patients who were never exposed to azole drugs, showed resistance. Such incidences are a wakeup call and indicate that these patients perhaps acquired azole resistant fungal strains from the environment.

Candida species in patients andenvironment

Candida is an important opportunistic fungal pathogen that is present both in immunocompromised patients and also in the environment. It causes infections in mouth, skin, and vagina along with bloodstream invasive infections. Candida albicans is the major causative agent of all forms of candidiasis. However, the pattern has changed in the last decade with majority of the non albicans Candida species (NACS) getting associated with the nosocomial invasive infections.C. glabrata, C. parapsilosisand C. tropicalisare the important pathogens in this category. Higher mortality rate in patients with C. glabrata over C. albicans is due to the fact that it can survive during long term starvation conditions upon phagocytosis by macrophages, as well as low pH environment in vagina or in phagolysosomes. C. glabrata thus is associated with the enormous adaptability to survive in different host niches. C. tropicalis is a diploid dimorphic fungal pathogen which causes infections mainly in neutropenic patients and individuals having haematological malignancies15. Similarly, C. parapsilosisis also a diploid dimorphic fungus which mainly affects the immunocompromised individuals and can cause major health risk to neonates with low weight birth.

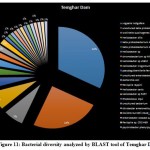
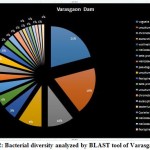
Almost ubiquitously, many Candida species are found in every kind of managed soil (Table 1); however variation depends on type of soil, climate condition, water abundance etc1. Fungi ferment and assimilate different kind of sugars provided by the plants to soil e.g.C. auris ferment glucose, sucrose but assimilate maltose, mannitol, sorbitol as carbon sources16,17. The abundance of different sugars in different soil decides the variation in fungal community which further gets enhanced due to regular tillage and mixing of upper layer of soil.

Table 1: Candida species isolated from different kinds of managed soil

Candida species present Type of managed soil References

Candida glabrata

Vineyard

18

Candida parapsilosis Agricultural 19
Candida apis Pasture 20
Candida azyma Rhizosphere 21

Candida diddensiae

Rhizosphere

21

Candida sake Agricultural

22

Candida (Torulopsis) magnolia Agricultural 19

Use of Azole in Agriculture and Medicine

Fungal infections in plants cause a massive loss in crop yield worldwide. In agriculture, antimycotics are mainly used to control the fungal growth on plantsand also to arrest post-harvest spoilage of agricultural product. Though before 1970s, many compounds such as dithiocarbamate, benzimidazoles, strobilurins were predominantly used antimyocotics; however later azoles gained prominence due to their site-specific inhibitory action which made them much more beneficial2. According to the instructions of manufacturers, it is stated that about 10mg of azole should be applied on 1m2 plant surfaces, or in other words, about 100g/ha should be used in a field23. As per the available data, usage of azole-based fungicide has increased from 100 tons to 145 tons i.e. 45% in 4 years in Taiwan (2005 to 2009)24. Throughout the world, fungicide share 27% of anti-pest chemicals and this number is 15% in India; which is rising exponentially to the demand of increasing population25. Certain features of azoles make them preferred fungicides among farmers as they possess long–lasting stability and high efficiency against broad range of plant infections. The azole fungicides are selective only for fungi species and target the ergosterol biosynthetic pathways in the fungus. They also show very low toxicity for both the farmers who apply them and the plants that are under treatment, as both plant and animal cells do not contain ergosterol in their plasma membrane which is an important component of fungal cell membrane.The massive use of azoles in agriculture however, exerts a strong selective pressure on the pathogenic fungi to survive in environment.

In medicine on the other hand, the increase in prophylactic usage of therapeutic azoles has led to surge in the cases of resistant fungal isolates. Previously C. albicans was considered as a ubiquitous fungus in hospitals and cause of nosocomial infections26,27,28; but nowadays, other species have also paved their way to the hospital wards. These non-albicans Candida species (NACS) are distributed according to geographic areas e.g.C. tropicalis majorly found in Asia, in organic soil and soil near water29,30,31 while C. glabrata predominate in western countries 27, 32.

The similar mode of action of azoles used in agriculture and medicine perhaps has led to cross-resistance along with increased presence of resistant fungal strains in environment and in clinics.

Correlation between the use of azoles in agriculture and resistance in clinical fungi

Bacteria and fungus in soil develop antibiotic resistance mechanism as a natural process. However, the mechanism of resistance in fungi and its transmission differs significantly from that in bacteria. There is no evidence that genes that confers resistance in fungi are transferred horizontally, a major difference with bacteria33. Acquired resistance is less common than intrinsic resistance in fungi because fungi do not exchange the resistance genes via plasmids, therefore selection of resistance mechanisms in fungi occur as an outcome of the antifungal use34. Most of the pathogenic fungi have their natural habitat in the environment and spores of fungi generally spread over long distance by air flow. Many fungal pathogens are present in both environment and clinicse .g. Aspergillusfumigatus, a saprophytic fungi that survive on decaying organic substances like leaves, fruits, etc. These fungi produce spores that are blown off by air and spread to other organisms e.g. humans. These spores mainly cause Aspergillosis in humans. As inhalation is the main route of these spores, so if an azole-resistant A. fumigatus is present in human surroundings then this resistant strain can enter the human body and can lead to the development of azole-resistant fungal disease35. Notwithstanding, compost present in gardens and in indoor plants could also act as an ecological niche for the various spores of fungi as well as azole residues; and can play an important role in development of azole resistance36.

Clinical azole drugs represent the major core therapy for treating fungal diseases in human35. Normally, treatment of the patients over longer period of time with antifungals can result in the selection of resistant strains. However it has been seen that exposure of fungi to azoles in agricultural field develops cross resistance to medical triazoles37. Due to the presence of genetic homology between the clinical and agricultural isolates, it has been suggested that environment is the most common infection route for the emergence of azole resistant isolates in clinics and hospitals. In a study, it was found out that 50% isolates of C. tropicalis isolated from the soil are 97% identical to those of human C. tropicalis while 33.3% are completely identical (100%) to human C. tropicalis. It was also seen that C. tropicalis isolated from humans and soil with reduced susceptibility to fluconazole are showing reduced susceptibility to other azoles that are in continuous use in agriculture31.

Even though development of resistance is a complex process and takes time to achieve, extensive data has revealed that azoles lead to strong selective pressure over fungal population to choose resistant strains e.g. Benzimidazole when initially introduced was a revolutionary agent against pathogen but later on some strains of the pathogen which are naturally resistant to benzimidazole got selected naturally and emerged further38. This forms a major concern for microbiologists nowadays. Strains of fungi isolated from HIV patients pre-treated with azoles are found to be resistant to fluconazole and they also show cross-resistant to azoles used in agriculture, with high Minimum inhibitory concentration (MIC) values. Resistance to medically important antifungals imposes a big challenge to clinicians in treating invasive fungal diseases. The knowledge about the rate and extent of development of resistance mechanism in the fungi and whether the mutation associated with this resistance is reversible or not is a very important point in the clinical medicine. The resistance to variety of antifungal depends on many factors for instance, the pharmacokinetic and pharmacodynamics properties of the drug, the target site of the drug and its mode of action in organism. It has been studied that there are mainly three ways by which patients may acquire the azole resistant fungi (1) initially, the infecting strain of fungi is susceptible to antifungal but as it mutates it develops azole resistance, (2) the individual may harbour the heterogenous population of infecting strain due to which resistant strain get selected during antifungal treatment over a period of time, or (3) the individual may acquire resistant strain from the external milieu23.

Mode of action of azole antifungals in Candidasp.

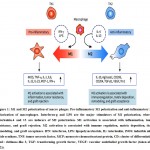
Binding of azoles gets impaired by genetic alteration in ERG11gene which mainly accounts for more than 90% of azole resistance in clinical isolates. The ERG11 gene encodes the enzyme cytochrome P450 14α-demethylase (also called lanosterol 14α-demethylase) which is the primary target for the azole compounds. Azole compounds are classified into two types depending on the basis of nitrogen atom present in it. Imidazoles (miconazole, ketoconazole) contain two nitrogen atoms in the ring; while triazoles (fluconazole, itraconazole, posaconazole, voriconazole) have three nitrogen atoms in ring. The nitrogen atom plays an important role in the mechanism of action of azoles as it bind to the heme group of the enzyme encoded by the gene. The enzyme encoded by the ERG11 plays a major role in removing the methyl group from lanosterol and then converting it into ergosterol. The ergosterol is a major component of the plasma membrane of fungi; hence it has a major role in maintaining the integrity of the cell membrane and also participates in the cell signaling pathways. The azole compounds work by inhibiting the function of lanosterol 14α-demethylase enzyme which will result in the accumulation of the methylated toxic precursors (Fig. 1). The build-up of these precursors in the cell makes plasma membrane leaky and impairs the fungal growth.

Figure 1: Action of azoles in Ergosterol biosynthetic pathway Figure 1: Action of azoles in Ergosterol biosynthetic pathway

Click here to View figure

Mechanism of azole resistance in Candida sp.

Resistance to azole antifungals to Candida sp. has been extensively studied. In C. albicansazole resistance can be broadly attributed to (i) overexpression of ABC and MR1 efflux pumps ii) enhanced secretion of 14α-lanosteroldemethylasevia ERG11 gene up-regulation; iii) decreased affinity of azole drugs due to point mutations in ERG11 gene and iv) homozygous ERG3 deletion mutation leading to the loss of sterol 5,6-desaturase activity39,40,41. These mechanisms are elucidated as under

Overexpression of Efflux Pump

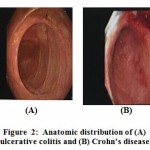
Mutations in trans-regulatory factors culminate into up regulation of genes encoding for efflux pumps and are the major cause for drug-resistance in C.albicans isolates(Fig. 2).ATP-binding cassette (ABC) is the primary active transporter of the cell membrane having four domains- two Nucleotide-binding domain (NBD1 and NBD2) that binds to ATP and hydrolyse it to let the solute into the cell and the other two domains are the transmembrane domain (TMD1 and TMD2)42.  In C. albicans for azole resistance, mainly ABC transporter comes in focus as out of two ABC transporter CDR1 and CDR2, CDR1 plays a major role and get upregulated43,44. In C. auris, along with CDR1 and CDR2, another ABC transporter Snq2 plays a role in azole resistance.  Various transcriptomic studies have concluded that efflux pump′s over expression along with some zinc cluster transcriptional factors e.g. TAC1 (transcriptional activator of CDR genes) are a cause of azole resistance. Exposure to fluconazole, cause mutations in TAC1B which is located near the mating type locus, as the major regulator of CDR1 and CDR2 and this was found in many isolates of flucon azole-resistant C. auris45. Over expression of another efflux pump, MDR1 has also been found to be responsible for drug resistance in C.albicans isolates. Genetic alterations in MRR1 (multidrug resistance regulator 1), a zinc cluster transcription factor is the major factor for MDR1 over expression and multidrug resistance.  Mrr1p target genes encode oxido reductases and it has been suggested that MRR1 gain-of-function mutations may be in response to the oxidative damage of the cells due to azoles, and the up regulation of Mrr1p target genes may play a role to restore the intra cellular redox balance; thereby causing resistance46.

Figure 2: Overexpression of (a) ABC and (b) MDR1 efflux pump in azole-resistant Candida sp. Figure 2: Overexpression of (a) ABC and (b) MDR1 efflux pump in azole-resistant Candida sp.

Click here to View figure

Increased expression of ERG11 gene and enhanced ergosterol synthesis

Expression of a target enzyme is also up regulated in cell by increased transcription rate of a gene; by gene amplification; and by decreased degradation of the gene product. Additionally, transcriptional factors may play a major role in expression of gene and susceptibility towards azole drug. The Upc2p is a zinc finger transcription factor and acts as a key regulator that regulates the expression of genes involved in ergosterol biosynthesis, including ERG11 gene47. In C. albicans, a gain of functional mutation of Upc2p may lead to the increased production of the ergosterol, hence leading to resistance to fluconazole whereas, disruption of Upc2p results in enhanced fluconazole (FLC) activity. It was hence observed that Upc2p affects the azole susceptibility viaergosterol biosynthesis48,49.

Point mutations in ERG11 gene and amino acid substitution

The point mutations (insertion and deletion) in the ERG11 gene leads to the reduced binding of the azole drug and results in the origin of the clinically resistant isolates (Fig. 3). Mechanism of resistance is mostly studied in C. albicans.  Many amino acid substitutions have been found in the ERG11 gene product but only a few are experimentally confirmed to have a link with azole resistance50. Usually, amino acid substitution occurs in the hot spot regions of 105-165, 266-287, 405-488bpin Erg11p40. The molecular analysis has revealed that these substitutions occur in the catalytic site of the enzyme due to which there is a decrease in binding affinity of drugs44,51. For C. auris some specific substitution is in focus e.g. in South American and South Asian clade of C. auris K143R and Y132F substitution takes place, while in African clade, F126L substitution is most common52. In the case of C.glabrata such substitutions were not found and only a single case of this kind of resistance mechanism was found in C. glabrata51.

Figure 3: Mutation in Erg11 in azole-resistant Candida species Figure 3: Mutation in Erg11 in azole-resistant Candida species

Click here to View figure

Alteration of ergosterol biosynthetic pathway by inactivation of ERG-3 gene

Fungi is found in different kinds of environmental niches and is accompanied by diverse environmental stress53. For fungi, antifungals are also a kind of stress to which they adapt and try to survive43,54. The main mechanism of resistanceforC. albicans is the remodeling of the ergosterol biosynthesis pathway. This occurs as a result of the loss of functional mutation in ERG-3gene. ERG-3 gene is responsible for coding Δ-5,6desaturase and because of loss of function mutation, deactivation of this enzyme occurs due to which there is no accumulation of methylated sterols formed due to azole action on the fungal membrane55.  As a result there will be less loss of fungal cell by azoles i.e. decreased susceptibility of fungi to azoles. In C. albicans there are five missense mutations and two non-sense mutations, which are the reason for the loss of function and resistance for azoles50,56.

As true for stress response in every organism, chaperone such as (Hsp 90) works well in the fungal cell also. Hsp90 is a protein folding molecule and is considered as the main molecule involved in developing resistance in C. albicans. Alternatively, it was also observed that a very high amount of doxycycline is required to inhibit Hsp90 function in C. auris than C. albicans57. Hence, in C. auris, azole resistance arises due to increase in the function of efflux pump and is observed to be independent of Hsp90 57,58.

Besides the above important mechanisms, aneuploidy has also been found to play a role in azole resistance in Candida.Aneuploidy leads to genetic diversity by allelic imbalances and loss of heterozygosity (LOH) at any of parental allele. In fungal pathogen, this aneuploidy and LOH results in a change of working pattern of efflux pump and change in action site of the drug; and these factors together lead to resistance in fungi. Usually, a fungal cell has a good genetic diversity which results in phenotypic plasticity and ultimately resistance. In C. albicans, by the different combination of hybridization, it was found out that aneuploidy occurs on chromosome 1, 2, 5 which usually contributes to the resistance initiation59,60. This LOH often leads to the gain of function mutation for the efflux pump and other drug targets resulting in resistance. In C. albicans aneuploidy on chromosome 5 is more common and this resistance is linked to a high copy number of ERG11 and TAC1 gene60,61.

Modes of transmission of resistant fungi 

The environmental fungi undergo transmission from environment to hospital wards and exhibits cross-resistance to clinical azoles. Air can be a possible source for transmission of fungi from field to hospital especially the transmission of those fungi that sporulatee.g. A.fumigatus. Insects (especially insects belonging to Muscidae, Calliphoridae class) can also act as a means of transmission for resistant fungus62,63,64. Direct contact of farmers and workers during field management and post-harvest processing may also transfer fungus from field to humans. Raw fruits and vegetables are considered as a good source of nutrients and part ofgood healthy diet but their associated fungi have become a point of concern because of increasing resistance to antifungals. There is an increasing demand for these fresh raw fruits and vegetables that led to 25% increase in consumption of fruits from 1977-1979 to 1997-1999 in the USA65. This had prompted some industries to conduct risk analysis and management practice for these fresh produces but still, there are increasing number of diseases associated with fruit-consumption66. Researchers working in this field face the major challenge of lack of information among affected patients on the source of contamination and procurement of the raw fruits and vegetables consumed67. As all of these products usually follow a chain system in which farmer provide these resources to the wholesale market; and from these markets different distribution agency procures goods; so ultimately no one knows the real source of the infected fruits and vegetables. In 1995, there was a simultaneous breakout of SalmonellaStanley due to usage of alfalfa sprouts in the USA and Finland; which was finally traced down to a common source of contaminated seeds shipped by a merchant68. In different studies, it was found out that raw fruits and vegetables are also a good source for microbial transmission from field to human. In a study, nearly 184 yeasts were isolated that had a high percentage of Candida species responsible for causing diseases in human and all of these species showed decreased susceptibility to fluconazole (MIC ≥8mg/ml)24. Another study conducted in 14 countries over a population of 883 million; showed that nearly 2% population in every country is infected with fungal infection69. These results hence suggest the path for transmission of resistant fungi from the field to humans. Different agencies and institutes e.g. Food and drug administration (FDA), European medicines agency (EMA) regulate the usage of antifungal in fields70. CLSI (Clinical and Laboratory Standards Institute) and EUCAST (European Committee on Antimicrobial Susceptibility Testing) have provided protocol to check the susceptibility of different fungi for different drugs3. But there is no such committee to check and regulate the usage of azoles in different fields in India. Hence there is an urgent need to make guidelines for usage of azoles in agriculture that could break this chain of transmission of resistant fungal strains from fields to human.

Conclusion 

The fungal strains that are resistant to azoles have a great impact on human health. They generally acquire the resistance mechanism in the form of efflux pumps that lowers the concentration of a drug inside the cell or by other genetic modifications that decreases the susceptibility to drugs. The increase in azole resistance eventually leads to increase in virulence of such strains. Infections caused by these resistant isolates are more difficult to control by host defense mechanisms. Development of resistance to antifungal drugs generally leads to treatment failure in patients. However therapeutic failure in patients is dependent on many factors like immune status of host, site and severity of infection, drug interaction with target site, dosage of drug, cellularorganisation of the fungi, hyphal morphology, serotype, biofilm production and fungal load.Research in this field should focus on to establish the inter-linkages between the mutant fungal strains, theirresistance to agricultural azoles and eventual cross resistance to medical triazoles. However, even if relationship between the use of azole compounds and development of resistance in Candida is proven, further control of its spread and development of resistant isolates is almost impossible to curtail as they are already present in environment. The only limiting factor should be the judicial use of fungicides in horticulture and agriculture and stringent regulatory practices and surveillance for clinical testing of cultures of fungal isolates in human patients.

Acknowledgement

The authors express gratitude to Principal, Ramjas College, University of Delhi, for constant encouragement. KW, KJ and AY also wish to acknowledge Council of Scientific and Industrial Research (CSIR) and University Grants Commission (UGC) for financial support in the form of Junior Research fellowships.

Conflict of Interest

The authors declare that there are no competing interests.

References

  1. Nielsen M.N., Winding A.Microorganisms as indicators of soil health. National Environmental Research Institute. NERI Technical Report No. 388, Denmark 2002
  2. Russel P.E. A century of fungicide evolution. Journal of Agricultural Science 2005;143:11–25.
    CrossRef
  3. Ribas E., Ribas A.D., Spolti P., Del Ponte E.M., Donato K.Z., Schrekker H.,Fuentefria A.M.Is the emergence of fungal resistance to medical triazoles related to their use in the agroecosystems? A mini review. Brazilian journal of microbiology: publication of the Brazilian Society for Microbiology2016; 47(4): 793–799.
    CrossRef
  4. Fisher M.C., Henk D.A., Briggs C.J., Brownstein J.S., Madoff L.C., McCraw S.L.,Gurr S.J. Emerging fungal threats to animal, plant and ecosystem health. Nature2012; 484(7393): 186-194.
    CrossRef
  5. , Ferrari S., Coste A.T. Antifungal resistance and new strategies to control fungal infections. International journal of microbiology 2012; 2012: 713687.
    CrossRef
  6. Marr K.A., Carter R.A., Boeckh M., Martin P., Corey L. Invasive aspergillosis in allogeneic stem cell transplant recipients: changes in epidemiology and risk factors. Blood2002; 100(13): 4358–4366.
    CrossRef
  7. Guinea J., Torres-Narbona M., Gijón P., Muñoz P., Pozo F., Peláez T., de Miguel J.,Bouza, E. Pulmonary aspergillosis in patients with chronic obstructive pulmonary disease: incidence, risk factors, and outcome. Clinical microbiology and infection: the official publication of the European Society of Clinical Microbiology and Infectious Diseases2010; 16(7): 870–877.
    CrossRef
  8. Brown G.D., Denning D.W., Gow N.A., Levitz S.M., Netea M.G., White T.C. Hidden killers: human fungal infections. Science translational medicine2012; 4(165): 165rv13.
    CrossRef
  9. Armstrong-James D., Meintjes G., Brown G.D. A neglected epidemic: fungal infections in HIV/AIDS. Trends in microbiology2014; 22(3), 120–127.
    CrossRef
  10. Denning D.W. Minimizing fungal disease deaths will allow the UNAIDS target of reducing annual AIDS deaths below 500 000 by 2020 to be realized. Philosophical transactions of the Royal Society of London. Series B, Biological Sciences2016; 371(1709): 20150468.
    CrossRef
  11. Limper A.H., Adenis A., Le T., Harrison T.S. Fungal infections in HIV/AIDS. The Lancet. Infectious diseases 2017; 17(11): e334–e343.
    CrossRef
  12. Cavalheiro M., Teixeira M.C. CandidaBiofilms: Threats, Challenges, and Promising strategies. Front Med (Lausanne)2018; 5:28.
    CrossRef
  13. Richtel M., Jacobs A.A.Mysterious Infection, Spanning the Globe in a Climate of Secrecy. New York Times. from https://www.nytimes.com/2019/04/06/health/drug-resistant-candida-auris.html.2019.
  14. Kaufmann C.A., Marr K.A.,Thorner A.R. Management of candidemia and invasive candidiasis in adults. UpToDate. from https://www.uptodate.com/contents/management-of-candidemia-and-invasive-candidiasis-in-adults. 2019.
  15. Whaley S.G., Berkow E.L., Rybak J.M., Nishimoto A.T., Barker K.S., Rogers P.D. Azole antifungal resistance in Candida albicans and emerging non-albicans Candida species. Frontiers in microbiology2017; 7: 2173.
    CrossRef
  16. OseiSekyere J. Candida auris: A systematic review and meta-analysis of current updates on an emerging multidrug-resistant pathogen. MicrobiologyOpen2018; 7(4), e00578.
    CrossRef
  17. Lone S.A., Ahmad A. Candida auris-the growing menace to global health. Mycoses2019; 62(8): 620–637.
    CrossRef
  18. Kachalkin A.V., Abdullabekova D.A., Magomedova E.S., Magomedov G.G., Chernov I.Y.Yeasts of the Vineyards in Dagestan and Other Regions.  Mikrobiologiia2015; 84(3): 360-368.
    CrossRef
  19. Lund A. Studies on the ecology of yeasts. Munksgaard, Copenhagen.1954.
  20. Parle J.N., Di Menna M.E., The source of yeasts in New Zealand wines. New Zealand Journal of Agriculture Research1966; 9:98–107.
    CrossRef
  21. de Azeredo L.A., Gomes E.A., Mendonc a-Hagler L.C.,Hagler, A.N. Yeast communities associated with sugarcane in Campos, Rio de Janeiro, IntMicrobiol1998; 1:205–208.
  22. Wuczkowski M.,Prillinger H. Molecular identification of yeasts from soils of the alluvial forest national park along the river Danube downstream of Vienna, Austria (“Nationalpark Donauauen”). Microbiological research2004; 159(3): 263–275.
    CrossRef
  23. Hof H. Critical annotations   to   the   use   of   azole   antifungals   for   plant protection. Antimicrobial agents and chemotherapy 2001;45(11): 2987-2990.
    CrossRef
  24. Lo H.J., Tsai S.H., Chu W.L., Chen Y.Z., Zhou Z.L., Chen H.F., Le C.F., Yang Y.L. Fruits as the vehicle of drug-resistant pathogenic yeasts. The Journal of infection2017; 75(3): 254–262.
    CrossRef
  25. Devi P.I., ThomasJ.,Raju R.K. Pesticide consumption in India: A spatiotemporal analysis.  Agricultural Economics Research Review2017; 30(1): 163-172.
    CrossRef
  26. Iatta R., Caggiano G., Cuna T.,Montagna M.T. Antifungal susceptibility testing of a 10-year collection of Candida spp. isolated from patients with candidemia. Journal of chemotherapy (Florence, Italy)2011; 23(2): 92–96.
    CrossRef
  27. Warnock D.W. Trends in the epidemiology of invasive fungal infections. Nihon IshinkinGakkaizasshi. Japanese journal of medical mycology2007; 48(1): 1–12.
    CrossRef
  28. Yang Y.L., Ho Y.A., Cheng H.H., Ho M., Lo H.J. Susceptibilities of Candida species to amphotericin B and fluconazole: the emergence of fluconazole resistance in Candida tropicalis. Infection control and hospital epidemiology2004; 25(1): 60–64.
    CrossRef
  29. Chai L.Y., Denning D.W., Warn P. Candida tropicalis in human disease. Critical reviews in microbiology2010; 36(4): 282–298.
    CrossRef
  30. Yang Y.L., Cheng M.F., WangC.W., Wang A.H., Cheng W.T., Lo H.J., Tsary Hospitals. The distribution of species and susceptibility of amphotericin B and fluconazole of yeast pathogens isolated from sterile sites in Taiwan. Medical Mycology2010; 48(2): 328–334.
    CrossRef
  31. Yang Y.L., Lin C.C., Chang T.P., Lauderdale T.L., Chen H.T., Lee C.F., Hsieh C.W., Chen P.C., LoH.J. Comparison of human and soil Candida tropicalis isolates with reduced susceptibility to fluconazole. PLOS One 2012;7(4): e34609.
    CrossRef
  32. Pfaller M.A., Moet G.J., Messer S.A., Jones R.N.,Castanheira M. Geographic variations in species distribution and echinocandin and azole antifungal resistance rates among Candida bloodstream infection isolates: report from the SENTRY Antimicrobial Surveillance Program (2008 to 2009). Journal of clinical microbiology 2011;49(1): 396–399.
    CrossRef
  33. Azevedo M.M., Faria-Ramos I., Cruz L.C., Pina-Vaz C., Goncalves Rodrigues A. Genesis of azole antifungal resistance from agriculture to clinical settings. Journal of agricultural and food chemistry2015; 63(34): 7463-7468.
    CrossRef
  34. Arendrup M.C. Update on antifungal resistance in Aspergillus and Candida. Clinical microbiology and infection2014; 20: 42-48.
    CrossRef
  35. Snelders E., Rijs A.J., Kema G.H., Melchers W.J., Verweij P.E. Possible environmental origin of resistance of Aspergillusfumigatus to medical triazoles. Environ. Microbiology2009; 75(12): 4053-4057.
    CrossRef
  36. Verweij P.E., Snelders E., Kema G.H., Mellado E., Melchers W.J. Azole resistance in Aspergillusfumigatus: a side-effect of environmental fungicide use? The Lancet infectious diseases2009; 9(12). 789-795.
    CrossRef
  37. Chowdhary A., Kathuria S., Xu J.,Meis J.F. Emergence of azole-resistant Aspergillusfumigatus strains due to agricultural azole use creates an increasing threat to human health. PLoS pathogens2013; 9(11).
    CrossRef
  38. Russell P. Fungicide resistance: Occurrence and management. The Journal of Agricultural Science1995; 124(3): 317-323.
    CrossRef
  39. Perea S., López-Ribot J.L., Wickes B.L., Kirkpatrick W.R., Dib O.P., Bachmann S.P., Keller S.M., Martinez M. Patterson T.F. Molecular mechanisms of fluconazole resistance in Candida dubliniensis isolates from human immunodeficiency virus-infected patients with oropharyngeal candidiasis. Antimicrobial Agents and Chemotherapy2002; 46(6):1695-703.
    CrossRef
  40. Marichal P., Koymans L., Willemsens S., Bellens D., Verhasselt P., Luyten W., Borgers M., Ramaekers F., Odds F.C.,VandenBossche H. Contribution of mutations in the cytochrome P450 14alpha-demethylase (Erg11p, Cyp51p) to azole resistance in Candida albicans. Microbiology (Reading, England)1999; 145 (Pt 10): 2701–2713.
    CrossRef
  41. White T.C., Marr K.A., Bowden R.A. Clinical, cellular, and molecular factors that contribute to antifungal drug resistance. Clinical microbiology reviews1998; 11(2): 382–402.
    CrossRef
  42. Coleman J.J.,Mylonakis E. Efflux in fungi: la pièce de résistance. PLOS pathogens 2009; 5(6): e1000486.
    CrossRef
  43. Robbins N., Caplan T., Cowen L.E. Molecular Evolution of Antifungal Drug Resistance. Annual review of microbiology2017; 71: 753–775.
    CrossRef
  44. Revie N.M., Iyer K.R., Robbins N., Cowen L.E. Antifungal drug resistance: evolution, mechanisms and impact. Current opinion in microbiology2018; 45: 70–76.
    CrossRef
  45. Rybak J.M., Muñoz J.F., Barker K.S., Parker J.E., Esquivel B.D., Berkow E.L., Lockhart S.R., Gade L., Palmer G.E., White T.C., Kelly S.L., Cuomo C.A., Rogers P.D. Mutations in TAC1B: a Novel Genetic Determinant of Clinical Fluconazole Resistance in Candida auris. mBio2020; 11(3): e00365-20.
    CrossRef
  46. Morschhäuser J., Barker K.S., Liu T.T., BlaB-Warmuth J., HomayouniR., Rogers P.D. The transcription factor Mrr1p controls expression of the MDR1 efflux pump and mediates multidrug resistance in Candida albicans. PLoSPathog 2007; 3(11):e164.
    CrossRef
  47. Vasicek E.M., Berkow E.L., Flowers S.A., Barker K.S., Rogers P.D. UPC2 is universally essential for azole antifungal resistance in Candida albicans. Eukaryotic cell 2014; 13 (7): 933-946.
    CrossRef
  48. Tobudic S., Kratzer C.,Presterl E.Azole‐resistant Candida spp.–emerging pathogens? Mycoses2012; 55: 24-32.
    CrossRef
  49. Flowers S.A., Barker K.S., Berkow E.L., TonerG., Chadwick S.G., Gygax S.E., Morschhäuser J., Rogers P.D. Gain-of-function mutations in UPC2 are a frequent cause of ERG11 upregulation in azole-resistant clinical isolates of Candida albicans. Eukaryotic cell2012; 11(10): 1289–1299.
    CrossRef
  50. Morio F., Pagniez F., Lacroix C., Miegeville M., Le Pape P. Amino acid substitutions in the Candida albicans sterol Δ5,6-desaturase (Erg3p) confer azole resistance: characterization of two novel mutants with impaired virulence. The Journal of antimicrobial chemotherapy2012; 67(9): 2131–2138.
    CrossRef
  51. Hull C.M., Parker J.E., Bader O., Weig M., Gross U., Warrilow A.G., Kelly D.E., Kelly S.L. Facultative sterol uptake in an ergosterol-deficient clinical isolate of Candida glabrataharboring a missense mutation in ERG11 and exhibiting cross-resistance to azoles and amphotericin B. Antimicrobial agents and chemotherapy2012; 56(8): 4223–4232.
    CrossRef
  52. Lockhart S.R., Etienne K.A., Vallabhaneni S., Farooqi J., Chowdhary A., Govender N.P., ColomboA.L., Calvo B., Cuomo C.A., Desjardins C.A., BerkowE.L., Castanheira M., Magobo R.E., Jabeen K., Asghar R.J., Meis J.F., Jackson B., Chiller T.,Litvintseva A.P. Simultaneous Emergence of Multidrug-Resistant Candida auris on 3 Continents Confirmed by Whole-Genome Sequencing and Epidemiological Analyses. Clinical infectious diseases: an official publication of the Infectious Diseases Society of America 2017; 64(2):134–140.
    CrossRef
  53. Lee Y., Puumala E., Robbins N., Cowen L.E. Antifungal Drug Resistance: Molecular Mechanisms in Candida albicansand beyond. Chemical reviews2020; 10.1021/acs.chemrev.0c00199. 2020.
    CrossRef
  54. Cowen L.E., Lindquist S. Hsp90 potentiates the rapid evolution of new traits: drug resistance in diverse fungi. Science (New York, N.Y.)2005; 309(5744): 2185–2189.
    CrossRef
  55. Kelly S.L., Lamb D.C., Kelly D.E., Manning N.J., Loeffler J., Hebart H., Schumacher U.,Einsele H. Resistance to fluconazole and cross-resistance to amphotericin B in Candida albicans from AIDS patients caused by defective sterol delta5,6-desaturation. FEBS Letters1997; 400(1): 80–82.
    CrossRef
  56. Spettel K., Barousch W., Makristathis A., Zeller I., Nehr M., Selitsch B., Lackner M., Rath P.M., Steinmann J.,Willinger B. Analysis of antifungal resistance genes in Candida albicans and Candida glabrata using next-generation sequencing. PLOS One2019; 14(1): e0210397.
    CrossRef
  57. Kim S.H., Iyer K.R., Pardeshi L., Muñoz J.F., Robbins N., Cuomo C.A., Wong K.H., Cowen L. E. Genetic Analysis of Candida aurisImplicates Hsp90 in Morphogenesis and Azole Tolerance and Cdr1 in Azole Resistance. mBio 2019; 10(1): e02529-18.
    CrossRef
  58. Cowen L.E., Steinbach W.J. Stress, drugs, and evolution: the role of cellular signaling in fungal drug resistance. Eukaryotic cell2008; 7(5): 747–764.
    CrossRef
  59. Selmecki A., Bergmann S., Berman J. Comparative genome hybridization reveals widespread aneuploidy in Candida albicans laboratory strains. Molecular Microbiology2005; 55(5): 1553–1565.
    CrossRef
  60. Selmecki A., Forche A., Berman J. Aneuploidy and isochromosome formation in drug-resistant Candida albicans. Science (New York, N.Y.)2006; 313(5785): 367–370.
    CrossRef
  61. Coste A., Selmecki A., Forche A., Diogo D., Bougnoux M.E., d’Enfert C., Berman J.,Sanglard D. Genotypic evolution of azole resistance mechanisms in sequential Candida albicans isolates. Eukaryotic cell2007; 6(10): 1889–1904.
    CrossRef
  62. Iwasa M., Makino S., Asakura H., Kobori H., Morimoto Y. Detection of Escherichia coli O157: H7 from Muscadomestica (Diptera: Muscidae) at a cattle farm in Japan. Journal of medical entomology1999; 36(1): 108–112.
    CrossRef
  63. Talley J.L., Wayadande A.C., Wasala L.P., Gerry A.C., Fletcher J., DeSilva U., Gilliland S.E. Association of Escherichia coli O157: H7 with filth flies (Muscidae and Calliphoridae) captured in leafy greens fields and experimental transmission of E. coli O157: H7 to spinach leaves by house flies (Diptera: Muscidae). Journal of food protection 2009; 72(7): 1547–1552.
    CrossRef
  64. Sela S., Nestel D., Pinto R., Nemny-Lavy E., Bar-Joseph M. Mediterranean fruit fly as a potential vector of bacterial pathogens. Applied and environmental microbiology2005; 71(7): 4052–4056.
    CrossRef
  65. Pollack S.Consumer Demand for Fruit and Vegetables: The U.S. Example: Economic Research Service. Washington, DC, USA: United States Department of Agriculture. 2001.
  66. Sivapalasingam S., Friedman C.R., Cohen L.,Tauxe R.V.Fresh produce: a growing cause of outbreaks of foodborne illness in the United States, 1973 through 1997. Journal of food protection2004; 67(10): 2342–2353.
    CrossRef
  67. Berger C.N., Sodha S.V., Shaw R.K., Griffin P.M., Pink D., Hand P., Frankel G. Fresh fruit and vegetables as vehicles for the transmission of human pathogens. Environmental Microbiology 2010;12(9): 2385–2397.
    CrossRef
  68. Mahon B.E., Pönkä A., Hall W.N., Komatsu K., Dietrich S.E., Siitonen A., Cage G., Hayes P.S., Lambert-Fair M.A., Bean N.H., Griffin P.M.,Slutsker L. An international outbreak of Salmonella infections caused by alfalfa sprouts grown from contaminated seeds. The Journal of infectious diseases 1997; 175(4): 876–882.
    CrossRef
  69. Denning D.W. Calling upon all public health mycologists: To accompany the country burden papers from 14 countries. European journal of clinical microbiology and infectious diseases: official publication of the European Society of Clinical Microbiology2017; 36(6): 923–924.
    CrossRef
  70. Aparicio J.F., Mendes M.V., Antón N., Recio E., Martín J.F.Polyene macrolide antibiotic biosynthesis. Current medicinal chemistry2004; 11(12): 1645–1656.
    CrossRef

Characterization of hypothalamic Nuclei in Indian Fresh Water Spiny Eel Mastacembelusarmatus (Lacepede)

$
0
0

Introduction

Management and conservation of fish together with its breeding biology areessential for successful culture and mobilization of seed resources. Bothenvironmental and hormonal factors are extremely important in regulatingreproductive behavior and spawning in fishes. Various central mechanismstranslate environmental cues into chemical messengers which function to activateand maintain the reproductive organs. In this regard the functional relationshipbetween the hypothalamus and pituitary gland is important, and the pineal glandplays a positive role in regulating sexual maturation. Therefore environment,hypothalamus, pituitary and gonad are the four principle factors which areinterrelated and behave together (Malhotra and Gupta, 1985; Lal and Pandey,1998). The function of pituitary is mostly controlled by the hypothalamus through the synthesis and release of gonadotropin-releasing hormone(GnRH), therefore,acting as a major initiator of the hormonal cascade controlling the reproductiveaxis. Pituitary gonadotrophic hormones and GnRH are important in implicatingthese hormones in gonadal maturation and sex steroid production which plays avery important role in gametogenesis, final maturation of oocytes and spermiation(Parharet al., 2003; Lethimonieret al., 2004). Gonadal activities in teleost fishesprimarily depend on the function of pituitary gonadotrophs and that the pituitary and the gonads exist in a mutual state of excitation and inhibition (Farbridgeetal.,1985; Kaneko et al., 1986). The hypothalamo-hypophyseal complex invertebrates with their neurosecretory nuclei and long axons, is a coordination pointin the vertebrate brain and is known to involve in a complex interaction of a varietyof neurotransmitters which modulate the influence of several trophic hormones bycontrolling their active secretion by releasing or inhibiting hormones within thehypophysis itself (Peter et al., 1991).

Materials and methods

Adult male (average length 15.2 to 15.8 cm) and mean body weight (50g to 75g)and female (average length 17.5 to 17.7 cm) and mean body weight (55g to 70g) ofM. armatuswere procured fortnightly throughout the consecutive years fromparticular pond of Asansol in order to avoid ecological variations than can affectdevelopment of hypothalamus, pituitary and gonads. The fishes were collectedduring the second week of every month from January 2019 to December 2019.As the pituitary gland of M. armatuslodged inside sella turcica, it is difficultto dissect out the pituitary intact along with the brain. The entire brain was exposedby dissection from the dorsal aspect and subsequently immersed in 10% neutralformalin for hardening at the fish collection site. After 45 minutes, the brain including the hypothalamusand the pituitary gland were carefully dissected out from the cranium andsubsequently fixed in Bouin’s fixative, Zenker’s fluid and Eltman fixatives.After proper fixation, pituitary gland throughout the year were placed in 70%ethanol for overnight and subsequently dehydrated through ascending ethanolseries followed by acetone and then cleared in benzene. Tissues were thenembedded in paraffin wax (560C-580C melting point). Mid sagittal section andfrontal section of pituitary gland along with hypothalamus were cut at 4 μmthickness using a Leica RM 2125 RT microtome. Deparaffinized sections ofpituitary and hypothalamus were stained by techniques which areas follows: a)Chrome alum haematoxylinPhloxin (CAHP) (Gomori 1941). b)Aldehyde Fuchsin (AF) (Gabe, 1953).

Results

The cells of the NPO are situated above the optic chiasma in an oblique planeand lie on either side of the ventricle. The cells of the NPO in M. armatusshowconsiderable variation in morphological features and staining reactions (Fig.1).They may be divided into two groups viz., the pars magnocellularis (PMC) andpars parvocellularis (PPC). The PMC occupies the dorsal part of the nucleus and isgenerally composed of relatively larger cells measuring 16.2 μm to 20.5 μm indiameter. The nuclei are 7.5 μm to 9.2 μm. The nuclei of the cells of PMC take up deeper stain probably due to the presence of large amount of intranuclear granulesaround the nucleus (Fig.2). The PPC constitutes ventral part of the NPO. Itcomprises generally smaller cells measuring 12.5 μm to 14.2 μm in diameter(Fig.2). The cells of PMC and PPC are oval. The cytoplasm and nuclei of PMCand PPC varying in abundance and tinctorial intensity during different months ofthe year. The nuclei and surrounding areas of the PMC and PPC cells take up bluish purple colour in chrome alum haematoxylinphloxin stain (Fig.1) and deepaldehyde fuchsin stain (Fig.2) probably due to the presence of large amounts ofintranuclear granules around the nucleus.

Figure 1: NPO showing arrangement of nuclei on both side of the ventricle. (CAHP)x 150. Figure 1: NPO showing arrangement of nuclei on both side of the ventricle. (CAHP)x 150.

Click here to View figure

Figure 2: Enlargedview of NPO showing ventrally arranged pars parvocellularis (PPC) (solid arrows) and dorsally arranged pars magnocellularis (PMC) (brokenarrows). (AF) x 600. Figure 2: Enlargedview of NPO showing ventrally arranged pars parvocellularis (PPC) (solid arrows) and dorsally arranged pars magnocellularis (PMC) (brokenarrows). (AF) x 600.

Click here to View figure

The NLT extends longitudinally as far as plane corresponding to the pituitarygland (Fig.3). The cells of the NLT may be of two types viz., the larger cells or α– cells and the smaller or β – cells. This region is highly vascular. The cells of theNLT are paired and occupy nearer to the pituitary gland. The cells of the NLT areconnected by axonal pathway with the pituitary (Fig.3). The α – cells havedistinct nuclei with abundant cytoplasm and generally vary in size from 11.8 μm to14.6 μm. The nuclei generally range from 5.6 μm to 7.8 μm in diameter. The comparatively smaller cells or β – cells occupying a position lateral to α – cellswith scanty cytoplasm. The size varies from 9.2 μm to 11.6 μm and the nucleigenerally range from 3.8 μm to 5.0 μm. The cells of the NLT take reddish purplecolour in aldehyde fuchsin stain (Fig.4).

Figure 3: Showing the position of NLT above the pituitary and showing axonalpathway (broken arrows) from NLT. (CAHP) x 100. Figure 3: Showing the position of NLT above the pituitary andshowing axonalpathway (broken arrows) from NLT. (CAHP) x 100.

Click here to View figure

Figure 4: Enlarged view of NLT showing aggregation α – cells (broken arrows)and dispersed β – cells (solid arrows). (AF) x 600. Figure 4: Enlarged view of NLT showing aggregation α – cells (broken arrows)and dispersed β – cells (solid arrows). (AF) x 600.

Click here to View figure

Discussion

In the present investigation the nucleus preopticus (NPO) are paired, eachnuclear area being situated on either side of the third ventricle. The NPO iselongated in structure and the differentiated zones, the pars magnocellularis andpars parvocellularis. The shape of NPO in fishes has been reported to vary.Chandrasekhar and Khosa (1972) reported that in Ophiocephalus punctatus theNPO is located anteriorly at the point of emergence of the optic nerve while inClariasbatrachusand Heteropneustesfossilisthey occupy a position posterior to it. In the present study the cells of magnocellularis and parvocellularis are AF andCAHP positive.Anterior parvocelular preoptic (PPa) neurons exhibit very staining than neurons from magnocelular preoptic (PM) neurons (Laura Rincón et al., 2017), thus exhibits a close agreement with the author. A similar observation has also been identified in the preopticnuclei of certain teleosts (Sathyanesan and Haider, 1970; Sathyanesan, 1973;Rizkalla, 1976; Bose and Chakrabarti, 2018). Belsare (1967) opined that inOphiocephalus punctatus the occurrence of vacuoles in the cytoplasm and colloiddroplets in the vicinity of blood vessels indicate the state of secretory activity ofthe nucleus preopticus.At posterior diencephalic area, neurons form ventral hypothalamic area, located around diencephalic ventricle do show round and strongly stained nuclei, with scarce cytoplasm (Camilo R. Q et. al., 2019), also superimposed with present findings.

In the present observation, the neurosecretory nuclei of NLT are veryprominent and occupy a position nearer to the pituitary gland. The cells of the NLTas observed in the present study, may be divided into two subgroups. The comparatively larger α – cells are located anterior end of lateral wall of thehypothalamus and the β – cells are located above the pituitary gland. The nuclei ofα – cells and β – cells respond to CAHP and AF staining. Samuelsson et al., (1968)suggested that the groups of nerve fibre cells situated in the infundibular region ofthe teleost hypothalamus constitute the paired nucleus lateralis tuberis (NLT). Thedivision of NLT cells into two subgroups have been suggested by Desai andAkhunji (1971) in Pampus argenteus and Sathyanesan (1973) in Catlacatla. Desaiand Akhunji further reported AF negative and CAHP positive NLT cells in twospecies of Hilsa and Pampusrespectively. On the contrary, Jose and Sathyanesan(1977) reported that in Labeorohitathe ventromedian component of the NLT is AF positive whereas the anterolateral neurons are AF negative. This studyindicates that the cells of NLT vary in their staining reactions in fishes. In M.armatusaxons arising from NLT cells are traceable during the maturation andspawning periods when they come in close contact with blood capillaries. Theaccumulation of neurosecretory materials (nsm) occurs in the subterminal area andnsm are found to accumulate around the blood capillaries. The nsm play pivotal role in maintaining the hypothalamo – pituitary – gonadal cascade. Up-regulated transcription of brain FSHβ and LHβ along with ovarian ERαFSHR and LHR suggested positive feedback regulation in the HPGL-axis (Jie Hou,2016).Kasuga and Takahashi(1971), Sathyanesan and Jose (1975) have also made similar observations in otherteleosts. There is some relation between secretory phenomena in the NLT and thematuration of gonocytes (Belsare, 1967). In M. armatusit has been observed thatthe probable passages of neurosecretory materials from the NLT cells are along theaxonal routes as well as blood capillaries. The cells of the NLT undergo seasonalcyclical changes which appear to correspond with quantitative variations inpituitary gonadotrophin.Existence of a hypothalamic neurosecretory control over pituitary function that occurs in teleost fish was histologically demonstrated by Adina Popescu et.al. (2020).

Conclusion

In MastacembelusarmatusNPO are paired, each nuclear area being situated on either side of the third ventricle. The NPO is elongated in structure and the differentiated zones, the pars magnocellularis and pars parvocellularis. Both nuclei are CAHP and AF positive. The NLT are very prominent and occupy a position nearer to the pituitary gland. The cells of the NLT as observed in the present study, may be divided into two subgroups. The comparatively larger α – cells are located anterior end of lateral wall of the hypothalamus and the β – cells are located above the pituitary gland. The nuclei of α – cells and β – cells respond to CAHP and AF staining.Understanding the pituitary architecture and cell types for this fish species is of immense importance to save this indigenous variety by artificial breeding.

Acknowledgement

I would like to acknowledge Prof. (Retd.) P. Chakrabarti, Department of Zoology, The University of Burdwan and Mainak Banerjee, research scholar Department of Zoology, The University of Burdwan, for guiding me during the time of preparation of the manuscript.

Conflict of interest

Author does not have any conflict of interest.

References

  1. Adina Popescu, Daniela Cristina Ibanescu, FanicaBalanescu, ‘’Pituitary – lobulation and seasonal changes of the basophil pituitary in cyprinids’’. Animal Science. LXIII, (1), pp. 247-252, 2020.
    CrossRef
  2. Bose S. and P. Chakrabarti,‘‘Changes in the hypothalamus in relation totesticular cells during growth, maturation and spawning phases in thebrackishwater teleost Liza parsia(Ham.)’’. Indian J.Fish,65(1) , pp. 40-46, 2018.
  3. BelsareD.K. ‘‘Periodic activity of the pituitary gland and nucleuspreopticus in Channa punctatus’’. Zool. Polonica, 17, pp. 273-285, 1967.
  4. Camilo Riaño-Quintero, Edwin Gómez-Ramírez and Hernán Hurtado-Giraldo.Glyphosate commercial formulation effects on preoptic area and hypothalamus of Cardinal Neon Paracheirodonaxelrodi (Characiformes: Characidae). Neotropical Ichthyology, 17(4), e190025, 2019.
    CrossRef
  5. Chandrasekhar, K. and D. Khosa, ‘‘Histomorphological studies on theneurosecretory system of three genera of freshwater teleotean fishes’’. Proc. Ind.Acad. Sci., Sec. B, springer, 75(6),pp. 257 – 265. 1972.
    CrossRef
  6. Desai K. and U. U. Akhunji. ‘‘Histological studies on the hypothalamoneurohypophyseal complex of Pampus argenteus’’. Zool. Jap, 44 (3),pp. 161-169, 1971.
  7. M.G. Burke and J.K. Leatherland. ‘‘Seasonal changes in thestructure of the adenohypophysis of the brown bull head, Ictalurus nebulosus(Leusuer)’’. Cytobios, 44,pp. 49-66, 1985.
  8. Gabe M. ‘‘Sur quelques applications de la coloration par la fuchsine paraldehyde’’.Bull. Micr. Appl, Paris, 3,pp. 153-162, 1953.
  9. ‘‘Observations with differential stains on human islets of Langerhans’’. Amer. J. Path, 17(3), pp. 395, 1941.
  10. Jie Hou, Li Li , Ning Wu, YujingSu, Wang Lin, Guangyu Li, “Reproduction impairment and endocrine disruption in female zebrafish after long – term exposure to MC – LR : A life cycle assessment’’ Environmental Pollution, 208 (B), pp 477 – 485, 2016.
    CrossRef
  11. 11.  Jose T.M. and A.G. Sathyanesan. ‘‘Pituitary cytology of the Indian carp Labeorohita(Ham.)’’. Anat. Anz, 142(4), pp. 410-423,1977.
    CrossRef
  12. Kaneko T. K. Aida and J. Haryu. ‘‘Ultrastructural changes in thepituitary gonadotrophs during the annual reproductive cycle of the female chichibugoby, Triclenfiger obscurus’’. Cell Tissue Res, 246, pp. 137-144, 1986.
    CrossRef
  13. Kasuga, S. and H. Takahashi. ‘‘The preoptico-hypophysial neurosecretory system of the medaka, Oryziaslatipesand its changes in relation to the annual reproductive cycle under natural conditions’’. Bull. Fac. Hakkaido Univ,21(4),pp.259-268, 1971.
    CrossRef
  14. Lal K.K. and A.K. Pandey. ‘‘Hypothalamo-neurosecretory system of thefemale seabass, Lates calcarifer (Bloch), with special reference to gonadalmaturation’’. Indian J. Fish, 45, pp. 51-60, 1998.
    CrossRef
  15. Laura Rincón1, Martha J. Obando2, Mario O. Tovar, MatíasPandolfi and Hernan Hurtado, “Topological and histological description of preoptic area and hypothalamus in cardinal tetra Paracheirodonaxelrodi” (Characiformes: Characidae), Neotropical Ichthyology, 15(1), e160145, 2017.
    CrossRef
  16. Lethimonier, C., T. Madigou, J.A. plunoz-cueto, J.J. Lareyre and O. Kah. ‘‘Evolutionary aspects of GnRHs, GnRH neuronal systems and GnRHreceptors in teleost fish’’. Gen. comp. endocrinol, 135 (1), pp. 1-16, 2004.
    CrossRef
  17. Malhotra, Y.R. and K.Gupta, ‘‘Histophysiology of hypothalamohypophysealsystem in relation with reproductive cycle in Puntius sophore(Ham.)’’Zool. Orient, 2, pp. 59-65, 1985.
    CrossRef
  18. Parhar, I.S., T. Soga, S. Ogawa and Y. Sakuma. ‘‘FSH and LH-β subunitsin the preoptic nucleus: Ontogenic expression in teleost’’. Gen. Comp. Endocrinol,132(3), pp. 369-378, 2003.
    CrossRef
  19. Peter, R.E., V.L. Trudeau and B.D. Sloley.‘‘Brainregulation of reproduction in teleosts’’. Bull. Inst. Zool., Acad. Sinica (Monograph),16, pp. 89-118, 1991.
  20. Rizkalla. W. ‘The hypothalamic neurosecretory system of the marine teleost fish, Mugil auratus’. Risso. Acta Biol. Acad. Sci., Hung, 27(2-3),pp.163-170,1976.
  21. Samuelsson, B., B. Ernholm and G. Fridberg. ‘‘Light microscopic studies on the Nucleus Lateralis Tuberis and the pituitary of the perch, Leuciscus rutilus with reference to the nucleus-pituitary relationship’’. Acta Zoologica, 49(1-2),pp. 141- 153, 1968.
    CrossRef
  22. Sathyanesan, A.G. and S. Haider. ‘‘Hypothalamo-neurohypophysialcomplex of the teleost, Heteropneustesfossilis(Bl.) with some experimentalevidence on the regeneration of the neurosecretory tract’’. Ind. J. Exp. Biol, 8(3),pp. 174-178,1970.
  23. Sathyanesan, A.G. ‘‘Hypothalamo-hypophyseal neurosecretory system ofthe freshwater teleost, Catlacatla(Ham.)’’. Zool. Beitr, 19(2),pp. 163-178, 1973.
  24. Sathyanesan, A.G. and T.N. Jose. ‘‘Hypothalamo-hypophysial vascular and neurosecretory link in the teleost, Bagariusbagarius(Ham.)’’.Cell Tissue Organs, 93(3), pp. 387-398, 1975.
    CrossRef

Evaluation of Proximate and Heavy Metals in Twelve Edible Freshwater Macroinvertebrates of Poba Reserve Forest Assam, India

$
0
0

Introduction

Aquatic macroinvertebrates refer to the small organisms that have no internal skeletal system and live part or all of their lives in water. They comprise a diverse group of organisms that includes insects, molluscs, annelids and crustaceans. They show their presence in aquatic bodies by swimming, clinging or burrowing in the bottom substrate. Many aquatic insects and molluscs species are consumed worldwide due to their taste and seasonal availability.

This practice of consumption was an old and well-established tradition in many parts of the world and recently has gained popularity and acceptance due to the promising source of nutrition challenges facing the world [1- 3].The trend has gradually been increasing from tropical countries to Western societies [4]. Generally, it is used as ingredient in many cooking recipes in countries like Africa, Asia, South America, and Australia [5]. It is reported that the majority of edible macroinvertebrates contains a rich nutrient concentration [6, 7]. As a part of their daily diet, it may be an important component in eliminating deficiency diseases related to malnutrition [8]. With the rapid increase in human population size, there would be tremendous pressure on animal source foods. It is projected that the world population would exceed 9 billion around 2050 and there will be a food crisis due to a reduction in food production [9]. To combat this crisis, one of the alternatives of a protein-rich source is edible insects [7]. It has been speculated that a 10% increase in the global animal protein supply through mass production of insects would largely eliminate the malnutrition problem and also decrease the pressure on other protein sources [9]. Therefore, insects and other forms of terrestrial and aquatic macroinvertebrates may offer an important resource for humans nutrition and are worthy of development in various bio-prospecting aspects [7]. Although there is a considerable amount of information on the entomophagy and nutrient contents of terrestrial insects,the information on aquatic macroinvertebrates is scanty. The proliferation rate of insects is very high and many of them are pest on crops causing economic damage to farmers. The consumption of such insects is part and partial of the traditional pest management practices. However many edible terrestrial andaquatic macroinvertebratesare disease vectors[10,11]. So understanding these issues and refinement of traditional food habits is a major concern of an entomophagous community.

Figure 1: Map of study area (Poba reserve forest). Figure 1: Map of study area (Poba reserve forest).

Click here to View figure

Poba reserve forest (PRF) situated in the eastern part of Assam is a repository of a variety of aquatic fauna distributed heterogeneously in the aquatic bodies of the reserve forest. Many species of aquatic macroinvertebrates are used as non-conventional food by the ethnic communities inhabiting around the reserve forest.So far no detailed exploration on diversity and proximate nutrient analysis on aquatic macroinvertebrate fauna had been carried out. Realizing the paucity of information the present study was undertaken on 12 commonly preferred species by the consumers under phylum Arthropoda and Mollusca collected from different aquatic bodies of PRF. The inventorization of proximate nutrients composition may help the communities for the ideal quantity of intake of neutraceutically valuable invertebrate resources. Further, this information may encourage sustainable use of these alternative cheap sources of non-conventional food resources and for possible domestic and commercial uses.

Materials and Methods

Sample Collection

The samples were collected from different perennial and ephemeral water bodies of PRF (latitude 27˚50′11″N and Longitude 95˚17′45″E) of Assam, India covering an area of about 102.21 km2 of land. Some specimens were collected from local markets during the seasons of their availability. Collected specimens were brought to the laboratory, sorted and preserved in 80% ethanol for future uses. Identification of the recorded specimens was done following standard taxonomic keys [12-16] and available updated literature from IUCN along with the technical support of the Zoological Survey of India. Kolkata, India.

Proximate Analysis

Moisture, Ash, and fibre contents were carried out following standard methods [17]. Nitrogen was determined by the micro-Kjeldahlmethod [18]. Crude protein content was subsequently calculated by multiplying the nitrogen content by a factor of 6.25. Fat content was determined by using the Soxhlet extraction method [19]. Carbohydrate content was calculated by subtracting the sum of the weights of protein, fibre, ether extract and ash from the total dry matter and reported as nitrogen-free extractives [20].

Estimation of Minerals

Selected minerals were determined in an Inductively Coupled Plasma-Atomic Emission Spectrometry; (ARCOS, Simultaneous ICP Spectrometer, SPECTRO Analytical Instruments GmbH, Germany) after acid digestion of the tissue samples with nitric acid and perchloric acid (5:1v/v) respectively [21].

Statistical Analysis

Data of the analysis are presented as means ± standard error (SE). Mean differences in proximate and minerals concentrations among the twelve freshwater macroinvertebrates were determined with one-way ANOVA using LSD in SPSS (Version 21) Software. Significance was accepted at P ≤ 0.05 levels.

Results

The systematic position and taxonomic keys of the twelve recorded freshwater macroinvertebrates are listed in Table 1. Analysis of the proximate composition of the species depicts a fair amount of nutrients (Table 2). There were significant differences in the means of the proximate compositions among theanalyzedspecies (P< 0.05).The highest amount of moisture content was observed in Pilaglobosa(63.72%) and least in Sartorianaspinigera(45.72%).The ash content of the recorded species ranges from 3.29% to 12.46% highest in Corbiculaassamensis and least in Lamellidenscorrianus. The highest fibre content was recorded in Sartorianaspinigera(11.41%), Cybistertripunctatus(11.00%) andLethocerusindicus(11.31%) against the Lamellidenscorrianus(0.28%) having the least fibre content.For most of the species, crude protein was the most abundant substance ranged from 18.10%(Macrobrachiumassamense) to 50.50%(Lobothelphusafungosa). Lipid content was recorded highest in Sartorianaspinigera (16.32%) and least in Lamellidensmarginalis (2.05%). The mean value of carbohydrate content was 11.32 %, being highest in Bellamyabengalensis (22.54%), and lowest in Macrobrachiumassamense (5.25%).

Table 1: Systematic position and taxonomic keys of analysed freshwater Macroinvertebrates.


Class


Order


Family


Species Taxonomic Keys
Insecta


Coleoptera Dytiscidae Cybistertripunctatus(Olivier,1795)


Head transverse, slightly convex above, subrounded and slightly sloping in front, antennae filamentous, mandibles are heavily sclerotized, triangular and strongly toothed on the inner side lie closely above the lacinia and galea,the joint between the cardo and stipes is elbow-shaped, mesoscutellum composed of two lateral chitjnisedsclerites.
Hemiptera Belostomatidae


Lethocerusindicus(Lepeletier and servile,1825) Body narrowly elliptical, Antennae small; hidden inside a groove ventrally, Rostrum sharp and stout, the interocular region is little wider than the eye width, Scutellum little broader than hemelytra, sharp claws, Mid and hind legs provided with thick sets of swimming hairs on the ventral side.


Malacostraca


Decapoda

Potamonidae Lobothelphusafungosa(Alcock,1909) The carapace is almost square, cervical groove is hard to make out, outer orbital angle and the lateral epibranchial tooth prominent, antero-lateral borders of the carapace are subcristiform. The epigastric crests are not so continuous with the postorbital crests, and the latter is sharper, especially in their outer half.
Sartorianaspinigera

(Wood-Mason, 1871)

Carapace wide, gently convex and smooth with a slightly concave free edge. The antero-lateral margin of carapace is sharp with an epibranchial spine, orbits without large spines, and a distinct H-shaped deep gastric groove.
Paleomonidae Macrobrachiumassamense(Tiwari,1958) Body divided into head, thorax, and abdomen,head and thorax region joined to form cephalothorax which includes mandibles, flagella, rostrum and eye containing a stalk.The abdomen has six body segments with five pair of walking legs, last segments contain telson with  two pairs of dorsal spines, Rostrum is slightly slender reaching to the distal end of scaphocerite, rostral  tip slightly  upturned;
 

Gastropoda


Architaenioglossa

Viviparidae Bellamyabengalensis(Lamarck,1822) Shell thin, whorls gradually increasing, shallow sutures, rather straight sides.  Spire and body whorl of almost equal height, less rounded, with straight sides, aperture sub-circular with narrow black margin.
Ampullaridae Pilaglobosa(Swainson, 1822) Shell globose shaped, spacious, the upper surface of whorls obliquely flattened, suture not deep, spire depressed.
Sorbeoconcha Pachychilidae Brotiacostula (Brandt, 1974) Shell elongated, regularly increasing, prominent axial ribs with spires,sculpture with spiral ridges.


Bivalvia


Unionoida


Unionidae

Parreysiacorrugata (Muller,1774) Shell elliptical to oval, umbones prominent, ventral margin convex, cardinal teeth strong, not lamellar, greenish.
Lamellidenscorrianus (Lea,1834) Shell elongated and elliptical, periostracum smooth, dorsal margin straight with a dark brown and yellowish band.
Lamellidensmarginalis (Lamarck, 1819) Shell oblongated and ovoid-shaped, periostracum blackish-brown with a light brown border along the ventral margin, ventral margin slightly contracted in the middle
Veneroida

Cyrenidae

Corbiculaassamensis (Prashad,1928) Shell ovate, dorsal margin regularly arched convex, anterior side short and rounded, posterior broad and truncate, striae regular concentric, distinct, but not deep.

Table 2: Percentage Proximate composition.(% per 100 g Dry tissue).

Freshwater

Macroinvertebrates

Moisture Ash Fibre Crude

Protein

Total Carbohydrate Crude

Lipid

Sartorianaspinigera 45.72a

±0.45

8.61a

±0.39

11.41a

±0.40

35.24a

± 1.38

9.05a

± 0.32

16.32a

± 0.39

Macrobrachiumassamense 54.65b

± 0.58

11.00b

±0.26

6.04b

±0.31

18.10b

± 0.70

5.25b

± 0.11

9.11b

± 0.48

Parreysiacorrugata 52.37c

±0.50

5.28c

±0.14

4.37c

±0.13

27.62c

± 1.02

7.56c

±0.26

11.22c

±0.19

Lamellidenscorrianus 48.87d

±0.58

3.29d

±0.14

0.28d

±0.02

25.54c

±0.86

11.12d

±0.48

3.58de

±0.27

Lamellidensmarginalis 58.62e

±0.46

8.55a

±0.20

1.90e

±0.25

38.35e

± 0.88

7.45c

±0.39

2.05e

±0.04

Corbiculaassamensis 63.50f

±0.27

12.46b

±0.53

4.86c

±0.32

20.90f

± 0.46

7.89ca

±0.31

4.09de

±0.33

Pilaglobosa 63.72f

±0.50

8.28a

±0.24

0.95de

±0.04

33.31a

± 1.01

12.11d

± 0.32

3.12de

± 0.29

Bellamyabengalensis 56.80h

±0.27

10.52b

±0.32

6.47b

±0.15

35.67a

± 1.03

22.54g

± 0.60

2.53de

± 0.15

Cybistertripunctatus 47.00a

±0.57

3.58d

±0.21

11.00a

±0.27

26.54c

± 0.99

19.54h

± 0.36

12.35c

± 0.50

Brotiacostula 62.86i

±0.83

8.50a

±0.40

1.85e

±0.10

44.42h

± 0.96

21.89g

± 1.03

2.90de

± 0.27

Lethocerusindicus 46.76a

±0.48

3.53d

±0.30

11.31a

±0.30

22.67cf

± 0.74

5.86b

± 0.29

13.21k

± 0.35

Lobothelphusafungosa 53.03bc

±0.58

7.22a

±0.12

2.83e

±0.26

50.50j

± 1.30

5.59b

± 0.35

6.52g

± 0.37

Values with different alphabets in each column are significantly different at P ≤ 0.05 level.

The results of the analysis of selected minerals are given in Table 3. Calcium (Ca) content was highest in Bellamyabengalensis (138.62 mg/100g) and lowest in Parreysiacorrugata (5.44 mg/100g). The highest amount of Copper (Cu), Iron (Fe), Manganese (Mn) and Zinc (Zn) contents were observed in Macrobrachiumassamense(2.73 mg/100g), Sartorianaspinigera (35.02 mg/100g), Macrobrachiumassamense (11.42 mg/100g)andLethocerusindicus(3.71 mg/100g) and lowest in Cybistertripunctatus (0.08 mg/100g), Lobothelphusafungosa (0.76 mg/100g), Pilaglobosa (1.07 mg/100g) and Parreysiacorrugata (0.93 mg/100g) respectively. The presence of selected heavy metals Lead (Pb), Cadmium (Cd), Molybdenum (Mo), and Mercury (Hg) were not detected in any of the specimens.

Table 3: Mineral composition (mg/100g).

Freshwater

Macroinvertebrates

Ca Cd Cu Fe Mn Pb Zn Mo Hg
Sartorianaspinigera 125.44a

±1.48

ND 1.32a

±0.01

35.02a

±0.50

8.95a

±0.32

ND 3.52a

±0.12

ND ND
Macrobrachiumassamense 109.20b

±2.17

ND 2.73b

±0.22

28.65b

±0.24

11.42b

±0.34

ND 3.64a

±0.13

ND ND
Parreysiacorrugata 5.44c

±0.45

ND 0.13c

±0.01

6.85c

±0.26

7.35c

±0.09

ND 0.93b

±0.02

ND ND
Lamellidenscorrianus 113.25b

±0.08

ND 0.56d

±0.01

8.64d

±0.23

2.86d

±0.14

ND 1.52b

±0.08

ND ND
Lamellidensmarginalis 98.43e

±0.84

ND 1.32a

±0.09

4.24e

±0.10

7.95ac

±0.27

ND 2.31d

±0.03

ND ND
Corbiculaassamensis 114.62b

±1.19

ND 0.87e

±0.04

8.52d

±0.15

2.38d

±0.10

ND 2.13d

±0.04

ND ND
Pilaglobosa 19.87g

±1.82

ND 1.90f

±0.02

3.61e

±0.17

1.07f

±0.03

ND 1.14b

±0.04

ND ND
Bellamyabengalensis 138.62h

±1.03

ND 0.38d

±0.32

5.91c

±0.24

1.24f

±0.05

ND 3.61a

±0.19

ND ND
Cybistertripunctatus 11.87i

±0.43

ND 0.08c

±0.72

31.08f

±0.32

8.34ac

±0.20

ND 1.68b

±0.15

ND ND
Brotiacostula 19.87g

±0.95

ND 1.94f

±0.83

3.61e

±0.17

1.09f

±0.08

ND 1.14b

±0.01

ND ND
Lethocerusindicus 125.21a

±1.30

ND 0.59d

±0.02

26.05h

±0.04

10.21b

±0.10

ND 3.71a

±0.20

ND ND
Lobothelphusafungosa 129.62a

±0.85

ND 0.41d

±0.64

0.76j

±0.08

6.37e

±0.09

ND 2.06d

±0.03

ND ND

ND- Not detected

± Standard Error

Values with different alphabets in each column are significantly different at P ≤ 0.05 level.

Discussion

Studies on nutrient compositions of edible macroinvertebrates around the world show that most of them had a satisfactory amount of energy, protein, fats, fibres, minerals and vitamins [22-25].Although, some edible species such as Macrotermessubhyalinus is not rich in amino acids like tryptophan and lysine for compensating the nutritional gap [26].Reports on the nutritional aspects of some aquatic and terrestrial macroinvertebratesof the north-eastern region of India suggested the presence of many important nutrients [27-30].In the present study results of the analysis of proximate composition shows that there was a significant difference (P< 0.05) in the analyzed specimens (Table 2). The Variations in nutrient contents of edible macroinvertebrates aredue to the life stages, the prevalence of various biotic and abiotic factors in their habitats and diet [31-34].For example, the fatty acid composition of edible grasshopper Ruspoliadifferensis reported to be influenced by the plants on which they feed[35]. Methods of food processing also influence the nutrient content to a greater extend [31, 33].

Figure 2: Photographs of some freshwater Macroinvertebrates from the study sites: A. Parreysiafavidens; B. Bellamyabengalensis; C. Barytelphusafungosa; D. Brotiacostula; E. Cybistertripunctatus; F. Lamellidenscorrianus; G. Lethocerousindicus; H. Macrobrachiumassamense; I. Pilaglobosa J.Parreysiacorrugata Figure 2: Photographs of some freshwater Macroinvertebrates from the study sites: A. Parreysiafavidens;  B.Bellamyabengalensis; C. Barytelphusafungosa; D.Brotiacostula; E. Cybistertripunctatus;F. Lamellidenscorrianus; G. Lethocerousindicus;  H. Macrobrachiumassamense; I. Pilaglobosa J.Parreysiacorrugata

Click here to View figure

The present study revealed that the moisture content in Pilaglobosa was higher compared to other macroinvertebrate species under study. The high amount of moisture content in food materials makes them a risk of microbial deterioration and spoilage [36, 37]. The values (58.62%, 56.80%, 63.72%, 62.86%) obtained in this study were lower than the value (85.9%, 82.1%, 85.5%, and 83.2%) reported earlier [38] for Lamellidensmarginalis, Bellamyabengalensis, Pilaglobosa and Helix sp. respectively. Analysis of ash content of the studied specimens revealed 7.56% on average which corroborated with the ash content for Lethocerusindicus and Cybistertripunctatus[30] and higher than Lamellidensmarginalis, Bellamyabengalensis, Pilaglobosaand Helix sp. [38]. In general, the ash content of biological material is a reflection of the minerals contents in them and may be beneficial for the human body [39, 40].The present findings of mean protein content ranged from 18.10 to 50.50 % (Table 2). The protein content of Lamellidenscorrianus and Lamellidensmarginalis in the present study slightly varied with the findings of other reports [27, 38].The possible cause of variation in protein content may be associated with the reproductive stages of the specimens [41, 42].The carbohydrate content of the studied specimens ranges from 5.25 to 22.54 %which is higher than the report of Shantibala et al. (2014) [30].Carbohydrates serve as a source of energy for aquatic fauna and perform many major structural roles in cells [43]. Generally, the ratio for carbohydrate content is less compared to other nutrients in aquatic organisms and fluctuates widely in response to changes in its habitat conditions [44].The lipid content of the studied specimens ranges from 2.05 to 16.32 (Table 2) which is higher compared to the studies on mollusc and edible arthropods species [24, 27].Sartorianaspinigera(16.32%), Cybistertripunctatus(12.35%) and Lethocerusindicus (13.21%)had the highest crude lipid content species which could contribute a significant source of dietary lipids.The crude fiber contents of the macroinvertebrate species in this study were quite similar with the other insect species such as termites and Componotussp. [45, 46]. Crude fibre has a significant physiological role in the organism’s body in maintaining internal distension for proper peristaltic movement of the intestinal tract [47]. A diet with low fibre content is associated with constipation. Food materials with high fibre content have been used for weight control and fat reduction, as they give a sense of satiety even when a small amount of food is consumed [48].

Minerals are the most important factors for the human body in maintaining several physiological processes and are constituents of bones, teeth, tissue, blood, muscles and nerve cells. Many insect species contain a satisfactory amount of minerals such as iron which boast almost equal iron contents tobeef containing about 6 mg per 100 g of dry weight[33]. In the present study,the most abundant mineral was calcium ranged from 5.44 to 138.62 mg/100g (Table 3).The calcium content of Pilaglobosa (19.87 mg/100g), Bellamyabengalensis(138.62 mg/100g), Helixsp (19.87 mg/100g)andLamellidensmarginalis (98.43 mg/100g) was lower than the studies reported earlier[38].Calcium is an important nutrient that has a vital role in neuromuscular functioning, enzyme-mediated processes and blood clotting. Therefore a constant concentration of calcium in the body is necessary.The second most abundant mineral in the present study was iron which is a component of haemoglobin and myoglobin that acts as a carrier molecule and as a cofactor of various enzymes [49]. Most of the analyzed specimens have a considerable amount of iron (Table 3) compared to other terrestrial insects, such as Bombyxmori[50]. Minerals like Zinc and Copper are the sole components of many enzymes involved in many physiological activities [51]. Deficiency of zinc has become a major public health problem especially for developing children and maternal health. Deficiency of this mineral can cause retardation of growth, Delayed sexual maturation, skin lesions, increased susceptibility to infections[52].The present analyzedspecimens have zinc contents of 0.93 mg/100g(Parreysiacorrugata) to 3.71 mg/100g(Lethocerusindicus) which is lower than the amount for beef (12.5mg/100g) and palm weevil larvae (26.5mg/100g) [33].

Heavy metal contamination in the aquatic organism, generally in Mollusca is a serious concern as they occur at the very low trophic levels in the food chains. Snails can accumulate metals higher than any other group of invertebrates [53]. However, in the present study evaluation of minerals depicted devoid of heavy metal contents suggesting the studied species can be used for consumption. The absence of heavy metal alone can’t be considered for safe consumption. Some edible insects containnaturally content toxic substances such as cyanogenic glycosides[54]. Consumption of grasshopper and locust if consumed without removing their feet can cause intestinal blockage.Similarly,Chitin covering of the exoskeleton of many insects is generally indigestible and causes allergies [55].There is also a risk of microbial disease transmission as Intestinal microbiota of many terrestrial and aquatic insects could be a favourable growth medium for undesirable microorganisms[10, 11].

In different parts of the world Aquatic insects such as mayflies are well harvested and eaten in countries like China, Vietnam, Japan and New Guinea[56]. In Thailand, many aquatic species of Nepidae, Hydrophilidae, Dytiscidae, Nepidae, Notonectidae and Belostomatidaeare reported to be commonly used edible insects[57].In India, about 255 insect species are used as non-conventional food by different ethnic tribes during the seasons of their availability. Among these, the most preferred species belongs to the family of Coleoptera followed by Orthoptera, Hemiptera, Hymenoptera, Odonata, Lepidoptera and Isoptera[58, 59].

Many reports on entomophagy revealed that it is practiced in all seven states of the north-eastern region of India [60-62]. More recently the enormous diversity of insects and other macroinvertebrate fauna are speculated as one of the major sources of future therapeutic agents. Ironically the poor section of the society across various communities consumes a good number of insects and mollusc species available around their localities as traditional food habits to meet their therapeutic and nutritional requirements during the lean period.

However, detail scientific knowledge on this food practice is quite scanty among the user communities. Therefore the present study is a kind of scientific validation of these traditional food habits which may lead to the inventorization and utilization of bio-resources having nutritional and therapeutic potentials in a sustainable approach.

Conclusion

The result of the present work reflects that most of the analyzed freshwater macroinvertebrates have a fair amount of crude protein, carbohydrate, lipids and minerals.The studied macroinvertebrate species represented the most preferred and the cheapest source of protein among the ethnic communities of the study area. This practice of entomophagy should be encouraged as many people can’t afford protein-rich food such as fish or meat. At the same time more exploration and its identification, as well as proper scientific research on the nutritional and anti-nutritional composition, are needed to study the prevailing freshwater macroinvertebrate consumption in the study area which would prove beneficial as a local source of nutrients. Further, the information on nutritional aspects could be effectively used for better utilization of freshwater macroinvertebrates to combat malnutrition and undernourishment of the poor people of the society.

Acknowledgements

The authors are thankful to the Department of life sciences, Dibrugarh University, Assam and Z.S.I Kolkata for the technical support and facilities for carrying out this work.

Conflict of Interest 

The authors have no conflict of interest.

References

  1. Omotoso O.T. Nutritional quality, functional properties and anti-nutrient compositions of the larva of Cirinaforda (Westwood) (Lepidoptera: Saturniidae). Journal of Zhejiang University Science B. 2006; 7(1): 51-55.
    CrossRef
  2. Durst P.B., Johnson D.V., Leslie R.N., Shono K (ed): Forest insects as food: humans bite back. RAP publication. 2010.
  3. Ash C., Jasny B.R., Malakoff D.A., Sugden A.M. Feeding the future. 2010; 327(5967): 797-797.
    CrossRef
  4. Mlček J., Rop O., Borkovcova M., Bednar M.A. A comprehensive look at the possibilities of edible insects as food in Europe -A review. Polish Journal of Food and Nutrition Sciences. 2014; 64: 147-157.
    CrossRef
  5. Kim S.K., Weaver C.M., Choi M.K. Proximate composition and mineral content of five edible insects consumed in Korea. CyTA-Journal of Food. 2017; 15(1): 143-6.
    CrossRef
  6. Bukkens S.G. The nutritional value of edible insects. Ecology of Food and Nutrition. 1997; 36(2-4): 287-319.
    CrossRef
  7. Xiaoming C., Ying F., Hong Z., Zhiyong C. Review of the nutritive value of edible insects. Proceeding of a workshop on Asia-Pacific resources and their potential for development, Chiang Mai, Thailand. 2008; 85-92.
  8. Mishra N., Hazarika N.C., Narain K., Mahanta J. Nutritive value of non-mulberry and mulberry silkworm pupae and consumption pattern in Assam, India. Nutrition Research. 2003; 23(10): 1303-11.
    CrossRef
  9. Alexandratos N. World food and agriculture to 2030/50. In: Highlights and views from MID-2009: Paper for the Expert Meeting on “How to Feed the World. 2009.
  10. Klunder C., Wolkers-Rooijackers J., Korpela J.M., Nout M.J.R. Microbiological aspects of processing and storage of edible insects. Food control. 2012; 26(2): 628-631.
    CrossRef
  11. Kouřimská L., Adámková A. Nutritional and sensory quality of edible insects. NFS journal. 2016; 4: 22-26.
    CrossRef
  12. SubbaRao N.V. Handbook of Freshwater Molluscs of India. Zoological Survey of India, Kolkata. 1989.
  13. Dey A. Handbook on Indian freshwater molluscs. AICOPTAX-Mollusca, Zoological Survey of India. 2007.
  14. Subramanian K.A., Sivaramakrishnan K.G. Aquatic Insects of India-A Field Guide. Ashoka Trust for Ecology and Environment (ATREE), Bangalore, India. 2007; pp 62.
  15. Bal A., Basu R.C. Insecta: Hemiptera: Mesoveliidae, Hydrometridae, Veliidae&Gerridae. In: State Fauna Series 5, Fauna of West Bengal, Zoological Survey of India Calcutta, Part 5. 1994; 511-534.
  16. Needham J.G., Needham P.R. A guide to the study of freshwater biology. Holdenday. Inc. San Fransisco. 1962.
  17. Horwitz W., Latimer G.W. Official methods of analysis of AOAC 18. AOAC International, Gaithersburg, Md. 2005.
  18. Pearson D. Chemical Analysis of Foods. 7th Ed. Livingstone, London, Churchill. 1976; pp 7-11.
  19. Deutsch M.J. AOAC official method 985.29. Total dietary fiber in foods, enzymatic-gravimetric method. Official methods of analysis of AOAC international. 1995.
  20. James C.S.(ed): Analytical chemistry of foods. Springer Science & Business Media. 2013.
  21. Puwastien P., Siong T.E., Kantasubrata J., Caven G., Felicionoand R.R., Judprasong K. Asean manual of food analysis. Regional Centre of ASEAN network of Food Data System. Institute of Nutrition, Mahidol University. 2011; pp 1-90.
  22. Rumpold B.A., Schlüter O.K. Nutritional composition and safety aspects of edible insects. Molecular Nutrition and Food Research. 2013; 57(3): 802-823.
    CrossRef
  23. Ramos Elorduy J. The importance of edible insects in the nutrition and economy of people of the rural areas of Mexico. Ecology of Food and Nutrition. 1997; 36: 347-366.
    CrossRef
  24. Xiaoming C., Ying F., Hong Z., Zhiyong C. Review of the nutritive value of edible insects. In: Forest insects as food: humans bite back, proceedings of a workshop on Asia-Pacific resources and their potential for development (Durst P.B., Johnson D.V., Leslie R.L., Shono K, ed). Bangkok, FAO Regional Office for Asia and the Pacific. 2010.
  25. Womeni H.M., Linder M., Tiencheu B., Mbiapo F.T., Villeneuve P., Fanni J., Parmentier M. Oils of insects and larvae consumed in Africa: potential sources of polyunsaturated fatty acids. Oléagineux, Corps gras, Lipides. 2009; 16(4-5-6): 230-5.
    CrossRef
  26. Sogbesan A., Ugwumba A. Nutritional evaluation of termite (Macrotermessubhyalinus) meal as animal protein supplements in the diets of Heterobranchuslongifilis. Turkish Journal of Fisheries and Aquatic Sciences. 2008; 8: 149-157.
  27. Sonowal J., Kardong D. Nutritional evaluation of freshwater bivalve, Lamellidens spp. from the upper Brahmaputra basin, Assam with special reference to dietary essential amino acids, omega fatty acids and minerals. Journal of Environmental Biology. 2020; 41(4): 931-941.
    CrossRef
  28. Singh R.K., Alka K., Singh O.G., Singh K.K. Protein and carbohydrate contents of certain edible insects in Manipur. Indian Journal of Entomology. 2015; 77(3): 235-239.
    CrossRef
  29. Mishra N., Hazarika N.C., Narain K., Mahanta J. Nutritive value of non-mulberry and mulberry silkworm pupae and consumption pattern in Assam, India. Nutrition Research. 2003; 23(10): 1303-11.
    CrossRef
  30. Shantibala T., Lokeshwari R.K., Debaraj H. Nutritional and antinutritionalcomposition of the five species of aquatic edible insects consumed in Manipur, India. Journal of Insect Science. 2014; 14(1).
    CrossRef
  31. Van Huis A., Van Itterbeeck J., Klunder H., Mertens E., Halloran A., Muir , Vantomme P. Edible insects: future prospects for food and feed security (No. 171). Food and Agriculture Organization of the United Nations. 2013.
  32. Ademolu K.O., Idowu A.B., Olatunde G.O. Nutritional value assessment of variegated grasshopper, Zonocerusvariegatus (L.) (Acridoidea: Pygomorphidae), during post-embryonic development. African Entomology. 2010; 18(2): 360-364.
    CrossRef
  33. Bukkens S.G.F. Insects in the human diet: nutritional aspects. In: Ecological implications of minilivestock; role of rodents, frogs, snails, and insects for sustainable development (M.G. Paoletti, ed.). New Hampshire: Science Publishers. 2005; pp 545–577.
  34. Oonincx D.G., van Itterbeeck , Heetkamp  M. J., Van den Brand  H., van Loon J.J., van Huis A. An exploration on greenhouse gas and ammonia production by insect species suitable for animal or human consumption. Plos One. 2010; 5(12): e14445.
    CrossRef
  35. Rutaro K., Malinga G.M., Lehtovaara V.J., Opoke R., Valtonen A., Kwetegyeka J., Nyeko P., Roininen H. The fatty acid composition of edible grasshopper Ruspoliadifferens (Serville) (Orthoptera: Tettigoniidae) feeding on diversifying diets of host plants. Entomological Research. 2018; 48(6): 490-498.
    CrossRef
  36. De W Blackburn C. (ed): Food spoilage microorganisms. Woodhead Publishing. 2006.
    CrossRef
  37. Majumdar A., Pradhan N., Sadasivan J., Acharya A., Ojha N., Babu S. Bose S. Food Degradation and Foodborne Diseases: A Microbial Approach. In: Microbial Contamination and Food Degradation. Academic Press. 2018; pp 109-148.
    CrossRef
  38. Baby R.L., Hasan I., Kabir K.A., Naser M.N. Nutrient analysis of some commercially important molluscs of Bangladesh. Journal of Scientific Research. 2010; 2(2): 390-6.
    CrossRef
  39. Adeyeye E.I. Bio-concentration of macro and trace minerals in four prawns living in Lagos Lagoon. Pakistan Journal of Scientific and Industrial Research. 2000; 43: 367-373.
  40. Kinyuru J.N., Kenji G.M., Muhoho S.N., Ayieko M. Nutritional potential of longhorn grasshopper (Ruspoliadifferens) consumed in Siaya district, Kenya. Journal of Agricultural Science and Technology. 2010; 12: 32-46.
  41. Lee S.Y. Growth and reproduction of the green mussel Pernaviridis (L.) (Bivalvia: Mytiliacea) in contrasting environments in Hong Kong. Asian Marine Biology.1986; 3: 111-127.
  42. Wafer M.V.M.,Vijayaraghawan S., Krishnakumari L. Seasonal changes in the nutritive values of the Green Mussel Mytilusviridis (L.). Indian Journal of Marine Science. 1976; 5: 252-254.
  43. Lairson L.L., Henrissat B., Davies G.J., Withers S.G. Glycosyltransferases: structures, functions, and mechanisms. Annual Review of Biochemistry. 2008; 77: 521-55.
    CrossRef
  44. Babu A., Kesavan K., Annadurai D., Rajagopal S. Bursa spinosa– A mesogastropod fit for human consumption. Advance Journal of Food Science and Technology. 2010; 2(1): 79-83.
  45. Adeduntan S. A. Nutritional and antinutritional characteristics of some insects foraging in Akure forest reserve Ondo state, Nigeria. Journal of Food Technology. 2005; 3: 563-567
  46. Mbah C.E., Elekima G.O.V. Nutrient composition of some terrestrial insects in Ahmadu Bello University, Samaru Zaria Nigeria. Science World Journal. 2007; 2(2).
    CrossRef
  47. Oduor P.M., Struszczyk M.H., Peter M.G. Characterisation of chitosan from blowfly larvae and some crustacean species from Kenyan marine waters prepared under different conditions. Discovery and Innovation. 2008; 20(2): 129-36.
  48. Ekop E.A., Udoh A.I., Akpan P.E. Proximate and anti-nutrient composition of four edible insects in AkwaIbom State, Nigeria.World Journal of Applied Science and Technology.2010; 2(2): 224-31.
  49. Beard J., Han O. Systemic iron status. BiochimicaetBiophysicaActa (BBA)-General Subjects. 2009; 1790(7): 584-8.
    CrossRef
  50. Dunkel D. Nutritional values of various insects per 100 grams. The Food Insect Newsletter. 1996; 9: 1-8.
  51. Halfdanarson T.R., Kumar N., Li C.Y., Phyliky R.L., Hogan W.J. Hematological manifestations of copper deficiency: a retrospective review. European journal of haematology. 2008; 6: 523-31.
    CrossRef
  52. World Health Organization. Food and Agriculture Organization of the United Nations. Human vitamin and mineral requirements. Vitamin E, Report of a joint FAO/WHO expert consultation, Bangkok, Thailand. Rome: World Health Organization. Food and Agriculture Organization. 2002; 121-31.
  53. Zhou Q., Zhang J., Fu J., Shi J., Jiang G. Biomonitoring: an appealing tool for assessment of metal pollution in the aquatic ecosystem. 2008; 606(2): 135-50.
    CrossRef
  54. Zagrobelny M., Dreon A.L., Gomiero T., Marcazzan G.L., Glaring M.A., Møller B.L., Paoletti M.G. Toxic moths: source of a truly safe delicacy. Journal of Ethnobiology. 2009; 29(1): 64-76.
    CrossRef
  55. Van der Fels H.J. Risk profile related to production and consumption of insects as food and feed: EFSA Scientific Committee. EFSA Journal. 2015; 13(10): 4257.
    CrossRef
  56. Williams D.D., Williams S.S. Aquatic insects and their potential to contribute to the diet of the globally expanding human population. 2017; 8(3): 72.
    CrossRef
  57. Hanboonsong Y. Edible Insects and Associated Food Habits in Thailand. In: Forest Insects as Food: Humans Bite Back; Proceedings of a Workshop on Asia-Pacific Resources and Their Potential for Development. (Durst, P.B., Johnson, D.V., Leslie, R.L., Shono, K., Eds.) FAO Regional Office for Asia and the Pacific: Bangkok, Thailand. 2010; 173-182.
  58. Hazarika H.N. Entomophagy with special reference to Assam. International Journal for Research in Engineering Application & Management. 2018; 4(4): 458-62.
  59. Sangma R.H., Pal R., Singh D.R. Edible Insects of Northeast India. In:Bioprospecting of indigenous bioresources of North-East India. Springer, Singapore. 2016; pp 253-267.
    CrossRef
  60. Pathak K.A., Rao K.R. Insect pests as human food of tribals in North Eastern Region of India. Indian Journal of Entomology. 2000; 62(1): 97-100.
  61. Chakravorty J., Ghosh S., Meyer-Rochow V.B. Comparative survey of entomophagy and entomotherapeutic practices in six tribes of Eastern Arunachal Pradesh (India). Journal of Ethnobiology and Ethnomedicine. 2013; 9(1): 50.
    CrossRef
  62. Ronghang R., Teron R., Tamuli A.K., Rajkhowa R.C. Traditional zootherapy practiced among the Karbis of Assam (India). The Ecoscan. 2011; 1: 161-6.

Analysis of HMG-Coareductase Protein in Poaceae Family and Animals Samples by using Bioinformatics Tools

$
0
0

Introduction

According to structural and functional characteristics, plants have two important groups of metabolites, which are termed as primary metabolites (DNA, RNA, amino acids, unsaturated fatty acids) and secondary metabolites (not required for the growth or reproduction of an organism but are produced by plants for having a selective advantage in the environment). Under the class of secondary metabolites, terpenoids contribute to being the biggest groups of organic compoundwhich contribute to significant biological functions of plants, for example, terpenoids contribute to the colour, scent and flavour (carotenoid and chlorophyllin) in plant and also play an role in the defence mechanism of plant. Terpenoids are also an important part of traditional herbal medicine and has been used for its digestive, anti-inflammatory, anticancer, antiseptic, antioxidant, astringent, digestive, diuretic properties.

Trepenoids biosynthesis can occur through two routes in plants: theMethylerythritol Phosphate Pathway, which is non-mevalonate pathway and the second is mevalonate pathway. The Methylerythritol Phosphate Pathwayoccurs in the cytoplasm which results in synthesis of Triterpenoids and sesquiterpenoids, whilemevalonate pathwaytakes place in the plastid which results inproduction of monoterpenoids, diterpenoid, and tetraterpenoids.In the synthesis of trepenoid, the 2, 3-oxidosqualene undergoes cyclization reaction in presence ofoxidosqualene cyclase, which acts as a catalase. Only one form ofoxidosqualene cyclase which is lanosterol synthase (sterol biosynthesis) is present in fungi and animals.Higher plants of kingdom plantae have a more than one form of oxidosqualene cyclase. The molecular variety of oxidosqualene cyclasesresults inaround 100 varieties of triterpenoids in plants. Dozens of oxidosqualene cyclaseare isolated from model plants as well as harvests.

Figure 1: triterpenoid ¬biosynthetic pathway (Kegg pathway)¬. Figure 1: triterpenoid ­biosynthetic pathway (Kegg pathway)­.

Click here to View figure

Figure 2: Mevalonate biosynthesis Figure 2: Mevalonate biosynthesis.

Click here to View figure

As appeared in Fig. 2 (Kegg Pathway Database), the HMG-CoA is a fundamental protein required in production of mevalonate, which is required in the mevalonate pathway for synthesis of terpenoids. HMG-CoA Reductaseis a rate-restricting protein, thus lovastatin is used for its repression. HMG-CoA Reductaseis deeply studied in archaebacterial family, microbial family, kingdom Plantae andAnimalia. Upregulation of HMG-CoA reductase in the trepenoid pathway in transgenic plants has resultedin increment in production of triterpenoid. Though it is observed that random metabolic imbalances tend to cause hindrance growth of transgenic plants.Further studies found that catalytic domain of HMG-CoA Reductasecan be co-overexpressed, to reduce the growth inhibition brought by the individual overexpression of the catalytic domain of HMG-CoA Reductaseprotein.

HMG-CoA Reductase protein present in plants has 3 motif present in its catalytic domains, HMG Co-A Reductase protein in plants has a prism like structure, and this is because of the presence of 3 domains in the catalytic region of the protein.Studies have suggested that these 3 motifs are highly conserved sequences inHMG-CoA Reductaseprotein family. Analysis of these domains can be helpful in primer designing for amplification and isolation of HMG-CoA Reductase proteins. For this particular research, I used bioinformatics tools for investigation and examination ofstructural, functional and phylogenetic connectionsof the HMG-CoA Reductase protein sequences in Poaceae family and 3 animal samples.

Figure 3: Alignment of multiple sequences of HMG-CoA Reductase protein in Poaceae and other animal  Figure 3: Alignment of multiple sequences of HMG-CoA Reductase protein in Poaceae and other animal

Click here to View figure

Fig 3: Alignment of multiple sequences of HMG-CoA Reductase protein in Poaceae and other animal samplesunder study. Increasing shades of blue residues: match the percentage of identity (conserved domains); multiple sequence alignment was performed with Clustal Omega using CLUSTAL-W method.

Retrieval of HMG-CoA Reductase protein sequence

Materials and Techniques

Entirety of protein sequences(HMG-CoA Reductase)of Poaceae and 3 samples including Homo sapiens, Mus pahari and Drosophila mojavensis (Total Ninety Nine Sequences) were retrieved from protein database of NCBI(http://www.ncbi.nlm.nih.gov; accessed on September 2020) as recorded in Table 1.

Table 1: The seventeen species studied in this bioinformatic analysis.

Index

Species

Family

1

Triticum aestivum

Poaceae 

2

Zea mays

Poaceae 

3 Dichanthelium oligosanthes Poaceae
4 Aegilops tauschii Poaceae
­­­­5 Setaria italica Poaceae
6 Oryza brachyantha Poaceae
7 Panicum hallii Poaceae
8 Panicum miliaceum Poaceae
9 Pediococcus acidilactici Poaceae
10 Brachypodium distachyon Poaceae
11 Triticum urartu Poaceae
12 Oryza sativa Poaceae
13 Sorghum bicolor Poaceae
14 Drosophila mojavensis Drosophilidae
15 Homo sapiens Hominidae
16 Hordeum vulgare Poaceae
17 Mus pahari Muridae

Bioinformatics Examinations

Free to use internet based bioinformatic tools and softwares were utilized for examinations of the HMG-CoA reductase in Poaceae family and 3 different animal samples. The homology and analogy of protein arrangement of HMG-CoA reductase protein of Poaceae family with the effectively studied sequences of NCBI database was checked through BLASTp (NCBI), and multiple sequence alignment for related or similar HMG-CoA reductase protein sequences was done by Clustal omega utilizing CLUSTAL-W (with character counts)method with default setting. The protein sequences of HMG-CoA Reductases were analysed utilizing Multiple Em for Motif Elicitation tool (MEME; adaptation 5.1.1) for discovering the sequence specific motifs. (http://meme-suite.org/tools/meme). MEME analysis was done using default settings and the motifs to find was increased to 4 per protein sequence.

Figure 4: similarity/identity matrices of proteins equences in Poaceae familyand protein sequences of 3 animal samples Figure 4: similarity/identity matrices of proteins equences in Poaceae family and protein sequences of 3 animal samples (analysed in Fig3.) were analysed using MatGat software.

Click here to View figure

Phylogenetic tree was performed by Jalview programming from aligned sequences. The NeighborJoining (NJ) strategy and blossum62 were used for planning the evolutionary tree. SWISS-MODEL Homology Modelling Report (https://swissmodel.expasy.org/) (SMTL ID 1dq9.1) bioinformatics tool was used for the fully automated protein structure homology-modellingof Triticum aestivum HMG-CoA reductase protein (Accession: AAB29929.1). Rasmol software was used for 3D structure perception. Relative Spatial arrangement of atoms (stereochemistry) of 3D model was studied using PROCHECK tool, (http://www.ebi.ac.uk/thornton-srv/information bases/cgi-canister/pdbsum/GetPage.pl?pdbcode=index.html) which helped in making the Ramachandran plot.

Results and Discussion

Study of the multiple sequence alignment indicated that HMG-CoA Reductase protein in Poaceae family and different samples have high rate of homology with one another. Protein sequences of HMG-CoA Reductase in plant have4 conserved motifs (EMPVGYVQLPVGV; TTEGCLVA; DAMGMNM and GTVGGGT).

Multiple sequence alignment of Ninety Nine HMG-COA Reductase protein sequences belonging to Poaceae family and 3 samples including Drosophila mojavensis, Homo sapiens, Mus pahari (referenced in table 1) was done by Clustal Omega using CLUSTAL-W(with word counts) method. The samples under study demonstrated high homology in the protein sequences aligned by multiple sequence alignment. By study of the results of Fig. 3, 3rd and 4thmotif were found to beconservedmore than 1st and 2nd motifs of Poaceae family and 3 animal samples. Triticum aestivum (common wheat) of Poacea family and protein sequence of Homo sapiens showed 61.59 % identity, which was the highest homology in HMG-CoA Reductase protein sequences under study. (Fig 7). I further performed motif examinations of these sequences by Multiple EM for Motif Elicitationsoftware for identification of motif specific to the protein sequences of Poaceae and 3 animal samples (Figs. 5, 6). Triticum aestivum HMG-CoA Reductase protein(GenBank Accession Number: AAB29929.1) of Poaceae family was chosen to study the protein structure of HMG-CoA Reductase protein and thus was studied usingbioinformatics methods. Triticum aestivum HMG-CoA Reductase(length: 150 aa) has a molecular weight of 15. 76 kilodaltons and the quantity of its isoelectric point (pI) is 4. 90 was found out using https://web. Expasy. Org/cgi-bin/protparam/protparam. On the amino acid level, triticum aestivum HMG-CoA Reductase protein issimilar to numerous different HMG-CoA Reductase proteins presentin numerous plants under study.

Figure 5: MEME (Multiple EM for Motif Elicitation) for HMG-CoA proteins sequences under study- Motif 1: FIATGQDPAQNVESSQCITMLEAVNDGKDLHISVTMPSIEV;Motif 2: DAMGMNMVSKGVQNVLDYLQDDFPDMDVISISGMotif 3: NFCSDKKPAAVNWIEGRGKSVVCEAVIKEDVVKKVLKTNVQSLVELNVIK Motif 4: YVQLPVGIAGPLLLDGQRYYVPMATTEGCLVASTNRGCKAI Figure 5: MEME (Multiple EM for Motif Elicitation) for HMG-CoA proteins sequences under study- Motif 1: FIATGQDPAQNVESSQCITMLEAVNDGKDLHISVTMPSIEV;Motif 2: DAMGMNMVSKGVQNVLDYLQDDFPDMDVISISGMotif 3: NFCSDKKPAAVNWIEGRGKSVVCEAVIKEDVVKKVLKTNVQSLVELNVIK Motif 4: YVQLPVGIAGPLLLDGQRYYVPMATTEGCLVASTNRGCKAI

Click here to View figure

Figure 6: Motifs identified by MEME tool forHMG-CoA reductase proteins. Different-coloured rectangles represent the sequence specific MEME motifs. Figure 6: Motifs identified by MEME tool forHMG-CoA reductase proteins. Different-coloured rectangles represent the sequence specific MEME motifs.

Click here to View figure

 Figure 7: The highest percentsimilarity between HMG-CoA reductaseproteins sequence of Homo sapiens andTriticum aestivum. Figure 7: The highest percentsimilarity between HMG-CoA reductaseproteins sequence of Homo sapiens andTriticum aestivum.

Click here to View figure

Triticum aestivum HMG-CoA Reductase proteinwas examined using TMpred and TMHMM tool (Fig 8) (http://www.cbs.dtu.dk/administrations/TMHMM) and the results indicated presence of 3 transmembrane helices, of which 2 are inside to outside helices (one of them is between acid amine 95 to 113 and the second one is between amino acid 185 and amino acid 210), third one is outside to inside helices (between acid amine 185 to 211).

Figure 8: Transmembrane helices in Triticum aestivumHMG-COA REDUCTASE (Accession: AAB29929.1) were predicted using TMpred and TMHMM tools. Figure 8: Transmembrane helices in Triticum aestivumHMG-COA REDUCTASE (Accession: AAB29929.1) were predicted using TMpred and TMHMM tools.

Click here to View figure

SOPMA results indicate that extended strand had values lower than alpha helices and random coil in triticum aestivum HMG-CoA Reductase protein. PROCHECK tool was used to study the quality of stereochemistry of triticum aestivum HMG-CoA Reductaseprotein by generatingthe Ramachandran plot (Fig. 9), which suggested triticum aestivum HMG-CoA Reductaseprotein has good stereochemistry. SWISS-MODEL Homology Modelling Report tool was used (https://swissmodel.expasy.org/). (Fig 10)for prediction of 3D structure of triticum aestivum HMG-CoA Reductase protein.

Figure 9: Ramachandran plot of Triticum aestivum HMG-CoA Reductase protein(triticum aestivum HMG-CoA Reductase; AAB29929.1) (SMTL ID 1dq9.1). 7 different amino acid sequences are seen in the above given Ramchandran plot. Figure 9: Ramachandran plot of Triticum aestivum HMG-CoA Reductase protein(triticum aestivum HMG-CoA Reductase; AAB29929.1) (SMTL ID 1dq9.1). 7 different amino acid sequences are seen in the above given Ramchandran plot.

Click here to View figure

Figure 10: The 3D structure of Triticum aestivum HMG-CoA Reductase(Triticum aestivum HMG-CoA Reductase; AAB29929.1), established by homology-based modelling (SMTL ID 1dq9.1). SWISS-MODEL Homology Modelling Report tool was used for modelling of the 3D structure Figure 10: The 3D structure of Triticum aestivum HMG-CoA Reductase(Triticum aestivum HMG-CoA Reductase; AAB29929.1), established by homology-based modelling (SMTL ID 1dq9.1). SWISS-MODEL Homology Modelling  Report tool was used for modelling of the 3D structure

Click here to View figure

For prediction of the presence of signal peptides and the location of their cleavage sites in proteins sequence, Triticum aestivum HMG-CoA Reductaseprotein was further examined by SignalP tool (Fig 11)(http://www.cbs.dtu.dk/administrations/SignalP/) and the results predicted that there is 0.002 probability of presence of Sec signal peptide (Sec/SPI)signal peptide protein sequence.

Figure 11: Investigation of SignalPTriticum aestivum HMG-COA REDUCTASE protein Figure 11: Investigation of SignalPTriticum aestivum HMG-COA REDUCTASE protein.

Click here to View figure

SOPMA (Fig 12) examination ofTriticum aestivum HMG-CoA Reductasewas performed for studying thesecondary structure of HMG-CoA Reductase protein sequenceand the resultsstated that the peptide of triticum aestivum HMG-CoA Reductasehad 58 % of alpha helices, 5.33 % of beta turns, 12.67 % of extended strands, and 24 % of random coil.

Figure 12: SOPMA analysis for secondary structure of Triticum aestivum HMG-COA REDUCTASE protein. Figure 12: SOPMA analysis for secondary structure of Triticum aestivum HMG-COA REDUCTASE protein.

Click here to View figure

The consequence of atomic demonstrating indicated that triticum aestivum HMG-CoA Reductasehas a spatial engineering that is fundamentally the same as HMG-CoA Reductaseof human. For studying the evolutionary relationship, proteinsequences of HMG-CoA Reductases in Poaceae and various species under study were used and a phylogenetic tree was generated. The outcome demonstrated that HMG-CoA Reductases come from one precursor gene and formed into various branches. As indicated by the phylogenetic tree, HMG-CoA Reductases have relationship with one another (Fig. 13). The knowledge of bioinformatics is used to understand the nature of pathways associated with trepenoid synthesis.Methylerythritol Phosphate Pathway and Non-mevalonate pathway have been studied and the proteins associated with it are identified. The characterisation of proteins have helped in biological engineering of trepenoid synthesis pathways.

Figure 13: Evolutionary tree of HMG-CoA Reductases from Poaceae family and animals species under study was constructed using neighbour joining methodusing Jalview software. Figure 13: Evolutionary tree of HMG-CoA Reductases from Poaceae family and animals species under study was constructed using neighbour joining methodusing Jalview software.

Click here to View figure

Plant metabolism studies have revolutionised due to novel bioinformatics techniques. The new innovations, including designing the terpenoidbased defence products, making transgenic plants, modifying a pathway in microorganisms to deliver drugs. The better comprehension of the elements of genes in terpene synthesis could prompt finding novel pathways of terpenoidproduction or production of new terpenoidcompounds, which may lead to new entryway for future remedial products containing terpenoids. Examination demonstrated that HMG-CoA Reductaseprotein family has extremely conserved regions among plants and different organism. Thus this states that this protein sequence has played an important part in evolution. HMG-CoA Reductase protein sequences can be studied and genetic engineering of terpenoid pathways can open a door for industrial intervention employing terpenoids.

Acknowledgement

I would like to thank my Head of the Department (B.Sc. Biotechnology) Dr. (Mrs.) Aparna Deshmukh for giving me exposure to the field of bioinformatics and for generating interest for research. I would also like to thank Thakur College of Science and Commerce for always supporting me in such extra-curricular activities.

Funding Source

No funding was granted for this research.

Conflict of interest

There is no conflict of interest.

References

  1.  Abe I, Rohmer M, Prestwich GD (1993) Enzymatic cyclization of squalene and oxido squalene to sterols and triterpenes. Chem Rev 93:2189–2206
    CrossRef
  2. Bailey TL, Williams N, Misleh C, Li WW (2006) MEME: dis- covering and analyzing DNA and protein Sequence motifs. Nucleic Acids Res 34:369–373
    CrossRef
  3. Bick JA, Lange BM (2003) Metabolic cross talk between cyto- solic and plastidial pathways of isoprenoid biosynthesis: unidi- rectional transport of intermediates across the chloroplast envelope membrane. Arch Biochem Biophys 415:146–154
    CrossRef
  4. Caelles C, Ferrer A, Balcells L, Hegardt FG, Boronat A (1989) Isolation and structural characterization of a cDNA encoding Arabidopsis thaliana 3-hydroxy-3-methylglutaryl coenzyme A reductase. Plant Mol Biol 13:627–638
    CrossRef
  5. Chappell J, Wolf F, Proulx J, Cuellar R, Saunders C (1995) Is the reaction catalyzed by 3-hydroxy-3-methylglutaryl coenzyme A reductase a rate-limiting step for isoprenoid biosynthesis in plants? Plant Physiol 109:1337–1343
    CrossRef
  6. Chen XY, Xu ZH (1996) Recent progress in biotechnology and genetic engineering of medicinal plants in China. Med Chem Res 6:215–224
  7. Cieza A, Maier P, Poppel E (2003) The effect of Ginkgo Biloba on healthy elderly subjects. Fortschritte Der Medzin 1:10–15
  8. Croteau R, Kutchan TM, Lewis NG (2000) Natural products (secondary metabolites). In: Buchanan B, Gruissem W, Jones R (eds) Biochemistry and molecular biology of plants. Am Soc Plant Biologists, Rockville, MD, USA, Chapter 24, pp 1255–1318
  9. Eriksson ME, Israelsson M, Olsson O, Mortiz T (2000) Increased gibberellins biosynthesis in transgenic trees promotes growth, biomass production and xylem fiber length. Nat Biotechnol 18:784–788
    CrossRef
  10. Fits LVD, Memelink J (2000) ORCA3, a jasmonate-responsive transcriptional regulator of plant primary and secondary metab- olism. Science 289:295–297
    CrossRef
  11. Geourjon C,  Dele0age  G  (1995)  SOPMA:  significant  improve- ment in protein secondary structure prediction by consensus prediction from multiple alignments. CABIOS 11:681–684
    CrossRef
  12. Harker M, Holmberg N, Clayton JC, Gibbard CL, Wallace AD, Rawlins S, Hellyer SA, Lanot A, Safford R (2003) Enhancement of seed phytosterol levels by expression of an N-terminal trun- cated Hevea brasiliensis (rubber tree) 3-hydroxy- 3-methylglut- aryl-CoA reductase. Plant Biotechnol J 1:113–121
    CrossRef
  13. Hartmann T (1996) Diversity and variability of plant secondary metabolism: a mechanistic view. Entomol Gen Appl 80:177–188
    CrossRef
  14. Hey SJ, Powers SJ, Beale MH, Hawkins ND, Ward JL, Halford NG (2006) Enhanced seed phytosterol accumulation through expression of a modified HMG-CoA reductase. Plant Biotechnol J 4:219–229
    CrossRef
  15. Istvan ES, Deisenhofer J (2000) The structure of the catalytic portion of human HMG-CoA reductase. Biochem Biophys Acta 1529:9–18
    CrossRef
  16. Jomaa H, Wiesner J, Sanderbrand S, Altincicek B, Weidemeyer K, Hintz M, Turbachova I, Eberl M, Zeidler J, Lichtenthaler HK, Soldati D, Beck E (1999) Inhibitors of the nonmevalonate path- way of isoprenoid biosynthesis as antimaterial drugs. Science 285:1573–1576
    CrossRef
  17. Kahn RA, Durst F (2000) Function and evolution of plant cyto- chrome P450. Recent Adv Phytochem 34:151–189
    CrossRef
  18. Kushiro T, Ebizuka Y (2010) Triterpene. Compr Nat Prod II: Chem Biol 1:673–708
    CrossRef
  19. Lambert C, Leonard N, De Bolle X, Depiereux E (2002) ESy- Pred3D: prediction of proteins 3D structures. Bioinforma 18: 1250–1256
    CrossRef
  20. Lange BM, Croteau R (1999) Genetic engineering of essential oil production in mint. Curr Opin Plant Biol 2:139–144
    CrossRef
  21. Lange BM, Ketchum REB, Croteau R (2001) Isoprenoid bio- synthesis: metabolite profiling of Peppermint oil gland secretory cells and application to herbicide target analysis. Plant Physiol 127:305–314
    CrossRef
  22. Laskowski RA, MacArthur MW, Moss DS, Thornton JM (1993) PROCHECK: a program to check the stereochemical quality of protein structures. J Appl Crystallogr 26:283–291
    CrossRef
  23. Mann V, Harker M, Pecker I, Hirschberg J (2000) Metabolic engineering of astaxanthin production in tobacco flowers. Nat Biotechnol 18:888–892
    CrossRef
  24. Manzano D,  Ferna´ndez-Busquets  X,  Schaller  H,  Gonza´lez  V, Boronat  A,  Arro´  M,  Ferrer  A  (2004)  The  metabolic  imbalance underlying lesion formation in Arabidopsis thaliana over- expressing farnesyl diphosphate synthase (isoform 1S) leads to oxidative stress and is triggered by the developmental decline of endogenous HMG-COA REDUCTASE activity. Planta 219:982–989
    CrossRef
  25. Martin VJJ, Pitera DJ, Withers ST, Newman JD, Keasling JD (2003) Engineering a mevalonate pathway in Escherichia coli for production of terpenoids. Nat Biotech 21:796–802
    CrossRef
  26. Matthews PD, Wurtzel ET (2000) Metabolic engineering of carotenoid accumulation in Escherichia coli by modulation of the isoprenoid precursor pool with expression of deoxyxylulose phosphate synthase. Appl Microbiol Biotechnol 53:396–400
    CrossRef
  27. Mun˜oz-Bertomeu J, Sales E, Ros R, Arrillaga I, Segura J (2007) Up-regulation of an N-terminal truncated 3-hydroxy-3-methyl- glutaryl CoA reductase enhances production of essential oils and sterols in transgenic Lavandula latifolia. Plant Biotechnol J 5: 746–758
    CrossRef
  28. Ohyama K, Suzuki M, Kikuchi J, Saito K, Muranaka T (2009) Dual biosynthetic pathways to phytosterol via cycloartenol and lanosterol in Arabidopsis. Proc Natl Acad Sci USA 106:725–730
    CrossRef
  29. Romer S, Bramley PM, Fraser PD, Kiano JW, Shipton CA, Misawa N, Schuch W (2000) Elevation of the provitamin A content of transgenic tomato plants. Nat Biotechnol 18:666–669
    CrossRef
  30. Ruiz-Albert J, Cerda-Olmedo E, Corrochano LM (2001) Genes for mevalonate biosynthesis in phycomyces. Mol Genet Genomics 266:768–777
    CrossRef
  31. Schaller H, Grausem B, Benveniste P, Chye ML, Tan CT, Song YH, Chua NH (1995) Expression of the Hevea brasiliensis (HBK) Mu¨ll   Arg   3-hydroxy-3-methylglutaryl   coenzyme   A reductase 1 in tobacco results in sterol overproduction. Plant Physiol 109:761–770
    CrossRef
  32. Schmidt-Dannert C, Umeno D, Arnold FH (2000) Molecular breeding of carotenoid biosynthetic pathways. Nat Biotechnol 18:750–753
    CrossRef
  33. Soriente A, De Rosa M, Scettri A, Sodano G, Terenico MC, Paya´ M, Alcaraz MJ (1999) Manolide. Curr Med Chem 6:415–431
  34. Wani MC, Taylor HL, Wall ME, Coggon P, McPhail AT (1971) Plant antitumor agents. VI. The isolation and structure of taxol, a novel antileukemic and antitumor agent from Taxus brevifolia.   J Am Chem Soc 93:2325–2327
    CrossRef
  35. Xu R, Fazio GC, Matsuda SPT (2004) On the origins of triter- penoid skeletal diversity. Phytochemistry 65:261–291
    CrossRef
  36. Ye XD, Babili SA, Klo¨ti A, Zhang J, Lucca P, Beyer P, Potrykus I (2000) Engineering provitamin A (b-carotene) biosynthetic pathway into (caroteneoid free) rice endosperm. Science 287: 303–305
    CrossRef
  37. Darabi, M., Masoudi-Nejad, A. & Nemat-Zadeh, G. Bioinformatics study of the 3-hydroxy-3-methylglotaryl-coenzyme A reductase (HMG-COA REDUCTASE) gene in Gramineae. Mol Biol Rep 39, 8925–8935 (2012). https://doi.org/10.1007/s11033-012-1761-2
    CrossRef
  38. Waterhouse, A.M., Procter, J.B., Martin, D.M.A, Clamp, M., Barton, G.J (2009), “Jalview version 2: A Multiple Sequence Alignment and Analysis Workbench,” Bioinformatics 25 (9) 1189-1191 doi: 10.1093/bioinformatics/btp033
    CrossRef
  39. Brahmkshatriya P.P., Brahmkshatriya P.S. (2013) Terpenes: Chemistry, Biological Role, and Therapeutic Applications. In: Ramawat K., Mérillon JM. (eds) Natural Products. Springer, Berlin, Heidelberg. https://doi.org/10.1007/978-3-642-22144-6_120
    CrossRef
  40. Lange BM, Rujan T, Martin W, Croteau R. Isoprenoid biosynthesis: the evolution of two ancient and distinct pathways across genomes. Proc Natl Acad Sci U S A. 2000;97(24):13172-13177. doi:10.1073/pnas.240454797
    CrossRef


Production of Rhamnolipids by Pseudomonas aeruginosa AP029-GLVIIA and Application on Bioremediation and as a Fungicide

$
0
0

Introduction

Surfactants are an important class of chemical compounds synthesized in large part by petroleum derivatives (Gudiña et al., 2015a; Padilha et al., 2015) They are formed by hydrophobic and hydrophilic portions, which are distributed at the interface between liquid phases causing the decrease of surface and interfacial tensions ( Akbari et al., 2018; Ehinmitola et al., 2018; Gudiña et al., 2016; Grüninger et al., 2019; Mondal et al., 2015; Mondal et al., 2016, Mondal et al., 2017a). The surfactant production is expected to increase to 24 million tons and be worth approximately $ 120 million by 2020 (Jiang et al., 2020).

Currently, the studies about biosurfactants have been expanded due to the high environmental impact caused by some chemical surfactants. In addition to having similar properties to chemical surfactants, these amphiphilic bioproducts have advantages such as biodegradability, low toxicity and stability under extreme conditions of pH, temperature and salinity (França et al., 2015). Surfactants have potential to be applied in numerous products or fields, such as, detergents, paints, paper products, pharmaceuticals, cosmetics, petroleum, food, and water treatment (Costa et al., 2010; Mondal et al., 2017b).

Biosurfactants can be produced by different strains of microorganisms (bacteria, filamentous fungi and yeasts) using renewable raw materials with low cost as a substrate (Abdel-Mawgoud et al., 2010; Araújo et al., 2013). These molecules are classified into five major groups: lipopeptides, glycolipids, fatty acids, phospholipids and polymeric biosurfactants (Geetha et al., 2018).

Among the glycolipids there are the rhamnolipids, composed of rhamnose molecules and one or two units of β-hydroxydecanoic acid, which are present mainly in four isoforms (Mulligan, 2005). The production of these molecules occurs predominantly by Pseudomonas aeruginosa and the z is classified as mono and di-rhamnolipids according to the amount of rhamnose present in the structure. In addition, the proportion of these two forms can be influenced by nutritional and environmental conditions of microbial growth (Oluwaseun et al., 2017; Varjani and Upasani, 2017). Mono-rhamnolipids congeners show increase emulsification and antimicrobial properties in comparison to di-rhamnolipids (Sood et al., 2020). Other species of Pseudomonas have also been reported as producing rhamnolipids, such as P. chlororaphis, P. plantarii, P. putida and P. fluorescens (Randhawa and Rahman, 2014). The main characteristics of these biosurfactants are related to their ability to reduce the surface tension of water to between 28 and 30 mN/m, reduce interfacial tension between water and hydrocarbons, and have a critical micelle concentration (CMC) between 10 and 200 mg/L (França et al., 2015; Gudiña et al., 2015a).

Although can be applied in different areas, the production of biosurfactant on a large scale is not yet totally feasible, since the cost with the production and recovery of this product is relatively high (Souza et al., 2018). However, an alternative to reduce production costs would be the use of low-cost raw materials such as frying oils, sugarcane and beet molasses and cassava wastewater (Banat et al., 2014). But, even with some limitations it is estimated that in 2023 approximately 524 tons of biosurfactant will be traded, which will be responsible for a turnover of US$ 2.7 billion (Felipe and Dias, 2017).

In this context, the objective of this study was to evaluate the production of rhamnolipids by Pseudomonas aeruginosa AP029-GLVIIA by varying the carbon/nitrogen ratio (C/N), based on a simple and affordable source of carbon and energy (glucose), and the percentage of inoculum. Thus, the produced rhamnolipids were characterized in terms of CMC, emulsification index, bioremediation and antifungal activity against the species Candida albicans and Candida tropicalis.

Material and Methods

Chemical

The main chemicals used during this study were corn oil (Cargil Co. – SP, Brazil), D-glucose (Synth Co. – SP, Brazil), hexadecane (Sigma Co., USA), iron sulfate II heptahydrate (Synth Co. – SP, Brazil), kerosene (Líder Co. – RN, Brazil), magnesium sulfate heptahydrate (Synth Co. – SP, Brazil), monobasic potassium phosphate (Synth Co. – SP, Brazil), motor oil (Petronas Co.-MG, Brazil), peptone (BD Co. – SP, Brazil), sodium chloride (Cinética Co. – PR, Brazil), sodium nitrate (Cinética Co. – PR, Brazil), sodium phosphate dibasic heptahydrate (Synth Co. – SP, Brazil), soybean oil (Bunge Co. – SP, Brazil), and yeast extract (BD Co. – SP, Brazil) they were all of analytical grade.

Microorganism and Maintenance

Pseudomonas aeruginosa AP029-GLVIIA was isolated from an oil well in the city of Mossoró (Rio Grande do Norte, Brazil) and deposited in the culture collection of the Department of Antibiotics in the Federal University of Pernambuco (UFPE – Brazil). The microorganism was maintained in petri dish with PCA (Plate Count Agar) at 5 °C (Araújo et al., 2017).

Inoculum and Culture Medium

For inoculum the microorganism was transferred from the petri dish to 250 mL conical flasks containing 100 mL of medium consisting of 3.0 g/L yeast extract, 5.0 g/L sodium chloride and 5.0 g/L peptone at pH 7.0 then after 24 hours of cultivation at 38 °C and 200 rpm, aliquots were transferred to the production medium (Peng et al., 2012). The production medium (pH 6.5) consisted of a saline solution of MgSO4.7H2O (1.0 g/L), Na2HPO4.7H2O (1.1 g/L), KH2PO4 (1.5 g/L), NaNO3 (2.0 g/L), FeSO4.7H2O (0.1 g/L) and glucose. The influence of glucose on the production of rhamnolipids was evaluated by varying its concentration for 10.0, 18.0 and 26.0 g/L.

Five runs were performed in order to evaluate different culture conditions. The percentage of inoculum was 3.0, 10.0 and 17.0% (v/v) and the C/N ratio was 5, 9 and 13. All experiments were assayed in duplicate at 38 °C and 200 rpm for 72 hours using 100 mL of solution (production medium and inoculum) in 250 mL flasks. The pH of the crude broth was measured by potentiometer mPA 210 (Tecnopon, Brazil) and adjusted to 8.0. Then the medium containing the rhamnolipids was centrifuged (centrifuge 5804 R, Eppendorf, USA) at 1370 x g for 10 minutes and the supernatant obtained was used for further analysis.

Analytical Methods

Determination of Biomass

The biomass quantification was performed by the dry mass method as described by Bezerra et al. (2012). The crude broth was centrifuged (centrifuge 5415 D, Eppendorf, Germany) at 15700 x g for 15 minutes. Each point was measured in triplicate and the cell concentration (g/L) was estimated according to Equation 1:

Cbiomass = ((mass of the tube with biomass-Empty tube mass) / 2)  x 1000              (1)

Determination of Glucose

Glucose quantification was evaluated by the 3,5 dinitro-salicylic acid (DNS) method according to Miller (1959). The analyses were performed in triplicate.

Avaliation of Total Proteins

Measurement of total proteins was performed according to Bradford (1976). The assays were performed in duplicate.

Recovery and Quantification of the Rhamnolipids

The recovery of the rhamnolipids was performed first by acid precipitation of the supernatant I obtained from the centrifugation as commented in topic 2.2. The cell-free broth was acidified to pH 2.0 using HCl (6M) and stored at 4 °C overnight. The sample was then centrifuged at 1370 x g for 10 minutes. The supernatant from that centrifugation was discarded and 5 mL of distilled water and petroleum ether in the ratio of 1: 1 (v/v) were added to the precipitate. This procedure was repeated three times and at each repetition the emulsion formed by the ether and the rhamnolipids were removed and stored. Finally, the organic phase obtained from the last step was taken to the rotary evaporator V-850 (Büchi, Switzerland). Ten mL of distilled water was added to the obtained concentrate and stored (Peng et al., 2012). The quantification of the rhamnolipids was performed by the thioglycolic colorimetric method according to Oliveira et al. (2013).

Properties of the Biosurfactant

Critical Micellar Concentration (CMC)

Different dilutions of a 100 mg/L crude rhamnolipids mixture (1.65, 4.96, 6.20, 9.92, 24.82, 33.08, 49.63 and 100 mg/mL) were performed to determine the CMC. The surface tension for each defined concentration was measured using the Phoenix 150 SEO tensiometer and the CMC values were obtained in triplicate (Araújo et al., 2017).

Emulsification Index

The emulsification index was determined by the method of Cooper and Goldenberg (1987). In this case 2.0 mL of supernatant I was added to a tube containing 2.0 mL of the working solvent: hexadecane, toluene, kerosene, soybean oil, corn oil and motor oil. After 24 hours, the emulsification index (E) was measured according to Equation 2, described by Wei et al. (2005). These measurements were repeated every 15 days until completing 90 days and were performed in triplicate.

E (%) = (height of the emulsion/ total height)100                                                (2)

Assessment of Potential for Bioremediation

The evaluation for oil recovery was carried out using sand from a beach (Praia do Meio) of Natal (RN) – Brazil, containing 10% (w/w) of oil in Erlenmeyers of 250 mL. The mixture was allowed to stand for 24 hours and, subsequently, 40 mL of rhamnolipids (1.0 g/L) were added to each flask. Samples were incubated at 40 °C and 100 rpm for 24 h. Then the water/oil mixture was centrifuged at 5000 rpm for 25 minutes in order to quantify the mass of purified oil. The control assay was performed using distilled water under the same conditions and all experiments were performed in triplicate (Gudiña et al., 2015a; Pereira et al., 2013).

Evaluation of Antifungal Activity

The tests to evaluate the antifungal activity of the biosurfactant were carried out following the methodology described by the Clinical and Laboratory Standards Institute (CLSI) with modifications (Cockerill et al., 2012). The antifungal action of purified and unpurified rhamnolipids was evaluated against two yeast strains: Candida albicans ATCC 90028 and Candida tropicalis ATCC 13803. In a 96-well plate, 50.0 μL of the fungal suspension with 105 CFU/mL in Müeller Hinton broth (MH), supplemented with 0.2% glucose, were added to the rhamnolipids (7.425, 3.71, 1.85 , 0.93 and 0.46 μg/mL) and fluconazole (0.58 μg/mL) and then incubated at 35.0 ± 2.0 °C, under agitation of 200 rpm. The optical density at 595 nm was evaluated using a microplate reader (Epoch Biotek, Winooski) at zero time and after 24 hours.

Statistical Analysis

The analysis of the emulsification index and the antifungal activity were performed in triplicate and evaluated by the Tukey test using the software Statistica 7.0 (StatSoft Co, USA) and GraphPad Prism 5.0 (La Jolla California, USA).

Results and Discussion

Production of Rhamnolipids

Rhamnolipid production by Pseudomonas aeruginosa AP029-GLVIIA using glucose as substrate was evaluated by changing the C/N ratio and the percentage of inoculum added to the culture medium. In the five conditions studied, the concentrations of biomass, glucose, rhamnolipid and total proteins were analyzed, as well as pH variation.

According to Table 1, it can be seen that as the C/N ratio increased there was an increase in both biomass formation and rhamnolipid production. Indeed, it is known that these metabolites formation is favored under nitrogen limiting conditions Santos et al. (2002). The highest production of biosurfactant occurred for a ratio C/N of 13 with percentage of inoculum of 3.0%. It should be highlighted that Sousa et al. (2014) found a similar result producing rhamnolipids using glycerol as the carbon source. But, comparing the runs 2, 4 and 5, in which there was an increase in the amount of inoculum, it was observed that the product and the biomass had their values decreased and increased, respectively. The decrease in the amount of biosurfactant produced may be associated with the Quorum Sensing (QS) shown by Pseudomonas aeruginosa. The QS consists of a bacterial communication system capable of coordinating functions as motility and virulence agents, as well as controlling the levels of important compounds for biofilms formation, such as rhamnolipids, lectin A and siderophores (Kariminik et al., 2017). In general, the production of rhamnolipids was favored by using a higher C/N ratio and a lower percentage of inoculum.

During the cultivation, glucose consumption varied from 82.5 to 90.4%, then showing good assimilation of the substrate by the microorganism. In addition, the highest consumption occurred for the first 24 hours of each experiment. The values are of the same magnitude as shown by Bezerra et al. (2012); Sousa et al. (2014) that obtained substrate uptake of 91.9 and 50.8%, respectively, when used cassava wastewater and glycerol as substrate. Different carbon sources have been used for the production of rhamnolipids, for instance, Ramírez et al. (2015) investigated the olive-mill waste and Varjani and Upasani (2016) evaluated crude oil, nonane, decane, dodecane, N-paraffins, kerosene, diesel, xylene, glucose and glycerol, with glucose being the substrate that presented the highest yield in production of rhamnolipids. Additionally, Mondal et al. (2017) used different carbon sources and observed that glucose provided the best result for the biosurfactant synthesis.

According to Table 1, the concentration of total proteins increased in proportion to the increase in the amount of rhamnolipid, probably because these metabolites are capable of increasing the permeability of the cell membrane, and consequently, the concentration of proteins in the medium (Shao et al., 2017). However, the decrease in the protein concentration as shown in the runs 4 and 5 may be associated with the production of proteases but the rhamnolipids production was almost unchanged due to the QS (Bouyahya et al., 2017).

With regard to pH during cultivation it ranged from 5.88 to 8.20 when considering all runs performed, however for the maximum rhamnolipids concentration it ranged between 6.28 and 6.58. Similar results were shown by Varjani and Upasani (2017) that reported that rhamnolipids synthesis by Pseudomonas sp. is favored by pH between 6.0 and 6.5. In addition, the production of total proteins showed an interesting relationship with pH. It can be seen that as protein concentration increases there was an increase in the pH value, as shown in Figure 1, indicating metabolism for proteins formation with ammonium formation that affected pH by increasing it (Santos et al., 2002).

Table 1: Effect of C/N ratio and percentage of inoculum on rhamnolipid production, cell growth, pH and total protein production.

Run C/N Ratio Inoculum

(%)

Biomass

(g/L)

Time1

(h)

Rhamnolipid

(g/L)

Time2

(h)

pH3 Total proteins

(g/L)

1 5 3 1.33 0.02 12 0.30  0.00 4 6.52  0.03 0.149  0.01
2 9 3 1.57  0.06 24 0.78  0.01 60 6.28  0.05 0.248  0.01
3 13 3 2.50  0.04 24 0.84  0.06 24 6.44  0.05 0.426  0.00
4 9 10 2.03  0.20 12 0.39  0.03 12 6.58  0.03 0.233 0.00
5 9 17 1.93  0.14 10 0.40  0.01 48 6.46  0.00 0.123  0.00

1,2 Time at which maximum values of biomass and product were reached, respectively.

3pH corresponding to the highest concentration of rhamnolipids obtained in the assay.

Figure 1: Cell growth profile, substrate consumption, rhamnolipid production and pH as a function of time for run 3 (C/N of 13 and 3% inoculum). Figure 1: Cell growth profile, substrate consumption, rhamnolipid production and pH as a function of time for run 3 (C/N of 13 and 3% inoculum).

Click here to View Figure

Characterization of Biosurfactant

Critical Micellar Concentration (CMC)

In the present study the CMC of the unpurified (crude) rhamnolipids produced by P. aeruginosa AP029-GLVIIA was evaluated. The CMC determination was performed by measuring the surface tension of the cell free broth corresponding to the point of greatest rhamnolipid concentration (24 hours, run 3). The rhamnolipids produced were able to reduce the surface tension of water from 71.94 ± 1.07 to 29.42 ± 1.41 mN/m with a CMC of 49.63 mg/L. It is emphasized that the CMC depends on the pH, temperature, ionic strength and surfactant structure. But, as the rhamnolipids were synthesized in ionic medium, the influence of pH will be more significant when compared to the other mentioned parameters. An interesting fact concerns the variation in the value of CMC when considering the different isoforms adopted by rhamnolipids (Kłosowska-Chomiczewska et al., 2017). Samadi et al. (2012) observed that for a mixture of rhamnolipids (RLs), CMC was 22 mg/L and surface tension of 26 mN/m. However, when it was applied only mono-rhamnolipids (RL1), the CMC decreased to 15 mg/L while the tension reached 25 mN /m. Finally, for a mixture of di-rhamnolipids (RL2) the CMC reached 30 mg/L and tension of 29.5 mg/L. Gogoi et al., (2016) when studying rhamnolipid production obtained CMC values of 110 and 72 mg/L for crude and purified rhamnolipid, respectively. Regarding the surface tension, the purified rhamnolipid reached 29.5 mN/m. In contrast, Sodium Dodecyl Sulphate (SDS), a chemical surfactant widely used in industry, has CMC values of up to 2890 mg/L and surface tension of 37 mN/m. Thus, when comparing these values with those of the rhamnolipids, it can be seen that the the latter has higher efficiency, since the values obtained are smaller (Bognolo, 1999).

Emulsification index

The formation of the emulsion occurs when a liquid phase is dispersed in the form of droplets in a continuous liquid phase (Desai and Banat, 1997). Emulsification tests were performed with the cell-free supernatant (24 hours, run 3) and they were determined using six organic solvents: hexadecane, toluene, kerosene, soybean oil, corn oil and motor oil. In order to evaluate the stability of the emulsion formed, the indices were measured every 15 days until to complete 90 days.

Figure 2 shows the results of the emulsion formed in the first 24 hours: corn oil (57.47%), toluene (58.62%), soybean oil (59.32%), kerosene (62.07%), hexadecane (66.30%) and motor oil (77.55%). There were oscillations over time, but the emulsification index values remained above 50% for the hydrocarbons, except for the toluene which kept the emulsion for only 24 hours. In relation to the oils only the corn was unable to maintain the emulsion higher than 50% in the last 30 days. In all solvents the emulsion formed at the top of the system, indicating that the rhamnolipids are responsible for forming water-in-oil (W/O) emulsions (Nguyen and Sabatini, 2011)

Figure 2: Emulsification index determined at different times in oils (A) and hydrocarbons (B). Letters or set of equal letters did not present a statistically significant difference (p <0.05). Figure 2: Emulsification index determined at different times in oils (A) and hydrocarbons (B).

Click here to View Figure

Table 2 presents a comparison among the present study and of the emulsification indexes of some biosurfactants shown by reports on literature about the solvents herein assayed.

Table 2: Comparison of emulsification indexes of different biosurfactants

Microorganisms Carbon Sources Solvents Emulsification index References
Pseudomonas aeruginosa AP029/GLVIIA Glucose Hexadecane, toluene, kerosene, soybean oil, corn oil and motor oil 57.47 to 77.55% This study
Pseudomonas aeruginosa LBI Natural oils Kerosene and toluene 70 to 100% Costa et al. (2006)
Pseudomonas aeruginosa AP029/GLVIIA Cassava Kerosene 65% (Bezerra et al. (2012)
Pseudomonas aeruginosa #112 Corn steep liquor and molasse Hexadecane 60% Gudiña et al. (2016)
Pseudomonas

aeruginosa UCP0992

Corn steep liquor Soy, corn and motor oil 62.5 to 100% Rufino et al. (2016)
Pseudomonas aeruginosa NCIM 5514 Glucose Hidrophobic solvents 17.1 to 82.3% Varjani and Upasani (2016)
Bacillus subtilis ICA56 Glucose Motor oil 79% França et al. (2015)

Assessment of Potential for Bioremediation

In this study, a previous test for the recovery of contaminated sand oil was carried out. From the experiment it was possible to determine that the rhamnolipids were able to remove 16.8 ± 1.6% of the petroleum when compared to the control test (sand/ petroleum/distilled water). When studying different surfactins produced by species of Bacillus subtilis, Pereira et al. (2013) achieved oil removal results between 19.0 and 22.0% using a 1.0 g/L rhamnolipid solution. In similar work, Gudiña et al. (2015b) obtained values of 15.0, 26.3 and 25.1% when using 1.0, 2.5 and 5.0 g/L surfactin. On the other hand, Gudiña et al. (2015a) produced rhamnolipids and used them to removal of petroleum showing values of 22.1; 43.7 and 55.0% for the same concentrations of rhamnolipids presented in the present study. Recently, Das and Kumar (2019) demonstrated that biosurfactant was able to recover 46.5% of the crude oil present at a sand pack column.

Evaluation of Antifungal Activity

Analyses of antimicrobial activity were performed using purified and unpurified rhamnolipids, however, only the purified one was able to inhibit the growth of the microorganisms Candida albicans ATCC 90028 and Candida tropicalis ATCC 13803. Figure 3 shows the inhibition of fungi versus the concentrations of rhamnolipids (7.42, 3.71, 1.85, 0.93 and 0.46 μg/mL) and the applied control, fluconazole, (0.58 μg / mL). According to the results, the concentration of rhamnolipid showing higher antifungal activity was 7.42 μg/mL for the two yeasts assayed. In addition, to Candida tropicalis the biosurfactant concentration of 3.71 μg/mL did not show statistical difference when compared with the control (fluconazole) while for yeast Candida albicans all tested concentrations have similar action to fluconazole.

Figure 3: Evaluation of the antifungal activity of the purified rhamnolipid incubated against the fungi Candida albicans (Ca) and Candida tropicalis (Ct). Figure 3: Evaluation of the antifungal activity of the purified rhamnolipid incubated against the fungi Candida albicans (Ca) and Candida tropicalis (Ct).

Click here to View Figure

The present study demonstrates that the rhamnolipids produced by P. aeruginosa AP029-GLVIIA have potential to act as antifungal agents.

Abalos et al. (2001) used rhamnolipids to inhibit the growth of the following microorganisms: Aspergillus niger and Gliocadium virens (16 μg/mL), Chaetomium globosum, Penicillium chrysogenum and Aureobasidium pullulans (32 μg/mL), Botrytis cinerea and Rhizoctonia solani (18 μg/mL). The values presented in parentheses correspond to the Minimum Inhibitory Concentration (MIC).

In addition to antifungal activity, rhamnolipids also have a high potential to inhibit bacterial growth. Tedesco et al. (2016) applied biosurfactants against the bacteria Staphylococcus aureus and Burkholderia cepacia obtaining values MIC of 1.56 and 3.12 μg/mL. Oluwaseun et al. (2017) evaluated the antimicrobial activity of rhamnolipids, produced by Pseudomonas aeruginosa C1501, against various microorganisms (Staphylococcus aureus, Bacillus cereus, Escherichia coli, Saccharomyces cerevisiae, Aspergillus flavus and Aspergillus niger). The results showed that this bioproduct has the capacity to be used at industrial, food and biomedical applications. On the other hand, Ndlovu et al. (2017) studied the antibacterial and antifungal activity of biosurfactant extracts by Bacillus amyloliquefaciens and Pseudomonas aeruginosa against antibiotic resistant (Staphylococcus aureus, Escherichia coli) and fungal pathogens (Candida abicans, Cryptococcus neoformans). The biosurfactant presented antimicrobial action about all microorganisms analyzed.

Recently, Ferreira et al. (2019) investigated the antimicrobial activity of rhamnolipids against Gram-positive and Gram-negative food pathogens (Bacillus cereus, Listeria monocytogenes and Staphylococcus aureus) under different pH. The study suggests that the biosurfactant can be enhanced in acid food.

Conclusion

The Pseudomonas aeruginosa AP029-GLVIIA was able to produce rhamnolipids using glucose as the carbon source. The best condition for rhamnolipids production and biomass formation was using a C/N ratio and inoculum percentage of 13.0 and 3.0%, respectively. The rhamnolipids were able to form stable emulsions in different organic solvents, besides presenting satisfactory responses in relation to surface tension (29.42 ± 1.41 mN/m) and critical micellar concentration (49.63 mg/L). In addition, the tests of oil removal and antifungal activity showed that this kind of biosurfactant has potential for interesting biotechnological applications.

Acknowledgements

The authors thank CAPES and CNPq (Grant: 305251/2017-1) for the financial support for this work.

Compliance with Ethical Standards

Conflict of Interest

Authors declare there is no conflict of interest.

Funding Source

The authors thank CAPES and CNPq (Grant: 305251/2017-1) for the financial support for this work.

References

  1. Padilha C. E. A., Padilha C. A. A., Souza D. F. S. et al. Prediction of rhamnolipid breakthrough curves on activated carbon and Amberlite XAD-2 using Artificial Neural Network and Group Method Data Handling models . J. Mol. Liq. 2015; 206:293–299.
  2. Gudiña E. J., Rodrigues A. I., Alves E. et al. Bioconversion of agro-industrial by-products in rhamnolipids toward applications in enhanced oil recovery and bioremediation. Bioresour. Technol. 2015; 177:87–93.
  3. Gudiña E. J., Rodrigues A. I., Freitas V. et al. Valorization of agro-industrial wastes towards the production of rhamnolipids. Bioresour. Technol. 2016; 212:144–50.
  4. Jiang J., Zu Y., Li X. et al. Recent progress towards industrial rhamnolipids fermentation: process optimization and foam control. Bioresour. Technol. 2020; 298:1–10.
  5. França I. W. L., Lima A. P., Lemos J. A. M. et al. Production of a biosurfactant by Bacillus subtilis ICA56 aiming bioremediation of impacted soils. Catal. Today. 2015; 255:10–15.
  6. Akbari S., Abdurahman N. H., Yunus R. M., Fayaz F., Alara O. R. Biosurfactants—a new frontier for social and environmental safety: a mini review. Biotechnology Research and Innovation. 2018; 2: 81-90.
  7. Costa S. G. V. A. O., Nitschke M., Lépine F. et al. Structure, properties and applications of rhamnolipids produced by Pseudomonas aeruginosa L2-1 from cassava wastewater. Process Biochem. 2010; 45:1511–16.
  8. Abdel-Mawgoud A. M., Lépine F., Déziel E. Rhamnolipids: Diversity of structures, microbial origins and roles. Applied Microbiology and Biotechnology. 2010; 86:1323–36.
  9. Araújo L. V., Freire D. M. G., Nitschke M. Biossurfactantes: propriedades anticorrosivas, antibiofilmes e antimicrobianas. Quim. Nova. 2013; 3:848–58.
  10. Grüninger J., Delavault A., Ochsenreither K. Enzymatic glycolipid surfactant synthesis from renewables. Process Biochemistry. 2019; 87: 45-54.
  11. Geetha S. J., Banat I. M., Joshi S. J. Biosurfactants: Production and Potential applications in Microbial Enhanced Oil Recovery (MEOR). Biocatal. Agric. Biotechnol. 2018; 14:1–30.
  12. Mulligan C. N. Environmental applications for biosurfactants. Environ. Pollut. 2005; 133:183–98.
  13. Oluwaseun A. C., Kola O. J., Mishra P. et al. Characterization and optimization of a rhamnolipid from Pseudomonas aeruginosa C1501 with novel biosurfactant activities. Sustain. Chem. Pharm. 2017; 6:26–36.
  14. Varjani S. J., Upasani V. N. Critical review on biosurfactant analysis, purification and characterization using rhamnolipid as a model biosurfactant. Bioresour. Technol. 2017; 232:389–97.
  15. Sood U., Singh D. N., Hira P. et al. Rapid and solitary production of mono-rhamnolipid biosurfactant and biofilm inhibiting pyocyanin by a taxonomic outlier Pseudomonas aeruginosa strain CR1. J. Biotechnol. 2020; 307:98–106.
  16. Randhawa K. K. S., Rahman P. K. S. M. Rhamnolipid biosurfactants-past, present, and future scenario of global market. Front. Microbiol. 2014; 5:1–7.
  17. Souza K. S. T., Gudiña E. J., Schwan R. F. et al. Improvement of biosurfactant production by Wickerhamomyces anomalus CCMA 0358 and its potential application in bioremediation. J. Hazard. Mater. 2018; 346:152–58.
  18. Banat I. M., Satpute S. K., Cameotra S. S. et al. Cost effective technologies and renewable substrates for biosurfactants’ production. Front. Microbiol. 2014; 5:1–18.
  19. Felipe L. D. O., Dias S. D. C. Surfactantes sintéticos e biossurfactantes : vantagens e desvantagens. Química Nov. na Esc. 2017; 39:228–36.
  20. Araújo C. K. C., Campos A. O., Padilha C. E. A. et al. Enhancing enzymatic hydrolysis of coconut husk through Pseudomonas aeruginosa AP 029/GLVIIA rhamnolipid preparation. Bioresour. Technol. 2017; 237:20–26.
  21. Peng X., Yuan X. Z., Zeng G. M. et al. Extraction and purification of laccase by employing a novel rhamnolipid reversed micellar system. Process Biochem. 2012; 47:742–48.
  22. Bezerra M. S., Holanda V. C. D., Amorim J. A. et at. Produção de biotensoativo utilizando Pseudomonas aeruginosa (P.A.) e resíduo agroindustrial (manipueira) como substrato. Holos 2012; 1:14–27.
  23. Miller G. L. Use of Dinitrosalicylic Acid Reagent for Determination of Reducing Sugar. Anal. Chem. 1959; 31:426–28.
  24. Bradford M. M. A. Rapid and sensitive method for the quantitation of microgram quantities of protein utilizing the principle of protein-dye binding. Anal. Biochem. 1976; 72:248–54.
  25. Oliveira A. C. S. M., Bezerra M. S., Padilha C. E. A. et al. Recovery of Rhamnolipids Produced by Pseudomonas aeruginosa Using Acidic Precipitation, Extraction, and Adsorption on Activated Carbon. Sep. Sci. Technol. 2013; 48:2852–59.
  26. Cooper D. G., Goldenberg B. G. Surface-active agents from two Bacillus species. Appl. Environ. Microbiol. 1987; 53:224–29.
  27. Wei Y. H., Chou C. L., Chang J. S. Rhamnolipid production by indigenous Pseudomonas aeruginosa J4 originating from petrochemical wastewater. Biochem. Eng. J. 2005; 27:146–54.
  28. Pereira J. F. B., Gudiña E. J., Costa R. et al. Optimization and characterization of biosurfactant production by Bacillus subtilis isolates towards microbial enhanced oil recovery applications. Fuel 2013; 111:259–68.
  29. Cockerill F. R., Wikler M. A., Alder J. et al. (Clinical and Laboratory Standards Institute): Methods for Dilution Antimicrobial Susceptibility Tests for Bacteria That Grow Aerobically. Methods for Dilution Antimicrobial Susceptibility Tests for Bacteria That Grow Aerobically, 9th Wayne, Pennsylvania. 2012; pp 1–32.
  30. Ehinmitola E. O., Aransiola E. F., Adeagbo O.P. Comparative study of various carbon sources on rhamnolipid production. South African Journal of Chemical Engineering. 2018; 26: 42-48.
  31. Santos A. S., Sampaio A. P. W., Vasquez G. S. et al. Evaluation of different carbon and nitrogen sources in production of rhamnolipids by a strain of Pseudomonas aeruginosa. Appl. Biochem. Biotechnol. 2002; 98:1025–35.
  32. Sousa J. R., Correia J. A. C., Melo V. M. M. et al. Cinética e caracterização de ramnolipídeos produzidos por Pseudomonas aeruginosa MSIC02 utilizando glicerol como fonte de carbono. Quim. Nova 2014; 37:431–41.
  33. Kariminik A., Baseri-Salehi M., Kheirkhah B. Pseudomonas aeruginosa quorum sensing modulates immune responses: An updated review article. Immunol. Lett. 2017; 190:1–6.
  34. Ramírez I. M., Tsaousi K., Rudden M. et al. Rhamnolipid and surfactin production from olive oil mill waste as sole carbon source. Bioresour. Technol. 2015; 198:231–36.
  35. Varjani S. J., Upasani V. N. Carbon spectrum utilization by an indigenous strain of Pseudomonas aeruginosa NCIM 5514: Production, characterization and surface active properties of biosurfactant. Bioresour. Technol. 2016; 221:510–16.
  36. Mondal M. H., Sarkar A., Maiti T. K. et al. Microbial assisted (Pseudomonas sp.) production of novel bio-surfactant rhamnolipids and its characterisation by different spectral studies. J. Mol. Liq. 2017; 242:873–78.
  37. Shao B., Liu Z., Zhong H. et al. Effects of rhamnolipids on microorganism characteristics and applications in composting: A review. Microbiol. Res. 2017; 200:33–44.
  38. Bouyahya A., Dakka N., Et-Touys A. et al. Medicinal plant products targeting quorum sensing for combating bacterial infections. Asian Pac. J. Trop. Med. 2017; 10:729–43.
  39. Kłosowska-Chomiczewska I. E., Mędrzycka K., Hallmann E. et al. Rhamnolipid CMC prediction. Journal of Colloid and Interface Science. 2017; 488:10–19.
  40. Samadi N., Abadian N., Ahmadkhaniha R. et al. Structural characterization and surface activities of biogenic rhamnolipid surfactants from Pseudomonas aeruginosa isolate MN1 and synergistic effects against methicillin-resistant Staphylococcus aureus. Folia Microbiol. (Praha). 2012; 57:501–08.
  41. Gogoi D., Bhagowati P., Gogoi P. et al. Structural and physico-chemical characterization of a dirhamnolipid biosurfactant purified from Pseudomonas aeruginosa: application of crude biosurfactant in enhanced oil recovery. RSC Adv. 2016; 6:70669–81.
  42. Bognolo G. Biosurfactants as emulsifying agents for hydrocarbons. Colloids Surfaces A Physicochem. Eng. Asp. 1999; 152:41–52.
  43. Desai J. D., Banat I. M. Microbial production of surfactants and their commercial potential. Microbiol Mol Biol Rev. 1997; 38:47-64.
  44. Nguyen T. T., Sabatini D. A. Characterization and emulsification properties of rhamnolipid and sophorolipid biosurfactants and their applications. Int. J. Mol. Sci. 2011; 12:1232–44.
  45. Costa S. G. V. A. O., Nitschke M., Haddad R. et al. Production of Pseudomonas aeruginosa LBI rhamnolipids following growth on Brazilian native oils. Process Biochem. 2006; 41:483–88.
  46. Rufino R. D., Neves G., Luna J. M. et al. Conservation of the Biosurfactant Produced by Pseudomonas aeruginosa for Environmental Applications. Chem. Eng. Trans. 2016; 49:535–40.
  47. Gudiña E. J., Fernandes E. C., Rodrigues A. I. et al. Biosurfactant production by Bacillus subtilis using corn steep liquor as culture medium. Front. Microbiol. 2015b; 6:1–7.
  48. Das A. J., Kumar R. Production of biosurfactant from agro-industrial waste by Bacillus safensis J2 and exploring its oil recovery efficiency and role in restoration of diesel contaminated soil. Environ. Technol. Innov. 2019; 16:1–10.
  49. Abalos A., Pinazo A., Infante M.R. et al. Physicochemical and antimicrobial properties of new rhamnolipids produced by Pseudomonas aeruginosa AT10 from soybean oil refinery wastes. Langmuir. 2001; 17:1367–71.
  50. Tedesco P., Maida I., Esposito F. P. et al. Antimicrobial activity of monoramnholipids produced by bacterial strains isolated from the Ross Sea (Antarctica). Mar. Drugs. 2016; 14:1–14.
  51. Ndlovu T., Rautenbach M., Vosloo J. A. et al. Characterisation and antimicrobial activity of biosurfactant extracts produced by Bacillus amyloliquefaciens and Pseudomonas aeruginosa isolated from a wastewater treatment plant. AMB Express. 2017; 7:1–19.
  52. Ferreira J. F., Vieira E.A., Nitschke M. The antibacterial activity of rhamnolipid biosurfactant is pH dependent. Food Research International. 2019; 116: 737-744.
  53. Mondal M. H., Malik S., Roy A. et al. Modernization of surfactant chemistry in the age of gemini and nio-surfactants – a review. RSC Advances. 2015; 5(112): 92707-92718.
  54. Mondal M. H., Roy A., Malik S., et al. Review on chemical bonded geminis with cationic heads: second generation interfactants. Res. Chem. Intermed. 2016; 42(3): 1913-1928.
  55. Mondal M. H., Sakar A., Maitini T. K. et al. Microbial assisted (pseudomonas sp.) production of novel bio-surfactant rhamnolipids and its characterisation by different spectral studies. J. Mol. Liq. 2017a; 242: 873-878.
  56. Mondal M. H., Malik S., Garain A., et al. Extraction of natural surfactant saponin from soapnut (Sapindus mukorossi) ans its utilization in the remediation of hexavalent chromium from contaminated water. Tenside Surfact. Det. 2017b; 54(6): 519-529.

Molecular Characterization of Thirteen Oil seed Brassica L. Variants From Bangladesh Through Polyacrylamide Gel Electrophoresis (PAGE)

$
0
0

Introduction

The Brassicaceae (Cruciferae) family is consisting of 338 genera and about 3709 species1. Among these genera, economically Brassica L. is the most important genus with 37 different species2. The genus – Brassica composed of six interlinked species with great morphological and genetic diversity of which three diploid species- Brassica rapa (A genome), B. nigra (B genome), and B. oleracea (C genome) of the genus Brassica were considered to be responsible for the origin of three amphidiploid species, B. carinata (n = 17, BC genome), B. juncea (n = 18, AB genome) and B. napus (n = 19, AC genome) 3. Brassica L. seems to have derived near the Himalayan region with a large number of important vegetables to oilseed and condiment crops; a great source of bioactive compounds, minerals, phytochemical contents, vitamins and fibers4.

Generally, the genus Brassica L. has been classified into three groups particularly –rapeseed, mustard and cole. The mustard groups include species like B. juncea, B. nigra and B. carinata; whereas the rapeseed groups include B. rapa and B. napus5. Commercial production of Brassica has grown progressively as a vital source of oil and plant originated protein for human and animal nutrition. Currently, Rapeseed categorizes as the third source of vegetable oil (after soy and palm) and for oil meal it ranks as the third notable source (after soy and cotton)6. Brassica L. generates Indole-3-carbinol that plays significant role to reduce the growth of human breast cancer cells and the occurrence of tumors in reproductive organs7-8.

Moreover, Brassica L. are not only a quality sources of potassium, dietary fiber, phenolics, vitamins A, C and E but also use as a renewable resource or biofuel in the petro-chemical industry9. Higher protein solubility is found in seeds of B. napus than B. rapa seeds. As a rich source of edible protein, B. rapa, B. juncea, B. carinata, and B. nigra have commercial values in food industry. In oil-extraction process, rapeseed and canola meal remain as by-product which contain up to 42.7% to 50% protein10.

Evaluation with molecular marker facilitates in determining parental forms for mapping of population, marker assisted alternatives, line drawings of back crosses and consequently various molecular markers are applied to execute different studies which offer assistance the breeders to improve crop species11. Now-a-days storage proteins are widely used as biochemical markers to find genetic structure, genetic diversity and relationships within plant species. According to O’Farrell (1975)12, polyacrylamide gel electrophoresis (PAGE) has been a well-accepted proteomic analytic method since its initiate to access protein banding patterns among different plant varieties. Hence electrophoresis of protein is considered as a method for characterization and evaluation of germplasm as well as increase the utilization of various plant genetic resources13.

Nowadays, storage protein is one of the most significant implements to appraise genetic assortment among wild and cultivated plant species. Reviewing a number of earlier works of Turi et al. (2010)13, Mukhlesur and Hirata (2004)14, Sadia et al. (2009)15, Zada et al. (2013)16, Ibrahim et al. (2017)17 and so on, it has been revealed that they conveyed abundant efforts to find out genetic diversity and relationship among various species of Brassica for improvement of crop through SDS-PAGE.

Consequently the present investigation is conducted based on leaf storage protein of thirteen different BARI (Bangladesh Agriculture Research Institution) variants of Brassica from Bangladesh by utilizing PAGE technique to evaluate accurate protein profile for discerning variants, extent of genetic divergence and relationship among the thirteen inquired variants of Brassica as well as selection of parental line for further breeding program and crop improvement.

Materials and Methods

Plant Materials

Thirteen variants of the genus Brassica have been chosen for the current study reflecting a wide array of variation for diverse physio-morphological attributes (Table 1). To conduct the present investigation, all the thirteen variants of Brassica were collected from Oilseeds Research Center (ORC) of Bangladesh Agricultural Research Institute (BARI), Gazipur, Bangladesh and maintained in the Botanical garden of Jagannath University, Dhaka, Bangladesh. Analyses of leaf protein profile of the supplied variants were performed in the laboratory of Department of Botany, Jagannath University, Dhaka, Bangladesh

Table 1: Some physio-morphological and agronomic traits of 13 Brassica L. variants used in the study

Species


Name of variants Days to maturity Silique chamber Seed color Agronomic traits
B. juncea Daulot (RS-81) 90-105 2 chambered Reddish brown Comparatively long duration, low yielding variety. Tolerant to alternaria blight disease and environmental stresses like – drought and slightly tolerant to salinity.
B. juncea BARI Sarisha-2 (Rai-5) 90-100 2 chambered Reddish brown Long duration, low yielding variety. Tolerant to drought, slightly tolerant to salinity.
B. juncea BARI Sarisha-10 (BS-10) 90-100 2 chambered Reddish brown Long duration, high yielding variety. Tolerant to drought, slightly tolerant to salinity.
B. juncea BARI Sarisha-11 (BS-11) 105-110 2 chambered Reddish brown Long duration, high yielding variety. Tolerant to drought and salinity.
B. napus BARI Sarisha-7 (Napus – 3142) 90-95 2 chambered Black Long duration, high yielding variety, tolerant to alternaria blight disease and interim water logged condition.
B. rapa BARI Sarisha-1 (Tori-7) 70-80 2 chambered Black Short duration, low yielding variety. Susceptible to pest and diseases.
B. rapa Kollaynia (TS-72) 85-90 2 chambered Blackish brown Short duration, low yielding variety. Susceptible to pest and environmental stresses.
B. rapa Sonali Sarisha (SS-75) 90-100 4 chambered Golden yellow Long duration, high yielding variety. Susceptible to alternaria blight disease.
B. rapa BARI Sarisha-6 (Dholi) 90-100 2 chambered Yellow Long duration, high yielding variety.  Susceptible to environmental stresses.
B. rapa BARI Sarisha-9 (BS-9) 80-85 2 chambered Reddish brown Short duration, high yielding variety.
B. rapa BARI Sarisha-12 (BS-12) 85-90 2 chambered Reddish brown Short duration, high yielding variety.
B. rapa BARI Sarisha-14 (BS-14) 75-80 2 chambered Yellow Short duration, high yielding variety.
B. rapa BARI Sarisha-15 (BS-15) 80-85 2 chambered Yellow Short duration, high yielding variety.

Methods

Protein Isolation and Sample Preparation

Fresh and young leaves of one-month old seedlings of investigated thirteen variants of Brassica were collected to isolate the crude protein. Based on the methodology of Akbar et al. (2020)11 the collected leaves of Brassica variants were gently washed with distilled water and then with ethanol to clean the microspores and other dirt from the leaves surface and then kept on flitter papers for a while to soak up the excessive amount of distilled water and ethanol from the leaves. Afterwards, 1 gm fresh leaf of each sample was grinded in icy motor-pestle and later the crude homogenates were centrifuged at 4 ºC with 13000 rpm for 15 minutes. After centrifugation, the crude protein remained as clear supernatant and stored in refrigerator at -20 ºC as sample (isolated protein) for vertical polyacrylamide gel electrophoresis.

Estimation of Protein

According to Lowry et al. (1951)18, with little modification, the protein concentration of investigated each Brassica L. sample was estimated using 665 nm wavelength via spectrophotometer (AUXILAB S. L. UV-VIS Spectrophotometer).

Electrophoresis

Polyacrylamide gel electrophoresis of each inquired sample was conducted by following the strait of Akbar et al. (2020)11. The entire process of electrophoresis was performed by using omniPAGE mini vertical gel electrophoresis unit. The isolated protein sample was directly resolved with 10.0% polyacrylamide as separating gel and 4.0% as stacking gel during electrophoresis. Then, 25 μl of each sample protein was loaded with 2X diluted Bromo Phenol Blue (BPB) loading dye (20 μl) into the well of stacking gel. To run the electrophoresis, Cleaver nano PAC – 300 constant power supply unit was employed and voltage was fixed at 90 V and current was set up at 120 amp. The protein sample with BPB loading dye was mobilized in 10X diluted running buffer solution (Tris-glycine buffer, pH 8.3) until the dye front line arrived on 2mm above to the end of the gel. Afterwards, the gel was stained by 0.25% Coomassie Brilliant Blue (CBB) R-250 for 25 minutes and distained in acetic acid – methanol – distilled water (1: 4: 5 volume ratios) until the clear bands appeared on the gel. Lastly, the distained gel was gently washed with distilled water and the photographs of the gel were taken by a DSLR (18 mega pixels Canon EOS 700D model).

Data Analysis

Evaluations of the gels were done with bare eyes on a light box. The relative mobility (Rf values) of protein subunits were calculated by measuring the migration distance from the top of the separating gel to each band and to the dye front. For each band on the gel, the Rf value was calculated using the following equation:

Rf = migration distance of the protein / migration distance of the dye front

Adduction of the discernible molecular weight of individual protein subunits was carried out using molecular weight marker proteins. Phosphorylase B, 97.2 KD; Bovine serum albumin, 66.4 KD; Ovalbumin, 44.3 KD; Carbonic anhydrase, 29.0 KD; Trypsin inhibitor, 20.1 KDa and Lysozyme, 14.3 KDa  (Protein Molecular Weight Marker; Takara Bio USA) applied on the gel as marker protein. A standard curve of the log molecular weight (MW) on X axis versus relative mobility (Rf) of marker protein on Y axis was generated using computer based program Microsoft Excel. Molecular weight of individual unknown protein subunit from PAGE was determined by utilizing the equation:

y = mx + c, where y denotes for the molecular weight of unknown protein subunit.

The photographs of the gel were acutely reviewed on the basis of the presence (1) and absence (0) of protein bands. All the major and minor bands that apparent to eyes were considered in our current analysis and scoring of all the monomorphic and polymorphic bands was recorded. The scores acquired from PAGE analysis were then pooled for creating a single data matrix. Thereafter, the data was used to estimate proportion of polymorphic loci, Nei’s (1973)19 gene diversity (h), Shannon’s Information index (Lewontin, 1972)20 and Nei’s (1972)21 genetic distance (D) employing a computer program, POPGENE (version 1.32) (Yeh et al., 1999)22. Based on genetic distance between all pairs of individual variants, a dendrogram was prepared applying Unweighted Pair Group Method with Arithmetic averages (UPGMA).

Results and Discussion

Proteins are thought about to be the forthright outcome of genes and might be used as a marker of these genes. As such protein is performed as an extra implies for characterizing systematic denomination. Hence an ample electrophoretic protein banding profile was conducted after the extraction and separation of stored leaf protein from the studied thirteen variants of Brassica L. through PAGE technique and represented in Fig. 1.

Vol17No4_Mol_Far_fig1 Figure 1: Banding pattern of leaf storage protein of thirteen variants of Brassica through PAGE, (A) stained with Coomassie Brilliant Blue (CBB; R-250) and (B) diagrammatic representation of protein bands on polyacrylamide gel. Lane M- Molecular weight protein marker, KDa- Kilo Dalton

Click here to View figure

(arrows indicate different loci produced during polyacrylamide gel electrophoresis).

The electrophoretic protein banding patterns of the thirteen studied variants of Brassica were detected which conveyed to the marking off a total of nineteen polypeptide bands. Of the nineteen polypeptide bands were found to be present at nineteen different loci designated as a – s with molecular weight ranging from 16.36 to 97.20 KDa (Table 2 and Figs. 1A–B). A close inquisition of the bands displayed that the different variants had slight differences in their protein banding patterns with respect to the presence and absence and staining intensities of the bands. Moreover, in the current study- the entire protein banding pattern of the investigated variants were vindicated into 3 different regions (I to III) based upon the manner of increasing Rf values and decreasing molecular weight of proteins (Table 2).

Table 2: Region, location, molecular weight, relative mobility, type of unique band and intensity values of different protein bands present in 13 Brassica L. variants

Region Locus Molecular weight (KDa) Rf  value Unique band types Variants
Daulot Rai-5 BS-10 BS-11 BS-7 Tori-7 TS-72 SS-75 BS-6 BS-9 BS-12 BS-14 BS-15
I a 97.20 0.028 ++ ++ ++ ++ ++ ++ ++ ++ ++ ++ ++
b 83.76 0.039 ++ ++ ++ ++
c 74.65 0.054 Negative ++++ ++++ ++++ ++++ ++++ ++++ ++++ ++++ ++++ ++++ ++++ ++++
d 72.95 0.081 Positive ++
e 69.89 0.148 ++ ++ +++ +++ ++ ++ ++ ++ ++ ++
f 55.72 0.173 ++ ++ ++ ++ ++ ++ ++ ++ ++
II g 52.76 0.192 Positive ++
h 50.34 0.208 ++++ ++++ ++++ ++++ ++ ++
i 49.25 0.215 ++ ++ ++ ++++ ++++ ++++ ++++ ++++ ++++ ++++ ++++
j 45.20 0.244 ++ ++ ++ ++ ++ ++
k 44.30 0.262 ++++ ++ ++ +++ +++ ++++
l 43.54 0.275 +++ +++ ++
m 42.16 0.295 ++++ ++++ ++++ ++++ ++++ +++ +++ +++ +++ +++ +++ +++ +++
n 40.20 0.325 ++++ ++++ +++ +++ +++ +++ +++ +++ +++
o 38.46 0.353 +++ +++ +++ +++ +++ +++ +++
III p 30.45 0.501 + + + + + +
q 27.89 0.546 + + + + + +
r 17.35 0.817 + + + + + + +
s 16.36 0.854 + + + + + + + + + + + + +

Keys:  + : very low intensity, ++ : low intensity, +++ : medium intensity, ++++ : high intensity, – : absence of band

As a consequence, region – I was found to consist of six bands having a range of molecular weight 97.20–55.72 KDa with Rf value ranging from 0.028–0.173. The six protein bands of region – I was characterized with bands of mostly low intensity at loci – a, b, d and f, whereas in locus – e, moderate and low level intensity protein bands were found, protein bands of high intensity in all the variants were observed at locus – c, except in Rai-5 (negative unique band). The only low intensity protein band with molecular weight and Rf value of 72.95 KDa and 0.081 respectively, was detected from BS-10 at locus – d, which can be considered as a unique band (positive unique band) and may be used as an implement for particular varietal characterization of Brassica L. (Table 2 and Figs. 1A–B). All the bands in region – I was found polymorphic. Region – II was observed with nine protein bands having molecular weight and Rf value ranging from 52.76–38.46 KDa and 0.192–0.353, respectively. The protein bands revealed in this region were pre-eminently discerned with medium to high intensity of proteins at loci – m, n and o whose Rf value lie between 0.295–0.353. Two bands with low and high intensities of protein were present at loci – h and i. A single band with all low intensities of protein (at locus – j) and low and moderate intensities of protein were appeared at locus – l. At locus – g, a single band of low intensity protein with Rf value of 0.192 and molecular weight 52.76 KDa was apparent in Daulot whereas no bands of protein was observed in rest of the twelve variants of Brassica at this locus, which made the band to be envisaged as an unique band (positive unique band) and assist in distinguishing the variant – Daulot from the other examined variants of Brassica (Table 2 and Figs. 1A–B). The region – III was characterized with very low intensities of protein bands found to be present at loci – p to s with molecular weight and Rf values ranging from 30.45–16.36 KDa and 0.501–0.854 (Table 2 and Figs. 1A–B). By taking into account the intensity of protein bands in different loci of the entire electrophoretic profile, it was observed that the region – II was more diverse with an average of 3 bands as compared to region – I and III, where the average numbers of bands were 2 and 1.33, respectively.

The change-over in the staining intensity and number of the polypeptide bands might be by virtue of differential extraction or disparity in solubility of protein or inadequacy of separation of varied sorts of proteins having identical migration rates23. They also suggested that the qualities of bands (i.e., the difference in the number, position and intensity of bands) in varieties even in accessions of the same species are governance through the quantitative gene system. Observations based on intensity of protein bands from different varieties of Brassica species were reported by many investigators13, 15, 24-25. Likewise, delineations on divergent plant species regarding to the intensities of protein bands were debriefed by Odeigah et al. (1999)26 in Nigerian varieties of pepper, Devi (2000)27 in sunflower, Varma et al. (2005)28 in maize genotypes, Vijayan (2005)29 in rice, Paul and Datta (2006)30 in celery and ajowan, Nisha (2007)31 in wheat, Sumathi (2007)32 in oats, Abdulrahaman et al. (2015)33 in lady’s finger and Begum and Alam (2019)34 in chick-pea.

Divergence within the loci concerning the position, staining intensity and values of molecular weight were observed in the electrophorogram (Table 2 and Figs. 1A–B). Two bands with molecular weight 55.72 and 49.25 KDa (one low and another one was high in intensity) were obtained at loci – f and i, respectively which were found to be present in all the inquired variants of B. rapa (Tori-7, TS-72, SS-75, BS-6, BS-9, BS-12, BS-14 and BS-15) whereas two consecutive bands of very low intensity with molecular weight of 30.45 and 27.89 KDa at loci – p and q were spotted out from the variants of B. juncea and B. napus (Daulot, Rai-5, BS-10, BS-11 and BS-7). The presence of bands with particular molecular weight at definite locus within particular species made us to imply that the species B. rapa exhibited species specific bands at loci f and i of molecular weight 55.72 and 49.25 KDa. Concurrently, B. juncea and B. napus displayed species specificity for molecular weight 30.45 and 27.89 KDa at p and q loci, discretely. Thereupon, in the light of diversity regarding to the position, intensity and values of molecular weight for each of the locus can be aided as feasible tool for proper distinguishing of species within the observed variants of Brassica by the electrophoresis of the total soluble protein from leaves.

In our present inquest, scrutiny of soluble protein banding pattern from leaves of thirteen tested variants of Brassica L. by PAGE technique presented three distinct different profiles and could be an excellent genre of biochemical fingerprint for discerning different variants of Brassica. The presence of a negative (-ve) unique band at locus- c in Rai-5 and a positive(+ve) unique band in each of the variety of BS-10 and Daulot at locus – d and g singly, could be esteemed as fingerprints for discerning these respective variants

Inter varietal locus variation can be deemed of to be a mainspring for estimation of different degree of genetic divergence within diverse species, where non – appearances of a few protein polypeptides in few variants express variation and consequently taken into considered as polymorphic loci. Throughout the course of the prevailing look at, inter varietal variation of loci among the thirteen variants of Brassica L. were also disclosed and presented in Table 3. Out of add up to nineteen loci; the loci – m and s are vitally monomorphic because of the prevalence of 100% protein bands. The remaining loci of the entire electrophorogram exhibited variation within themselves. The highest amount of variation was observed from loci – d and g with 92.31% of variability and 0.08 genetic disagreement, whereas the lowest amount of divergence was noticed from locus – c with 7.69% variability that existing with a high value of genetic disagreement (0.92) (Table 3).

Table 3: Inter varietal locus variation among the 13 variants of Brassica L.

Locus Present (%) Absent (%) Variation (%) Status Genetic disagreement
Locus a 11 (84.62%) 2 (15.38%) 15.38% Polymorphic 0.85
Locus b 4 (30.77%) 9 (69.23%) 69.23% Polymorphic 0.31
Locus c 12 (92.31%) 1 (7.69%) 7.69% Polymorphic 0.92
Locus d 1 (7.69%) 12 (92.31%) 92.31% Polymorphic 0.08
Locus e 10 (76.92%) 3 (23.08%) 23.08% Polymorphic 0.77
Locus f 9 (69.23%) 4 (30.77%) 30.77% Polymorphic 0.69
Locus g 1 (7.69%) 12 (92.31%) 92.31% Polymorphic 0.08
Locus h 6 (46.15%) 7 (53.85%) 53.85% Polymorphic 0.46
Locus i 11 (84.62%) 2 (15.38%) 15.38% Polymorphic 0.85
Locus j 6 (46.15%) 7 (53.85%) 53.85% Polymorphic 0.46
Locus k 8 (61.54%) 5 (38.46%) 38.46% Polymorphic 0.62
Locus l 4 (30.77%) 9 (69.23%) 69.23% Polymorphic 0.31
Locus m 13 (100.00%) 0 (0.00%) 00.00% Monomorphic 1.00
Locus n 9 (69.23%) 4 (30.77%) 30.77% Polymorphic 0.69
Locus o 7 (53.85%) 6 (46.15%) 46.15% Polymorphic 0.54
Locus p 5 (38.46%) 8 (61.54%) 61.54% Polymorphic 0.38
Locus q 5 (38.46%) 8 (61.54%) 61.54% Polymorphic 0.38
Locus r 7 (53.85%) 6 (46.15%) 46.15% Polymorphic 0.54
Locus s 13 (100.00%) 0 (0.00%) 00.00% Monomorphic 1.00
Total Polymorphism                                            89.47%

Besides, the showing up of different level of variableness in the loci of the studied variants  like 15.38% (at loci – a and i), 23.08% (at locus – e), 30.77% (at loci – f and n), 38.46% (at locus – k), 46.15% (at loci – o and r), 53.85% (at loci – h and j), 61.54% (at loci – p and q) and 69.23% (at loci – b and l) along with respective genetic disagreement of 0.85, 0.77, 0.69, 0.62, 0.54, 0.46, 0.38 and 0.31 made it pondered to have worth mentionable genetic diversity among the quested varieties of Brassica L.

The proficiency of molecular marker approaches rely on the level of polymorphism within a group of variants inquired. During the study of PAGE, a complete of nineteen bands of polypeptide were amplified of that seventeen (89.47%) were found to be polymorphic and the remaining two bands (10.53%) were monomorphic in nature (Fig. 2A). An average of 44.13% of polymorphism was observed from the tested variants of Brassica L. (Table 4). As a consequence of presence of high amount of polymorphism among the variants expressed by the proportion of polymorphic loci (89.47%), it can be suggested that a broad genetic variation may be present among the studied variants of Brassica L. From the verdict of current study, the highest amount of polymorphism was documented from BS-10, which was 57.89%. Contrastingly, BS-14 was offered with 31.58% of polymorphism which was found as the lowest value of polymorphism among the examined variants of Brassica L. The studied variants of Brassica L. exhibited different degree of polymorphism that was displayed in the Table 4 and Fig. 2B. Of the three investigated species of Brassica L., 42.11% and 42.76% of average polymorphism was revealed from B. napus and B. rapa, respectively whereas B. juncea was observed with 47.37% of average polymorphism (Table 4).

Vol17No4_Mol_Far_fig2 Figure 2: Percentage of polymorphism (A) total percentage of polymorphic and monomorphic protein bands, (B) percentage of polymorphism obtained from thirteen different variants of Brassica L.

Click here to View figure

Table 4:  Levels of polymorphism within 13 variants of Brassica L.

Variants of Brassica


No. of polymorphic bands % of polymorphism exists in Brassica variants Average  % of polymorphism exists in each Brassica species Average % of polymorphism exists in 13 Brassica variants
Brassica  juncea var. Daulot 8 42.11 47.37
B. juncea var. Rai-5 10 52.63
B. juncea var. BS-10 11 57.89
B. juncea var. BS-11 7 36.84
B. napus var. BS-7 8 42.11 42.11 44.13
B. rapa var. Tori-7 8 42.11 42.76
B. rapa var. TS-72 7 36.84
B. rapa var. SS-75 10 52.63
B. rapa var. BS-6 7 36.84
B. rapa var.BS-9 9 47.37
B. rapa var.BS-12 10 52.63
B. rapa var.BS-14 6 31.58
B. rapa var. BS-15 8 42.11

As stated through Majumder et al. (2012)35 assessment of genetic diversity aided with protein markers have been ascertained as a sterling tool in characterization of many crops species at gene level. The values of Nei’s (1973)19 gene diversity and Shannon’s information index (Lewontin, 1972)20 for the inquired Brassica variants across all the loci are provided in Table 5 and Fig. 3. The estimation of Nei’s (1973)19 gene diversity for all the variants was 0.3488 ± 0.1726 and Shannon’s information index was 0.5098 ± 0.2299. Estimation of Nei’s (1973)19 gene diversity (0.3488) and Shannon’s information index (0.5098) across all loci (Table 5) also assisted with the subsistence of high level of genetic variation in all studied materials of Brassica L.

Table 5: Estimation of genetic variability among 13 variants of Brassica L.

Locus Nei’s (1973) gene diversity ( h ) Shannon’s information index ( i )
Locus a 0.3550 0.5402
Locus b 0.4260 0.6172
Locus c 0.1420 0.2712
Locus d 0.1420 0.2712
Locus e 0.3550 0.5402
Locus f 0.4260 0.6172
Locus g 0.1420 0.2712
Locus h 0.4970 0.6902
Locus i 0.4970 0.5402
Locus j 0.3550 0.6902
Locus k 0.4970 0.6902
Locus l 0.4260 0.6172
Locus m 0.0000 0.0000
Locus n 0.4260 0.6172
Locus o 0.4970 0.6902
Locus p 0.4794 0.6663
Locus q 0.4794 0.6663
Locus r 0.4970 0.6902
Locus s 0.0000 0.0000
Mean 0.3488 0.5098
St. Dev 0.1726 0.2299


Vol17No4_Mol_Far_fig3 Figure 3: Estimated genetic diversity (Nei’s genetic diversity, Shannon’s information index and proportion of polymorphic loci found at different loci) of studied Brassica variants.

Click here to View figure

The only disclosure on PAGE for leaf stored protein of Brassica L. was reported by Akbar et al. (2020)11, in which an average of 20.64% polymorphism was documented from three different varieties of the species – B. rapa, B. juncea and B. napus.   Hence it can be suggested that more number of varieties and species are required to assess the degree of polymorphism of Brassica L. The determination of our existing perusal has been then assimilated with the findings of Mukhlesur and Hirata (2004)14, where the cultivars of B. rapa, B. juncea, B. napus, B. carinata, B. oleracea and hexaploid Brassica from various geographical origins were examined for leaf protein analysis by SDS-PAGE and the consequence found incongruous with the outcome of ours one as no significant difference was observed within the cultivars even between different species by them. The possible reasons for such type of inconsistency may be due to – (i) difference in morphology, ploidy level and constituents of genome, (ii) for different geographical distribution of the respective variants, (iii) difference in cultural practices, (iv) difference in methodological approaches.

Mentionable amount of studies have been performed early by many workers concerning the degree of polymorphism for total seed storage protein of Brassica as well as other species of cereal, pulses and oilseed crops with SDS-PAGE technique throughout the world. 21.2% of polymorphism was recorded within the varieties of B. campestris imitated by 6.3% in B. napus and 3.2% in B. juncea after evaluating varied varieties of distinctive Brassica species (Mukhlesur and Hirata, 2004)14. Ibrahim et al. (2017)17 apprised 58% of polymorphism from 53 genotypes of Indian mustard (B. juncea L.) germplasm. 94.44% polymorphism was reported from the diverse genotypes of Eruca sativa by Shinwari et al. (2013)36. From six cultivars of Egyptian soybean, a total of 30.43% polymorphism was assayed by Rayan and Osman (2019)37, 63.2% polymorphism was conveyed by Hlozáková et al. (2016)38 in four European cultivars of common wheat, in hundred-five accessions of Pakistani sesame 70% polymorphism was debriefed by Akbar et al. (2008)39, 82.00% of polymorphism have been evaluated by Vivodík et al. (2018)40 from fifty-six genotypes of Tunisian castor bean. Bhargav et al. (2016)41 assessed 91% of polymorphism from twenty Indian local genotype of common bean.

Knowledge on genetic similarity (distance) between germplasm and among individuals or populations is beneficial in an exceedingly breeding application since it lets incorporation of germplasm and offers greater effective sampling of germplasm to go for the improvement of populations. In the current research, the dendrogram constructed from the UPGMA analysis and coefficients of distance matrix unconcealed great connections between a numbers of variants (Fig. 4 and Table 6). By taking into account the banding pattern of leaf protein, genetic distance matrix for all the thirteen quested samples of Brassica variants were determined concurring to Nei’s genetic distance (1972)21 (Table 6). Genetic variation among the variants typically screen via the way of means of genetic distance matrix. In our existing disclosure, the values of pair-wise comparison of Nei’s (1972)21 genetic distance among thirteen Brassica variants ranged from 0.0541 to 1.5581 (Table 6 and Fig. 4).

Table 6: Summary of Nei’s genetic distances of 13 variants of Brassica L.

Brassica variants Daulot Rai-5 BS-10 BS-11 BS-7 Tori-7 TS-72 SS-75 BS-6 BS-9 BS-12 BS-14 BS-15
Daulot 0
Rai-5 0.3795 0
BS-10 0.4595 0.3054 0
BS-11 0.4595 0.1719 0.3795 0
BS-7 0.3795 0.2364 0.3054 0.0541 0
Tori-7 0.5465 0.5465 0.6419 0.3054 0.2364 0
TS-72 0.8650 0.8650 0.9985 0.5465 0.6419 0.3054 0
SS-75 0.7472 0.9985 0.8650 0.8650 0.9985 0.5465 0.1719 0
BS-6 0.8650 0.8650 1.3350 0.5465 0.6419 0.3054 0.2364 0.3054 0
BS-9 0.6419 0.6419 0.9985 0.5465 0.6419 0.4595 0.3795 0.3054 0.1112 0
BS-12 0.7472 0.7472 0.8650 0.6419 0.7472 0.5465 0.4595 0.2364 0.1719 0.0541 0
BS-14 0.7472 0.9985 1.5581 0.6419 0.7472 0.3795 0.1719 0.2364 0.0541 0.1719 0.2364 0
BS-15 0.7472 0.7472 1.1527 0.4595 0.5465 0.2364 0.1719 0.2364 0.0541 0.1719 0.2364 0.1112 0

The highest genetic distance was observed between BS-10 and BS-14 (1.5581) among the variants (Table 6) that indubitably demonstrated the presences of greater genetic distance between these two populations, notably the previous one representing the variant of B. juncea whilst the last mentioned one represented the variant of B. rapa. Likewise, pair wise genetic distance with relatively high values was detected between BS-10 and BS-6 (1.3350), BS-10 and BS-15 (1.1527), BS-10 and TS-72 (0.9985), BS-10 and BS-9 (0.9985), BS-7 and SS-75 (0.9985), Rai-5 and SS-75 (0.9985), Rai-5 and BS-14 (0.9985). Contrastingly, the lowest genetic distance was found between BS-9 and BS-12 (0.0541), both were variants from B. rapa (Table 6). The difference between the highest (1.5581) and the lowest value of genetic distance (0.0541) revealed the wide range of genetic variability persisting among the thirteen rapeseed-mustard variants. High genetic distance values between variants pair may be found because of difference in hereditary constituents. Taking account the genetic distance values, the findings revealed that variants were genetically distinctive from each other and which may well be utilized in breeding program to achieve potential hereditary picks up.

Based on Nei’s (1972)21 genetic distance obtained from protein banding pattern, a dendrogram was drawn up employing UPGMA in which the thirteen variants of Brassica

Vol17No4_Mol_Far_fig4 Figure 4: Dendrogram of thirteen Brassica variants produced by UPGMA clustering method based on Nei’s (1972) genetic distance.

Click here to View figure

were differentiated into two main clusters or groups C1 and C2 (Fig. 4). The first cluster C1 consisted of five variants of Brassica of which four variants from B. juncea (Daulot, Rai-5, BS-10 and BS-11) and one variant from B. napus, BS-7 were present. The explanation for two species had a place to same cluster is probable that the nearly introduced genotype might be shared some genes from the AA genomic base of other variants which have been utilized in this consider. It might also possibly that the alleles of CC genome which had original gene base of the species near to that of the other two elemental species. The cluster or group C1 was divided into two sub-clusters. Daulot was found to be present in sub-cluster I (SC1) of cluster C1, and sub-cluster II (SC2) was further divided into two sub-sub cluster where sub-sub cluster II (SSC2) was found with only BS-10. Concurrently, sub-sub cluster I (SSC1) was consisted of three closely related variants of Rai-5 with BS-11 and BS-7. On the other hand, the major cluster C2 included eight variants of B. rapa (Tori-7, TS-72, SS-75, BS-6, BS-9, BS-12, BS-14 and BS-15) and divided into two sub-clusters (SC1) and (SC2). The sub-cluster (SC1) of cluster C2 was presented with Tori-7 alone; however, the second sub-clusters (SC2) included the rest of the variants of B. rapa. The second sub-clusters (SC2) further segregated into two sub-sub clusters; SSC1 and SSC2. In sub-sub cluster I (SSC1), there was TS-72 and SS-75 whereas sub-sub cluster II (SSC2), was further divided in two sub-sub-sub clusters. Sub-sub-sub cluster I was present with three closely related variants of BS-6, BS-14 and BS-15 whereas, in sub-sub-sub cluster II there was BS-9 and BS-12 with minimal genetic distance of 0.0541. It was observed that the five variants of B. rapa found in sub-sub-sub cluster II showed low genetic distances among them ranging from 0.0541–0.2364. In this way, there was a limpid clustering pattern of geographically closer variants within the present ponder showing that the affiliation between genetic relatedness and geological distance has significance.

Presently, after the comparison between the come out of physio-morphological and agronomic traits and genetic distance matrix (Table 1 and Fig. 4) of the inquired variants of Brassica, it was revealed that in the first cluster C1, Daulot, Rai-5, BS-10, BS-11 and BS-7 had almost the similar seed color (reddish brown to black seed) and other agronomic characteristics (such as- tolerance to biotic and abiotic stresses of environment). Similarly, in the major cluster C2 – the morphological traits which include seed coloring were alike in BS-6, BS-14 and BS-15 (yellow seeded variants), whereas in BS-9 and BS-12 (reddish brown seeded variants). It was also observed that SS-75 and TS-72 grouped in a distant pair based on agronomic aspects (susceptibility to pest and environmental factors) and deviated from black seeded variety Tori-7 via cluster analysis (Fig. 4 and Table 1). The report of Saha et al. (2008)42 on genetic assessment of four Brassica species through RAPD marker found more or less congruent with our current disclosure that yellow seeded Brassica variants could be separated from the brown seeded variants by cluster analysis. Therefore, it looks through that cluster analysis would play a noteworthy implement in ascertaining genetic diversity regarding the diverse physio-morphological characters and other agronomic traits of plant species.

Conclusion

Genetic variation alludes to the differences within the constitutions of heredity in an individual of a species and it is imperative in keeping up the developmental steadiness and biological latent of plant species. More genetic variability within variants and noteworthy differentiation between variants states plenty of genetic resources of a species. The outcome of our existing quest exhibited differences in the position, number and staining intensity of protein bands among the studied variants which manifests the application of PAGE for differentiation of inquired variants of Brassica L. High level of polymorphisms (89.47%) along with wide range of genetic distance (0.0541–1.5581) was viewed from the thirteen variants of Brassica. Broad range of polymorphism and genetic distance brought to light the presence of wide variability within Brassica spp. The variants of BS-10 and BS-14 contain the highest genetic variation, whereas BS-9 and BS-12 contain the lowest genetic variation among the variants employed in this analysis. Variants having near vicinity in their origin, morphological traits and stratagem of breeding are possibly to have less genetic distance from each other. Hence, the results of this inquisition put forward for consideration that the variants of BS-10, BS-9, BS-12 and BS-14 could furnish the amenities for selection as parental source in coming breeding program to ameliorate Brassica variants in Bangladesh. Howsoever, it is far recommended that exceeding molecular information is required to own better evaluation of genetic variability of Brassica germplasm in Bangladesh as well as currently launched varieties/ lines and therefore more efficacious utilization of existing variability for advancement of Brassica crop in Bangladesh.

Acknowledgement

The authors expressed their gratitude to the Oilseed Research Center of Bangladesh Agricultural Research Institute (BARI) for providing the seeds of thirteen variants of Brassica L.

Conflict of Interest

The authors pertaining to this research work declared no conflict of interest.

Funding Source

Ministry of Science and Technology, Government of the People’s Republic of Bangladesh granted the financial support for conducting this research work.

References

  1. Kasem W. T., Ghareeb A., Marwa E. Seed morphology and seed coat sculpturing of 32 taxa of family Brassicaceae. Am. Sci. 2011; 7(2): 166–178.
  2. Gomez – Campo C. Studies on Cruciferae V. Chromosome numbers for twenty-five taxa. Anales del Instituto Botanica A. J. Cavanilles. 1980; 35: 177–182.
  3. Nagahara U. Genome analysis in Brassica with special reference to the experimental formation of napus and peculiar mode of fertilization. Jpn. J. Bot. 1935; 7: 389–452.
  4. Hedge I. C.: A systematic and geographical survey of old world Cruciferae. In: The biology and chemistry of the Cruciferae (Vaughan JG, MacLeod AJ, Jones BMG, eds). New York: Academic Press. 1976; pp 1–46.
  5. Yarnell S. H. Cytogenetics of the vegetable crops. II. Crucifers. Rev. 1956; 22: 81–166.
    CrossRef
  6. Thiyam U., Kuhlmann A., Stockmann H., Schwarz K. Prospects of rapeseed oil by-products with respect to antioxidative potential. R. Chim. 2004; 7(6): 611–616.
    CrossRef
  7. Cover C. M., Hsieh S. J., Tran S. H., Hallden G., Kim G. S., Bjeldanes L. F., Firestone G. L. Indole-3-carbonyl inhibits the expression of cyclin-dependent kinase-6 and induces a G1-cell cycle arrest of human breast cancer cells independent of estrogen receptor signaling. J. Biol. Chem. 1998; 273(7): 3838–3847.
    CrossRef
  8. Staub R. E., Feng C., Onisko B., Bailey G. S., Firestone G. L., Bjeldanes, L. F. Fate of indole-3-carbinol in cultured human breast tumor cells. Res. Toxicol. 2002; 15(2): 101–109.
    CrossRef
  9. Zhang J., Yuan Q., Meng Y., Li X., Nan Z., Wang Y., Zhang W. A genetic diversity analysis of wild Lespedeza populations based on morphological characters, allozyme and RAPD methods. Plant Breed. 2007; 126: 89–94.
    CrossRef
  10. Ghodsvali A., Khodaparast M. H. H., Vosoughi M., Diosady L. L. Preparation of canola protein materials using membrane technology and evaluation of meals functional properties. Food Res. Int. 2005; 38(2): 223–231.
    CrossRef
  11. Akbar F., Paul M., Begum K. N. Karyological and genetic diversity study using molecular marker among three species of oilseed Brassica Ind. J. Pure App. Biosci. 2020; 8(4): 267–281.
    CrossRef
  12. O’Farrell P. H. High resolution two-dimensional electrophoresis of proteins. Biol. Chem. 1975; 250(10): 4007–4021.
    CrossRef
  13. Turi N. A., Farhatullah, Rabbani M. A., Khan N. U., Akmal M., Pervaiz Z. H., Aslam, M. U. Study of total seed storage protein in indigenous Brassica species based on sodium dodecyl sulfate polyacrylamide gel electrophoresis (SDS-PAGE). J. Biotechnol. 2010; 9(45): 7595–7602.
  14. Mukhlesur R. Md., Hirata Y. Genetic diversity in Brassica species using SDS-PAGE analysis. Biol. Sci. 2004; 4(2): 234–238.
    CrossRef
  15. Sadia M., Malik S. A., Rabbani M. A., Pearce S. R. Electrophoretic characterization and the relationship between some Brassica Electron. J. Biol. 2009; 5(1): 1–4.
  16. Zada M., Zakir N., Rabbani Z., Shinwari Z. K. Assessment of genetic variation in Ethopian mustard (Brassica carinata Braun) germplasm using multivariate techniques. Pak. J. Bot. 2013; 45: 583–593.
  17. Ibrahim M. I., Abbasi F. M., Rabbani M. A., Inamullah, Jan S. A., Ilyas M., Khurshid H. Evaluation of genetic variation among Indian Mustard (Brassica juncea) genotypes by SDS-PAGE method. Proc. Pakistan Acad. Sci. (B. Life and Environmental Sciences) 2017; 54(4): 333–339.
  18. Lowry O. H., Rosebrough N. J., Farr A. L., Randall R. J. Protein measurement with the Folin phenol reagent. Biol. Chem. 1951; 193(1): 265–275.
    CrossRef
  19. Nei M. Analysis of gene diversity in subdivided populations. Natl. Acad. Sci. 1973; 70(12): 3321–3323.
    CrossRef
  20. Lewontin, R. C.: The apportionment of human diversity. In: Evolutionary Biology (Dobzhansky T, Hecht MK, Steere WC, eds). Heidelberg: Springer. 1972; pp 381–398.
    CrossRef
  21. Nei M. Genetic distance between populations. Nat. 1972; 106(949): 283–292.
    CrossRef
  22. Yeh F. C., Yang R. C., Boyle T. B. J., Ye Z. H., Mao J. X. POPGENE, the user-friendly software for population genetic analysis. Biol. Biotechnol. Cent. 1999; University of Alberta, Canada.
  23. Ladizinsky G., Hymowitz D. Seed protein electrophoresis in taxonomic and evolutionary studies. Appl. Genet. 1976; 54: 145–151.
    CrossRef
  24. Geetha V. V., Balamurugan P. SDS PAGE electrophoresis in mustard cultivars. J. Agric. Res. 2011; 6(5): 437–443.
    CrossRef
  25. Kakaei M., Kahrizi D. Study of seed proteins pattern of Brassica napus varieties via sodium dodecyl sulfate polyacrylamid gel electrophoresis. Res. J. Biotechnol. 2011; 2(1): 26–28.
  26. Odeigah P. G. C., Oboh B., Aghalokpe I. O. The characterization of Nigerian varieties of pepper, Capsicum annuum and Capsicum frutescens by SDS-polyacrylamide gel electrophoresis of seed proteins. Resour. Crop Evol. 1999; 46: 127–131.
    CrossRef
  27. Devi S. G. Varietal identification through electrophoresis in sunflower (Helianthus annus) 2000; Master’s thesis, Tamil Nadu Agricultural University, Coimbatore.
  28. Varma V. L. K., Reddy N. M., Keshavulu K., Ankaiah R. Characterization of maize (Zea mays) genotypes through seed protein electrophoresis (SDS-PAGE). Crop. Res. 2005; 30: 124–127.
  29. Vijayan R. Organic seed production in rice cv. ADT 43. 2005; Doctoral dissertation, Tamil Nadu Agricultural University, Coimbatore.
  30. Paul R., Datta A. K. Seed protein profiles in celery (Apium graveolens) and Ajowan (Trachyospermum amni L.) plant types. Int. J. Plant. Sci. 2006; 1(1): 36–38.
  31. Nisha C. Assessment of seed quality in wheat (Triticum aestivum L.) varieties as influenced by different alien rust resistant genes under varying production conditions. 2007; Doctoral dissertation, Tamil Nadu Agricultural University, Coimbatore.
  32. Sumathi S. Varietal identification in oats (Avena sativa ). 2007; Master’s thesis, Tamil Nadu Agricultural University, Coimbatore.
  33. Abdulrahaman A. A, Kolawole O. S., Onile O. G., Oladele F. Seed electrophorentic characterization and taxonomic implications of some accessions of Abelmoschus esculentus (Moench) in Nigeria. Jewel J. Sci. Res. 2015; 3(1): 136–145.
  34. Begum K. N., Alam Sk. S. Genetic diversity in nine chick-pea (Cicer arietinum) varieties based on different molecular markers. Bangladesh J. Bot. 2019; 48(1): 195–203.
    CrossRef
  35. Majumder D. A. N., Hassan L., Rahim M. A., Kabir M. A. Analysis of genetic diversity in mango (Mangifera indica) using isozymetic polymorphism. Afr. J. Biotechnol. 2012; 11(87): 15310–15323.
  36. Shinwari S., Akbar F., Rabbani M. A., Mumtaz A. S., Shinwari Z. K. Evaluation of genetic diversity in different genotypes of Eruca sativa from Pakistan by SDS-PGE analysis. J. Bot. 2013; 45(4): 1235–1240.
  37. Rayan W. A., Osman S. A. (2019). Phylogenetic relationships of some Egyptian soybean cultivars (Glycine max) using SCoT marker and protein pattern. Bull. Natl. Res. Cent. 2019; 43(161).
    CrossRef
  38. Hlozáková T. K., Gregová E., Vivodík M., Gálová, Z. Genetic diversity of European cultivars of common wheat (Triticum aestivum) based on RAPD and protein markers. J. Cent. Eur. Agric. 2016; 17(4): 957–969.
    CrossRef
  39. Akbar F., Yousaf N., Rabbani M. A., Shinwari Z. K., Masood M. S. Study of total seed proteins pattern of sesame (Sesamum indicum) Landraces via sodium dodecyl sulfate polyacrylamide gel elecrophoresis (SDS-PAGE). Pak. J. Bot. 2008; 44(6): 2009–2014.
  40. Vivodík M., Saadaoui E., Balážová Ž., Gálová Z., Petrovičová L. Characterization of Tunisian castor bean genotypes using SDS-PAGE of total seed storage proteins. S. J. F. Sci. 2018; 12(1): 701–706.
    CrossRef
  41. Bhargav S., Rai G. K., Mallick S. A., Rai S. K., Kumar R. R., Singh M., Parveen A., Jamwal D., Saikia S. L., Bagati S. Assessment of genetic diversity in local genotypes of common bean (Phaseolus vulgaris) using biochemical markers. The Bioscan 2016; 11(3): 1955–1961
  42. Saha S., Molla Md. R., Chandra D., Rahman, L. Assessment of genetic variation and relationships within the varieties of four Brassica species by RAPD markers. J. Crop Sci. 2008; 2(3): 105–114.

Seasonal Variation of Zooplankton Density and Physicochemical Parameters of A Perennial Freshwater Body, Samudrabundh of Joypur, Bankura, West Bengal, India

$
0
0

Introduction

Water is the prime and basic necessity of life forms in this earth. It is immensely important to maintain the quality of natural ecosystem and also development of human race. The quality of water plays a major role in plankton growth as well as the biology and production of the cultured aquatic organisms and their yields1. Fresh water environment comprises of a combination of both biotic and abiotic factors. The important abiotic factors which are mainly used to study the water quality of a perennial aquatic body are temperature, PH, turbidity, dissolved Oxygen (DO), Chloride, alkalinity and Total hardness2. Biotic factors are comprised mainly by the plankton and other aquatic flora and fauna.

Zooplanktons are tiny microscopic animals. They float freely in the surface water column. Their movement as well as distribution is determined by water waves and current. They feed on phytoplankton and smaller zooplankton. Threats for aquatic biodiversity is mainly due to human interference and mismanagement of both biotic resources and the abiotic factors which leads to deterioration of water quality3 . Most of the freshwater bodies are constantly getting polluted due to domestic wastes, sewages, industrial and agricultural effluents.

In aquatic food chains, zooplankton forms a major link in the energy transfer between autotrophs and heterotrophs4-5. Zooplankton community are important members of aquatic food webs because they serve as an important food item for fishes and invertebrate predators 6.

The physicochemical properties and diversity of flora and fauna are two important pillars which determine the healthy status of an aquatic ecosystem. The physical, chemical and microbial characters of a water body determine its nutrient status.. It is not possible to understand the biological phenomenon fully without the knowledge of water chemistry of the aquatic ecosystem7 . It is necessary to know the physicochemical properties of water to study the rearing practices of the fishes of water bodies8 .

No record about the physicochemical properties and zooplankton density and diversity of the perennial water body, Samudrabundh, of Joypur block of Bankura district, West Bengal is available earlier than this study. So, this study has been conducted to fill that lacuna and to make a quantitative analysis  of the water of the aquatic body so that proper utilization of such a big perennial water body can be made.

Materials  and Methods

The study was conducted by collecting water samples and zooplankton samples from the perennial pond of Samudrabundh, Joypur, Bankura. It is located in 23°2’39.81 N and 87°26’12.45 E. Approximately its water area is 25 hectors. The study was conducted during the period of March.2019 to February, 2020. For the ease of doing the job the study period was divided into four seasons viz. summer (March,2019 to May,2019), monsoon(June,2019 to August,2019), Post monsoon(Sep,2019 to Nov,2019), and Winter (December,2019 to February,2020). Random samples of water were collected in the morning on any three days during each season. Instead of surface water , samples from a depth of 50 cm were collected for the study .For determination of  Dissolved oxygen (DO), Free CO2, PH, total alkalinity, hardness and salinity standard method of APHA(2008) was followed 9 . For determination of Temperature thermometer marked with 0.01 graduated centigrade (0C) was used. PH was measured using a digital PH meter (Systronics model,335).Turbidity was measured in NTU by using a Nephlometer (Systronics,338).

For zooplankton samples, 40 L of water was filtered using plankton net of 50 μm mesh size. Zooplankton samples were preserved in 10% formalin at the site itself. Sample was allowed to settle down for a day. Sedgwick Rafter plankton counting cell was used for counting of zooplankton to find out its density. The detailed study of the plankton was done by using OLYMPUS inverted stereoscopic microscope (Model MLX-B) fitted with a NIKON camera. Identification of plankton was done according to the character mentioned by Battish, 199210

Results and Discussion

Temperature

Temperature is an important physical factor that affects the quality of the water and considered as controlling factor for the fluctuation of plankton and functioning of the aquatic ecosystem11. Water temperature in tropical waters in the range between 13.50C and 320C is found to be suitable for the development of the planktonic organisms12.  In the study site the temperature of water varies from 19.30C in winter to 21.30C in Summer . ( Table 1)

In Samudrabundh water temperature shows positive correlation with pH , turbidity , free CO2, salinity and total alkalinity. It shows negative correlation with DO, chloride, total hardness and total zooplankton. ( Table 2)

Turbidity

Maximum turbidity value 9.3 NTU has been recorded in monsoon .High turbidity values during monsoon has also been observed by Shinde et al, (2011)13 at Harsool –Savangi dam in Aurangabad. This is due to rapid flow of  water in rainy season which bring silt, clay etc along with it while low values in summer is due to low water level ( Table 1).

In Samudrabundh turbidity shows positive correlation with pH, free CO2, salinity and total alkalinity. It shows negative correlation with, DO, chloride, total hardness and total zooplankton ( Table 2).

pH

pH value ranges between 5.7 to 6.8 ( Table 1). According to (Kurbatova, 2005) pH value between 6.0 and 8.5 is considered as medium productive nature of a reservoir14 . So the reservoir under study is considered as of medium productive nature.

In Samudrabundh  pH  shows  positive correlation with free CO2,  salinity and total alkalinity . It shows negative correlation with DO, total hardness and total zooplankton ( Table 2).

Dissolved Oxygen.

Dissolved oxygen (DO) is very crucial limnological parameter whose measurement is vital regarding the culture of any aquatic animal. Dissolved Oxygen (DO) in the study site varies from 3.0 mg/l in summer    to 8.4 mg/l in winter .DO value less than 3.0 mg/l is considered as detrimental for fish growth15 . So, the DO value reaches its lowest threshold value during summer in the study area  ( Table 1).

In Samudrabundh, DO shows positive correlation with chloride, total hardness and total zooplankton . It shows negative correlation with free CO2 salinity and total alkalinity ( Table 2).

Free CO2

Carbon dioxide in water bodies is mainly contributed by the respiratory activites of aquatic animals. In the study area the free CO2 ranges from 10.2 mg/l in winter to 15.8 mg/l in summer ( Table 1).

In Samudrabundh, free CO2 shows positive correlation with Salinity and Total alkalinity. It shows negative correlation with chloride, total hardness and total Zooplankton  ( Table 2).

According to Ellis (1937) dissolved free CO2 should be less than 5mg/l for good fish production in water bodies. If the free CO2 level is more than 20mg/l then it may cause hindarance with oxygen intake by fishes. In the present study the average free CO2 varies between 10.2mg/l to 15.8mg/l which may be consider a little higher in context of fish production.

Chloride

Salts of sodium and potassium are mainly responsible for the chloride content of water. The chloride content of water in the study area ranges from 36.7mg/l in summer to 54.7mg/l in winter season ( Table 1).

In Samudrabundh chloride shows positive correlation with total hardness and total zooplankton. It shows negative correlation with alkalinity ( Table 2).

Salinity

In Samudrabundh salinity shows positive correlation with alkalinity. It shows negative correlation with total hardness and total zooplankton  ( Table 2).

Total Alkalinity

.In the study area the total alkalinity ranges from 26.7mg/l in winter to 39.3mg/l in summer (Table 1).

In Samudrabundh alkalinity shows positive correlation with temperature, turbidity, pH, free CO2 and salinity. It shows negative correlation with D.O., chloride, total hardness and total zooplankton ( Table 2).

Total hardness

The hardness of water is also an important parameter which can  indicates water quality. Sawyer (1960) has catagorised perennial water bodies into three groups according to their degrees of hardness 16. It is as follows: 0 – 75 mg/L = soft, 75 – 150 mg/L= moderately hard, 150 – 300 mg/L= hard, above 300 mg/L= very hard. As the water of the study area ranges between 30.1 mg/l to 47.1 mg/l, so the water of this perennial water bodies is considered soft in biochemical nature  ( Table 1).

In Samudrabundh total hardness shows positive correlation with D.O., chloride and total zooplankton. It shows negative correlation with temperature, turbidity, pH, free CO2 and salinity ( Table 2).

Table I: Seasonal variation of hydrological  parameters of Samudrabundh , Joypur, Bankura

Parameters Summer
(Mar2019-May 2019)
Monsoon
(June2019-Aug2019)
Post Monsoon
(Sep2019-Nov2019)
Winter
(Dec2019-Feb2020)
Temperature (C) 21.3 20.3 20.0 19.3
Turbidity (NTU) 8.0 9.3 4.7 4.0
PH 6.8 6.6 6.6 5.7
DO (mg/l) 3.0 3.1 5.7 8.4
Free CO2(mg/l) 15.8 15.3 12.7 10.2
Chloride (mg/l) 36.7 50.3 44.9 54.7
Salinity(mg/l) 128.6 120.2 112.0 96.1
Alkalinity (mg/l) 35.7 39.3 29.7 26.7
Total hardness (mg/l) 30.1 33.7 41.4 47.1
Total zooplankton(Ind/L) 879 756 957 954

Table 2: Pearson Correlation matrix (r) between several hydrological parameter and Total abundance of Zooplankton of Samudrabundh , Joypur, Bankura.

  Temp Turbidity pH D.O. Free Co2 Chloride Salinity Alkalinity Total
Hardness
T.Zoop
Temp 1
Turbidity 0.716 1.000
pH 0.847 0.651 1.000
D.O. -0.881 -0.919 -0.894 1.000
Free Co2 0.907 0.916 0.885 -0.998 1.000
Chloride -0.900 -0.361 -0.819 0.661 -0.689 1.000
Salinity 0.960 0.822 0.933 -0.972 0.980 -0.818 1.000
Alkalinity 0.703 0.992 0.704 -0.937 0.927 -0.367 0.834 1.000
T. Hardness -0.949 -0.897 -0.853 0.977 -0.990 0.736 -0.982 -0.892 1.000
T.Zoop -0.418 -0.933 -0.421 0.748 -0.730 0.011 -0.580 -0.933 0.681 1

Zooplankton analysis

During the study period we have recorded a total of 26 taxa of zooplankton. Out of which 8 species comprises of Rotifer, 05 species of Copepoda, 10 species of Cladocera and 03 species of Ostracoda. The main dominant group in this pond is contributed by Cladocera. It constitutes 46% of the total zooplankton abundance, followed by Rotifera 43%,  Copepoda 9% and Ostracoda 2%   (Figure 1 and Table 3).

Vol17No4_Sea_Tap_fig1 Figure 1: Relative abundance of zooplankton groups of Samudrabundh , Joypur, Bankura

Click here to View figure

Table 3: List of Zooplankton Groups obtained from Samudrabundh , Joypur, Bankura during study period   

Sl  No Group Zooplankton species
1 CLADOCERA Daphnia carinata
Daphnia magma
Daphnia retrocurva
Ceriodaphnia regaudi
Ceriodaphnia cornuta
Ceriodaphnia  reticulat
Bosmina longirostris
Moina micrura
Moina brachiata
Alona affinis
2 ROTIFERA Brachionus bidentata
Brachionus

quadridentatus

Brachionus caudatus
Brachionus diversicornis
Brachionus rubens
Keratella tropica
Lecane sp.
Asplanchna sp
3 COPEPODA Cyclops sp
Mesocyclops leuckarti
Mesocyclops hyalinus
Diaptomus pallidus
Diaptomus denticornis
4 OSTRACODA Stenocypris sp
Cyprinotus sp
Cyprinotus nudus

The density of Cladocera ranges from 361(Ind/L) in summer to 441 (Ind/L )in post monsoon. The density of  Rotifera ranges from 265(Ind/L) in monsoon to 438 (Ind/L) in summer .The density of copepods ranges from 56 (Ind/L) in summer  to 102 (Ind/L) in post monsoon .The density of Ostracoda ranges from 6 (Ind/L) in monsoon  to 24 (Ind/L) in summer ( Figure 2 and Table 4).

Vol17No4_Sea_Tap_fig2 Figure 2 : Seasonal Variation of abundance of zooplankton of Samudrabundh , Joypur, Bankura

Click here to View figure

Table 4: Density (Ind/L) of  different Zooplankton Groups of Samudrabundh, Joypur Bankura during the study period.

Summer Monsoon Post Monsoon Winter
Cladocera 361 396 441 418
Copepoda 56 89 102 91
Rotifera 438 265 400 425
Ostracoda 24 6 14 20

Conclusion

The study of the physicochemical factors of Samudrabundh reveals that   its water turbidity is quite low, its pH value reveals that this water body is of medium productive in nature. The total hardness value suggests that the water body is of soft in nature. In some seasons the dissolved oxygen value remains at the critical level for fish production.  Alkalinity is also quite low to support efficient fish production. Panov et al (1973) has suggested that for efficient fish production the zooplankton density of a water body must be above 1500 (Ind/L) 17 . But in the present study it has been observed that zooplankton density ranges from 756 (Ind/L) to 957 (Ind/L) which is quiet lower than the desired value. Hence it is concluded that the secondary plankton production in this water body is very less as required for high rate of fish yield. So, the study concludes that though this perennial water body bears a tremendous potentiality of fish culture the limnological features and planktonic abundance of this water body is not satisfactorily good for production of finfishes in them

Acknowledgement

We want to acknowledge Principal, Bankura Sammilani College, Bankura for his  help and support for conducting the field  work. We also want to acknowledge the help received from the local respondents who have actively participated in this field work.

Conflict of interest

Authors have no conflict of interest.

Funding Sources

No funding agency

Reference

  1. Dhawan, A. and Karu, S. Pig dung as pond manure: effect on water quality, pond  productivity and  growth of carps in poly culture system. The International Centre for   Living Aquatic Resources Management (ICLARM) quarterly, Manila.,2002; 25 (1):
    1-14.
  2. Shaikh, N.andYegari S. G.Seasonal and temporal changes and their influence on free carbon  dioxide, Dissolved oxygen(DO) and pH in Tansa river of Thane District , Maharastra. Journal of Aquatic Biology., 2003;18 (1), 73-75.
  3. Sati S.C. and Paliwal, P.C..Physicochemical and bacteriological analysis of Kosi river in Central Himalaya .Poll.Res.,2008; 27(1): 79- 183.
  4. Deivanai, K., Arunprasath, S., Rajan, M. K. and Baskaran, S. (2004). Biodiversity of phyto  and zooplankton in relation to water quality parameters in a sewage polluted pond at Ellayirampannai, Virudhunagar district. In Proceedings of national symposium on biodiversity resources management and sustainable use, organized by the center for biodiversity and forest studies, Madurai Kamaraj University, Madurai
  5. Shashikanth, M.  and Vijaykumar, K.. Ecology and abundance of zooplankton in Karanja reservoir, Karnataka. Environ. Monit.and Assess., 2009;152 (1-4): 451-458.
    CrossRef
  6. Prasad, B.B. and Singh, R. B. Composition, abundance and distribution of  phytoplankton and zoobenthos in a tropical water body. Nature Environment and Pollution Technology., 2003;2 (3): 255-258.
  7. Tiwari, T.N. (1992). Pollution of Lake Hussain sagar, Hyderabad, India: correlation and cluster analysis. In Mishra, S.R and Saksena, D.N. (Eds.) Aquatic Ecology, Ashish Publ. House, New Delhi, pp213-229.
  8. Jhingran, V.G. Fish and Fisheries of India, 3rdEdn. Hindustan Publishing Corporation, Delhi,   India, pp 727.1991
  9. APHA. Clescerl, L, S. (Editor), Greenberg, A, E.(Editor), Eaton, A,  D.(Editor) (2008).Standard Methods for   Examination of Water and Wastewater (21th ed.),  American  Public Health Association, Washington, DC.
  10. Wetzel, R.G. (1975).  Limnology, W.B. Sunders Company Pub. Philadelphia, London, Toronto,  p740.
  11. Gaikwad, S.R., Ingle, K.N.  and Thorat, S. R. Study of zooplankton pattern and resting egg diversity of recently dried water bodies in north Maharashtra region. Journal of Environmental Biology., 2008;29(3): 353-356.
  12. Shinde, S.E., Pathan,T.S., Raut,K.S. and Sonawane, D.L. (2011) . Studies on the physicochemical and correlation coefficient of Harsool-Savangi Dam , district Aurangabad, India .Middle East Journal of Scientific Research, 2011,8(3) : 544-554.
  13. Ellis, M. M.(1937). Detection and Measurement of stream pollution. Bull 22, US Bureau of Fish Bull.,1937; 48(22): 365-425.
  14. \Sawyer,  C.H. (1960). Chemistry for sanitary Engineers. McGraw Hill Book Co., New York
  15. Panov, D. A.,Chromov, L. V. and Motenkova, L. G.  Forming of the food base of ponds during rearing of phytophagous fish larvae. Biol. Resur.  Vodoemov Mold., 1973;11:115-120 (in Russian).
  16. Battish, S.K. (1992).Freshwater zooplankton of India. Oxford and IBH  Publishing                       Co., New Delhi
  17. Kurbatova, S. A. (2005). Response of microcosm zooplankton to acidification. Izv. Akad. Nauk. Ser. Biol.. 1, 100-108
    CrossRef

Bio-degradation of Azo Dye Acid Orange-10 by a New Isolate of Bacillus subtilis Isolated from Soil Sample around Textile Industry in South Karnataka

$
0
0

Introduction

Synthetic dyes are important industrial coloring agents. Dyes are characterized by chromophore bunches in their compound structures and are primarily grouped as azo colors, anthraquinone colors, phthalocyanine dyes etc.1 They are used as scatter colors for polyester and reactive dyes for cotton. The absorbance spectrum of azo dyes lies in the visible region,which can be attributed to theircommon structure, consisting of at least one azo bond (- N=N-).2

Globally, 2.8×10⁵ tons of colored chemical compounds are allowed to drain into the ecological water system each year.3 Azo compounds are the most widely useddyes, on account of their simpler synthesis, concoction dependability and the decent variety of hues accessible when contrasted with normal dyes.4 They are generally utilized intextiles, leather,pharmaceutical,paper, food, makeup, and pharmaceutical industries. Analyses indicate that 10-15% of the coloring agents utilized in coloring process do not bind with the textile strands and get released into effluents.5

Discharge of the dye-containing wastes from different industrial practices into surrounding water bodies is of significant concern, and has many unfavorable consequences, including diminished aquatic photosynthesis, exhaustion of available DO and harmful impact on different life forms. These colored effluents not only cause a disagreeable appearance of water bodies, but alsorelease poisonous colorless amines by breakdown of the dyes, which aremutagenic, carcinogenic and capable of causing other health hazards.6, 7

Different research activities uncovered the utilization of physico-chemical methodology strategies for removal of dyes from the effluents.8,9 These techniques incorporate use of adsorption agents, particle pair extractions, coagulation, and chemical processes, which also posesignificant connected issues, for example, high expense and production of a lot of slime after treatment, disposal of which is cumbersome and hazardous.

Various studies available on utilization of microorganisms for dye degradation in effluents, recommend it to be an eco-friendly and economically viable technique.10, 11 The advantages of microbial/enzymatic methodology also include less slime production and hence more practical.12,13 With this backdrop, the present study was aimed at studying the effect of various physical parameters on azo dye Acid orange-10 decolorization by a new isolate of Bacillus subtilis.

Materials and Methods

Chemicals required

The Acid orange-10 dye was obtained from Shailaja textile industry, Sholapur Maharashtra, India. Dehydrated culture medium obtained from Hi-media and other chemicalsand reagents used are of analytical grade.

Acid Orange-10 Decolorizing Bacteria-Isolation, Screening and Identification

The dye decolorizing bacteria were isolated from the soil samples in and around textile industrial area in South Karnataka. 10 gm of soil sample was suspended in 100 ml of complete medium broth supplemented with Acid orange-10 (100mg/L) individually and acclimatized for 5 days at 30°C at 150 rpm. Bushnell and Haas medium (BHM) containingMgSO4-0.2, K2HPO4-1.0, CaCl2– 0.02, FeCl3-0.05, NH4NO3-1.0 (g l-1) supplemented with glucose and yeast extract (0.1% and 0.05% w/v) respectively,at pH 7.0.

The dye decolorizing bacteria were isolated on BHM agar (pH 7.0) containing Acid orange-10 (100mg/L.) from acclimatized soil sample using serial dilution. All the bacterial isolates were studied by inoculating them in complete medium broth supplemented with dye. The inoculated liquid broth medium was incubated at 30°C /37°C under shaking condition at 150 rpm for 1-5 days. The decolorization was visually observed. The isolates showing considerable decolorization of the dyes were selected for further investigation.  Morphological and biochemical tests for identification of the selected bacterial isolates were based on the Bergey’s Manual of Systematic Bacteriology.14

Decolorization Assay

The decolorized supernatant (aliquots of 2 ml each) at regular intervals of time were collected and subjected to centrifugation at 10000 rpm for 10 min to remove any cells to avoid interference with the spectroscopic measurement. The supernatant was used for spectrophotometric analysis (Shimadzu 1900) at 300-700 nm. The absorbance maximum of Acid orange10 is at 480nm (Fig.1). The efficiency of decolorization was determined using the given formula

D= [A0-A1)/A0 A1] x 100

Where,

D – Decolorization (%)

A0 – Initialabsorbance before decolorization

A1 – Final absorbance after decolorization

Vol17No4_Bio_Hem_fig1 Figure 1: UV-Visible Spectrum of Acid orange-10.

Click here to View figure

Identification of Metabolites

The culture medium after complete decolorization of Acid orange-10 was subjected to centrifugation at 10,000 rpm for 15 min. The 200 ml of the supernatant was taken after bringing pH to 7 and extracted twice with diethylether (500 ml). The extraction was repeated after adjusting the pH of the remaining aqueous layer was brought to 2, using 1N HCl. The acidic and alkaline extracts were combined and evaporated using anhydrous Na2SO4 under a reduced pressure at 30oC. Then the residue was suspended in 0.5ml of methanol and then subjected to TLC.

Thin Layer Chromatography (TLC)

TLC of extracted compounds was performed to identify the components of the decolorized medium. An aqueous slurry of silica gel- G (40% w/v) with binder was coated over a glass plate (200×100×2 mm) dimension for TLC. 10 µl each of standard Acid orange-10 dye and of the extracted fractions was loaded on the glass plate coated with silica gel.The solvent system used for developing the TLC plateconsisted of propanol: water: acetic acid (80:19:01).  The chromatogram was developed by exposing the plate to Iodine vapors. The diazotization and carbylamines test were used for the identification of metabolites.

Standardization of Various Operational and Environment Conditions

Different operational and environmental conditions were standardized, by varying only oneparameter, maintaining the other constant at a time. Following parameters were standardized and their effects were observed on decolorization of Acid orange10. Effect of temperature on decolorization was studied between 20-500C, different pH levels ranging from 4-10 at an interval of 0.5, different inoculum sizes ranging from 1-10% in 100 ml of culture media containing 30 ppm dye and different dye concentration 50-1000 mg/L and shaking rpm in the range of 50-200 rpm.

Bushnell and Haas medium as mentioned earlier was used for all the studies

Results

Isolation, Screening and Identification of Acid Orange-10 Decolorizing Bacteria

Bacterial species capable of decolorizing Acid Orange-10 were isolated from different sources using Bushnell-Hass medium containing 100 ppm dye at 37oC. The isolates efficient in decolorizing Acid orange-10 were selected through visual observation up to 72hrs of incubation. The isolate which took shortest period of 16 hrs for complete decolorization was used for further studies. A series of tests was performed according to the Bergey’s manual to identify the microorganism, the results of which are presented in Table 1. According to the results obtained in these tests, the isolate was identified as Bacillis subtilis.

Table 1: Morphological and Biochemical Characteristics shown by the new isolate of Bacillus subtilis.

Test Result
Gram’s Staining +
Shape Rod
Motility Motile
Indole Production
Methyl Red
Voges-Prausker +
Citrate utilization +
Catalase +
Oxidase

Identification of Metabolic Intermediates: 

The products of dye degradation were separated on TLC plates using solvent system propanol: water: acetic acid (80:19:01). The separated products of TLC plates when exposed to iodine vapors showed two degraded products with 0.75 and 0.56 Rf values, whereas control Rf value is 0.50 (Figure 2). Each degraded product was analyzed by diazotization and carbolamine test, both the degraded compounds with Rf values of 0.75, 0.56 gave positive results, identified and confirmed as aromatic amines.

Figure 2: TLC experiments showing the different Rf values of control dye solution and decolorized samples. Figure 2: TLC experiments showing the different Rf valuesof control dye solution and decolorized samples.

Click here to View figure

Optimization of Different Parameters for Acid orange-10 Decolorization

Effect of Incubation Time

The samples were removed at different intervals of time during incubation viz. 6, 12, 18 and 24 hrs and scanned for λmax of Acid orange-10. The results indicated a gradual disappearance of λmax peak(at 480nm) to complete disappearance in 24 hrs. These observations indicate the disappearance of the Acid orange-10dye in its original form and could be due to modification or breakdown of dye by the bacterium.

Effect of shaking

Aeration may be either favorable or inhibitive towards microbial decolorization of dyes. To study the effect of aeration on decolorization of Acid orange10, Bacillus subtilis cells were cultured in nutrient broth containing dye under static and shaking cultural conditions; while the time taken for complete decolorization at static conditions was 24 hrs, at a shaking speed of 50 rpm, it took 36 hrs for complete decolorization;  further increase in speed of shaking to 100, 150 and 200 rpm, the time taken for 100% decolorization was increased to 48 hrs, 72 hrs and 96 hrs respectively, indicating that the  decolorization process was inhibited upon increase of aeration (Figure 3).

Figure3: Effect of shaking on complete decolorization of Acid orange-10 by the new isolate of Bacillis subtilis Figure3: Effect of shaking on complete decolorization of Acid orange-10  by the new isolate of Bacillis subtilis

Click here to View figure

Effect of Temperature

The temperature between 35-450C was found to be an optimum range for the complete decolorization of Acid orange10. At 400C the complete decolorization (i.e.100%) was found with in the shortest time of 22hrs, hence 40oC could be taken as the optimum. At 200C the decolorization of Acid Orange10 was very slow and it took almost 72 hrs for 100%decolorization. At 600C the time required increased to 84hrs while above 600C complete decolorization did not occur (Figure 4).

Figure 4: Effect of temperature on complete decolorization of Acid orange-10 by the new isolate of Bacillis subtilis Figure 4: Effect of temperature on complete decolorization of Acid orange-10 by the new isolate of Bacillis subtilis

Click here to View figure

Effect of pH

The results of the present study depict that this isolate was capable of 100% decolorization of Acid orange10 at a wide range of pH i.e .6.00 to 9.50. The optimum decolorization occurred at pH 8.50 wherein 300 ppm of the dye was decolorized within 24 hours. At pH 5.5 and below and also at pH 10, 100% decolorization could not be achieved (Fig.5).

Figure 5: Effect of pH on complete decolorization of Acid orange-10 by the new isolate of Bacillis subtilis Figure 5: Effect of pH on complete decolorization of Acid orange-10 by the new isolate of Bacillis subtilis.

Click here to View figure

Effect of Dye Concentration

As the concentration of Acid orange-10 increases the time taken for the complete decolorization also increases. The bacterium decolorized 100 ppm of dye completely (i.e.100%) in 12hrs of incubation whereas 100% decolorization of 200 ppm of Acid orange-10 dye was found at 24 hrs. Further increase in dye concentration to 300, 400, 500, 600 and 700 ppm, the time required for complete decolorization of the azo dye increased to 32, 48, 56, 62 and 72hrs respectively. The isolate decolorized the Acid orange-10 completely up to a maximum concentration of 700 ppm, but the time taken was 72 hrs. A dye concentration above 700 ppm was not completely decolorized even after extended incubation period (Fig.6).

Figure 6: Effect of dye concentration on complete decolorization of Acid orange-10 by the new isolate of Bacillis subtilis Figure 6: Effect of dye concentration on complete decolorization of Acid orange-10 by the new isolate of Bacillis subtilis

Click here to View figure

Effect of Inoculum size

The study of effect of the inoculum size of the newly isolated Bacillus subtilis on the decolorization of Acid Orange-10 (300 ppm) indicated that increase in the inoculum size from 1-10% progressively, decreased the time required for the complete decolorization. The minimum inoculum size of 1% required 37hrs for 100% decolorization of Acid orange-10, and as the inoculum size increased the time taken for complete decolorization of Acid orange-10 dye was decreased from 37hrs at 1% to 17hrs at 10% of inoculum size (Fig.7).

Figure 7: Effect of inoculum size on complete decolorization of Acid orange-10 by the new isolate of Bacillis subtilis Figure 7: Effect of inoculum size on complete decolorization of Acid orange-10 by the new isolate of Bacillis subtilis

Click here to View figure

The isolate showed the characteristics of Bacillis subtillis in the assays performed for identification of the organism as shown in the Table 1. Similar kind of observations were reported by Ponraj et al.15

Decolorization and degradation of azo dyes can be either due to biosorption (adsorption on the microbial biomass) or enzymatic biodegradation. Decolorization of Acid orange10 by Bacillus subtilis in our study was not due to adsorption, because when bacterial cell mass was collected and treated with solvents methanol or chloroform, there was no release of color from the cells. Appearance of aromatic amines in the TLC of decolorized culture supernatant indicates degradation of the dye by the bacterium. Biodegradation of textile azo dyes has been suggested as the best model because of removal of practically all of the dye with minimal disadvantages presented by the physico-chemical procedures. Various studies also emphasize on the utilization of microorganisms for dye containing wastewater treatment as an eco-friendly and cost-effective technique.10, 11

Study of available literature study shows that bacterial degradation of azo dyes involves azo-reductase mediated disruption of azo bond (- N=N-) under anaerobic conditions, leading to formation of colorless, hazardous aromatic amines, which could be removed further.16, 17 Formation of colorless aromatic amines by reductive cleavage of -N=N- (azo) bond is suggested to be the initial step in bacterial degradation of dyes.

Earlier studies have reported Bacillus subtilis18, Aeromonas hydrophilia 19 and Bacillus cereus20 culture capable of degrading azo dyes. Lalnunhlimi and Krishnaswamy report a consortium of different Bacillus species fit for decolorization of direct blue 151 and 31 up to 95%.21 Presence of aromatic amines in TLC in the current study is an indication that decolorization was due to degradation of the Acid orange-10 dye into intermediate products.

Time taken by the bacterial isolatein the present study was much less than previous reports. Jothimani and Prabhakaran report that Pseudomonas and Bacillus species can remove 59% dye from industrial effluents in a period of 14 days.22 Bacterial decolorization of direct blue dye by Bacillus sp. ETL-1979, with an incubation period of 168 hr was reported by Shah et al. 23 96.4% decolorization of black WNN (100mg/L) was obtained in 48 hr by Paenibacillus alvei MTCC 10625.24 Decolorization of direct blue 151 at a concentration of 200 mg/L was reported to be 95.25% in 5 days.21

Inhibition of dye decolorization at higher speed of shaking indicates that decolorization process was inhibited in presence of higher concentration of oxygen whereas lower rpm ort static condition i.e. lower concentration of oxygen was required to enhance decolorization.The reports of current study are in concurrence with results reported by Verma and Madamwar wherein the authors have reported that under static conditions decolorization was high and under agitation, decolorization was negligable.25

Azoreductase is a cytoplasmic enzyme with low specificity, and is responsible for reduction of azo bonds in the azo dyes, degrading them to their corresponding amines. The reaction is slowed down or is inhibited by the presence of O2, since it is a strong terminal electron acceptor compared to the azo groups during the oxidation of reduced electron carriers like NADH.26,27 Under static conditions, electrons required for azo bond cleavage are readily accessible to the enzyme from NADH; while under shaking, the availability of O2 prevents the azoreductase from receiving the electrons.28,29

Kumar and Sawhney reported that Bacillus subtilis (RA 29) caused decolorization of Congo red to the extent of 95.67% at 37°C.30 Bayoumi et al., had reported maximum bacterial decolourization of Acid orange 7 and Direct blue 75occurs at an optimum incubation temperature of 35°C.31

The findings of our study with respect to the effect of pH on decolorization of acid orange-10 are in agreement with other studies in which decolorization of Methyl Red was maximal in pH range of 6-8 by a strain of Micrococcus32. Removal of Acid red 2 and Acid orange 7 by Bacillus 33 and of Acid Orange by a strain of Staphylococcus hominis was also found  to be maximum in the range of 6-8 pH.34 Bayoumi et al., reported that neutral to moderately alkaline pH enhance the removal of azo dyes.31

Karunya et al., reported that the dye concentration at 200mg/l was completely decolorized in 48 hrs by Pseudomonas aeruginosa, but beyond this, the decolorization was not effective.35

The percentage decolorization of azo dye has linear relationship with inoculum size. The results of the current study are in corroboration with the reports of Kumar et al.36 Gurulakshmi et al., reported that maximal decolorization by B.subtilis strain was achieved at 20% inoculum size.37

Conclusion

Under static condition the new isolate of Bacillus subtilis from soil sample contaminated with textile effluent could completely decolorize the Acid orange-10 mono azo dye. Optimization of various parameters like temperature, pH, inoculum size, aeration and incubation period were done to enhance the decolorization process of Acid orange-10. The currentlyisolated Bacillus subtilis could efficiently decolorize the dye even at higher concentrations up to 700 ppm. Hence the new isolate of the microorganism Bacillus subtilis is found to be potential candidate for Acid orange-10 azo dye decolorization in textile effluents. Further studies can help to successfully employ this bacterium for treating the textile effluents before they are released into the surroundings.

Acknowledgement

The authors’acknowledge the support of all people who have helped to carry out this research work. We also thank Maharani’s Science College for Women, palace Road, Bangalore, for providing infrastructure.

Funding source

This is a self-funded research work.

Conflict of Interest

The authors declare no conflict of interest.

References

  1. Singh P, Iyengar L and Pandey A. Bacterial decolorization and degradation of azo dyes. In: Singh, S.N., (ed.) Microbial Degradation of Xenobiotics. Springer, Heidelberg Dordrecht London New York, 2012; pp.101-131.
    CrossRef
  2. Chang JS, Chou C, Lin YC, Lin PJ, Ho JY, Hu TL. Kinetic characteristics of bacterial azo-dye decolorization by Pseudomonas luteola. Water Research. 2001;35(12):2841-50.
    CrossRef
  3. Jin XC, Liu GQ, Xu ZH, Tao WY. Decolorization of a dye industry effluent by Aspergillus fumigatus Applied Microbiology and Biotechnology. 2007;74(1):239-43.
    CrossRef
  4. Chang JS, Chen BY, Lin YS. Stimulation of bacterial decolorization of an azo dye by extracellular metabolites from Escherichia coli strain NO3. Bioresource Technology. 2004;91(3):243-8.
    CrossRef
  5. Asad S, Amoozegar MA, Pourbabaee A, Sarbolouki MN, Dastgheib SM. Decolorization of textile azo dyes by newly isolated halophilic and halotolerant bacteria. Bioresource Technology. 2007;98(11):2082-8.
    CrossRef
  6. Mugdha A, Usha M. Enzymatic treatment of wastewater containing dyestuffs using different delivery systems. Sci Rev Chem Commun. 2012;2(1):31-40.
  7. Xu M, Guo J, Cen Y, Zhong X, Cao W, Sun G. Shewanelladecolorationis sp. nov., a dye-decolorizing bacterium isolated from activated sludge of a waste-water treatment plant. J. Systematic and Evolutionary Microbiology. 2005;55(1):363-8.
    CrossRef
  8. Golob V, Vinder A, Simonič M. Efficiency of the coagulation/flocculation method for the treatment of dyebath effluents. Dyes and Pigments. 2005;67(2):93-7.
    CrossRef
  9. López-Grimau V, Gutierrez MC. Decolorization of simulated reactive dyebath effluents by electrochemical oxidation assisted by UV light. Chemosphere. 2006;62(1):106-12.
    CrossRef
  10. Vitor V, Corso CR. Decolorization of textile dye by Candida albicans isolated from industrial effluents. Industrial Microbiology &Biotechnology. 2008;35(11):1353-7.
    CrossRef
  11. Pajot HF, Delgado OD, de Figueroa LI, Farina JI. Unraveling the decolorizing ability of yeast isolates from dye-polluted and virgin environments: an ecological and taxonomical overview. Antonie van Leeuwenhoek. 2011;99(3):443-56.
    CrossRef
  12. Singh S, Chatterji S, Nandini PT, Prasad AS, Rao KV. Biodegradation of azo dye Direct Orange 16 by Micrococcusluteus strain Inter. J of Environmental Science and Technology. 2015; 12(7):2161-8.
    CrossRef
  13. Sari IP and Simarani K. Decorization of selected azo dye by Lysinibacillus fusiformis W1B6: Biodegradation optimization, isotherm, and kinetic study biosorption mechanism. Adsorption Science and Technology.2019; 37(5-6):492-508.
    CrossRef
  14. Sneha J, Gomashe AV, Sonal A. Decolorization potential of Bacillus sp. for removal of synthetic textile dyes. J of Current Microbiology and Applied Sciences. 2014; 3(12):83-8.
  15. Ponraj M, Gokila K, Zambare V. Bacterial decolorization of textile dye-Orange 3R. J Advanced Biotechnology and Research. 2011; 2(1):168-77.
  16. Van der Zee FP, Villaverde S. Combined anaerobic–aerobic treatment of azo dyes—a short review of bioreactor studies. Water Research. 2005; 39(8):1425-40.
    CrossRef
  17. Joshi T, Iyengar L, Singh K, Garg S. Isolation, identification and application of novel bacterial consortium TJ-1 for the decolorization of structurally different azo dyes. Bioresource Technology. 2008; 99(15):7115-21.
    CrossRef
  18. Horitsu H, Takada M, Idaka E, Tomoyeda M, Ogawa T. Degradation of p-Aminoazobenzene by Bacillus subtilis. Eur J Applied Microbiology and Biotechnology. 1977; 4(3):217-24.
    CrossRef
  19. Idaka E, Ogawa T, Horitsu H, Tomoyeda M. Degradation of azo compounds by Aeromonas hydrophila var. 24B. J the Society of Dyers and Colorists. 1978; 94(3):91-4.
    CrossRef
  20. Wuhrmann K, Mechsner KL, Kappeler TH. Investigation on rate—Determining factors in the microbial reduction of azo dyes. Eur J Applied Microbiology and Biotechnology. 1980; 9(4):325-38.
    CrossRef
  21. Lalnunhlimi S, Krishnaswamy V. Decolorization of azo dyes (Direct Blue 151 and Direct Red 31) by moderately alkaliphilic bacterial consortium. Brazilian JMicrobiology. 2016; 47(1):39-46.
    CrossRef
  22. Jothimani P, Prabakaran J. Influence of bacterial system on the decolorization of dye effluent under enrichment techniques. In State Level Seminar in Recent Developments in Applied Microbiology, Tamil Nadu Agricultural University. Coimbatore, pp-25-26 1998.
  23. Sha MP, Patel KA, Nair SS, Darji AM. An application of response surface methodology in microbial degradation of azo dye by Bacillus subtillis ETL-1979. Am J Microbiol Res. 2014; 2:24-34.
    CrossRef
  24. Pokharia A, Ahluwalia SS. Decolorization of Xenobiotic Azo Dye-Black WNN by Immobilized Paenibacillus alvei MTCC 10625. Int J Environ BioremedBiodegrad. 2016; 4:35-46.
  25. Verma P, Madamwar D. Decolourization of synthetic dyes by a newly isolated strain of Serratia marcescens. World J Microbiology and Biotechnology. 2003; 19(6):615-8.
    CrossRef
  26. Chang JS, Lin YC. Fed-batch bioreactor strategies for microbial decolorization of azo dye using a Pseudomonas luteola strain. Biotechnol Progress. 2000; 16:979–85.
    CrossRef
  27. Misal SA, Gawai KR. Azoreductase: a key player of xenobiotic metabolism. Bioprocess. 2018. 5:17.
    CrossRef
  28. Stolz A. Basic and applied aspects in the microbial degradation of azo dyes. Appl Microbiol Biotechnol. 2001; 56:69–80.
    CrossRef
  29. Mahmood S, Khalid A, Arshad MG, Mahmood T and Crowley DE. Detoxification of azo dyes by bacterial oxidoreductase enzymes. Critical Reviews in Biotechnology. 2015; 36(4): 1-13.
    CrossRef
  30. Kumar A, Sawhney R. Identification of Bacillus subtilis subsp. subtilis “RA-29”, a congo red decolorizer using 16S rDNA sequencing. Researcher. 2011; 3:18-22.
  31. Bayoumi RA, Musa SM, Bahobil AS, Louboudy SS, El-Sakawey TA. Bio decolorization and biodegradation of azo dyes by some bacterial isolates. J Appl Environ Biol Sci. 2010; 1(1):1-25.
  32. Olukanni DO, Osuntoki AA, Gbenle GO. Decolourization of azo dyes by a strain of Micrococcus isolated from a refuse dump soil. Biotechnology. 2009; 8(4):442-8.
    CrossRef
  33. Sneha SJ, Gomashe AV. Bioremediation of textile azo dyes by newly isolated Bacillus sp. from dye contaminated soil. International Journal of Biotechnology and Biochemistry. 2017; 13(2):147-153.
  34. Singh RP, Singh PK, Singh RL. Bacterial decolorization of textile azo dye acid orange by Staphylococcus hominis Toxicology Int. 2014; 21(2):160.
    CrossRef
  35. Karunya A, Rose C. Studies on degradation of textile azo dye, Mordant Black 17 using Pseudomonas aeruginosa SUB 7, isolated from textile effluent. Int J Applied Bioengineering. 2013; 7(1).
    CrossRef
  36. Kumar K, Dastidar MG, Sreekrishnan TR. Effect of process parameters on aerobic decolorization of reactive azo dye using mixed culture. World Acad SciEng Technol. 2009; 58:952-5.
  37. Gurulakshmi M, Sudarmani DN, Venba R. Biodegradation of leather acid dye by Bacillus subtilis.Adv Biotech. 2008; 7:12-9.

Molecular Fingerprinting of Indian Medicinal Tree Sara Asoca using RAPD Markers

$
0
0

Introduction

Molecular fingerprinting technique has been applied enormously for characterization of various medicinal plants, crops as well as tree species (Tripathi et al. 2018). In contrast to morphological markers, DNA based markers are not depends on environmental changes. For proper credentialsof closely related botanicals, it is important to use molecular markers. Saraca asoca (Roxb.) De Wilde, (Family: Caesalpiniaceae) is an important medicinal tree facing a serious problem of reduction from its instinctivetenancy in India. It is now categorized as ‘vulnerable’ and considered ‘red listed’ by the International Union for Conservation of Nature (IUCN) (Senapati et al. 2012; Mohan et al. 2017). In terms of remedial significance of S. asoca, diverse plant parts (seeds, leaves, bark and flowers) have been found better and are in use for the development of different formulations (Hegde et al. 2017).

Among all molecular markers Random amplified polymorphic DNA (RAPD) has been found to bewell-situated in concert which does not necessitate any former information of DNA targeted for the investigation. The RAPDs have proved their significance for inherent multiplicity estimation in various plant species (Tripathi et al. 2013, Khare et al. 2013). Before formulation of conservation strategies for geographical protection of S. asoca genotypes available in India, it is necessary to characterize them. Molecular characterization of S. asoca genotypes have not been performed in at big level in India. So, the current study demonstrates the effective application of RAPD markers for rapid cataloging of fifteen S. asoca genotypes collected from diverse parts of India.

Materials and methods

Plant material

Young leaves of the collected S. asoca genotypes were taken for genomic DNA extraction. An inclusive detail of collected samples with their collection sites listed (Table 1).

Table 1: Details of collection site of Saracaasoca genotypes.

S. no. Place of collection State Latitude Longitude
1 Kodaikanal-1 SA1 Tamil Nadu  10° 15′ N
2 Kodaikanal-2 SA2 Tamil Nadu  10° 15′ N
3 Melpallum SA3 Tamil Nadu  10° 20′ N
4 Palani SA4 Tamil Nadu  10° 26′ N
5 Satyamagalum-1 SA5 Tamil Nadu  11° 29′ N
6 Satyamagalum-2 SA6 Tamil Nadu  11° 29′ N
7 Satyamagalum-3 SA7 Tamil Nadu  11° 29′ N
8 Satyamagalum-4 SA8 Tamil Nadu  11° 29′ N
9 Munnar road forest area-1 SA9 Kerala 10° 11′ N
10 Munnar road forest area-2 SA10 Kerala 10° 11′ N
11 Gopal swami hill SA11 Karnataka 11°12  N
12 Borivali forest area SA12 Maharashtra 19 ° 14′ N
13 Vasco SA13 Goa 15 ° 24′ N
14 Veterinary College, Jabalpur SA14 Madhya Pradesh 23 ° 06′ N
15 Gwarighat, Jabalpur SA15 Madhya Pradesh 23 ° 06′ N

Methods

Genomic DNA was extracted following the steps involved in CTAB method (Doyle and Doyle, 1990). Extracted DNA was purified with RNase treatment. 1X TE buffer was used to dissolve the dried pellet. Dissolved DNA samples were stored at -20 ºC for further use. DNA was quantitatively estimated by UV-spectrophotometer at 260 nm. Decamer (RAPD) primers (Table 2) were used to standardize PCR conditions. DNA templates were amplified with thermal cycler in a total reaction of 20 µl contained template DNA (50 ng), MgCl2 (50 mM), primer (0.4mM), each dNTP (2 mM) and Taq Polymerase (1U) following initial denaturation (5 min at 94 ºC) at first step, followed by denaturation (1 min at 94 ºC), annealing (1 min at 37 ºC) and extension (2 min at 72 ºC) in second step of 45 cycles. In third step final extension (10 min at 72 ºC) was performed. Amplicons were electrophoresed on 1.5% agarose gel in TAE buffer and images were captured under gel documentation system.

Table 2: Sequences of RAPD Primers used in the Study.

S. Primer 5’-3’ Sequence GC content Total Bands Polymorphic Bands Percentage

Polymorphism

1. OPA-5 AGGGGTCTTG 60% 8 3 37.50
2. OPA-8 GTGACGTAGG 60% 6 4 66.60
3. OPC-10 TGTCTGGGTG 60% 6 5 83.30
4. OPC-15 GACGGATCAG 60% 5 4 80.00
5. OPAP-07 ACCACCCGCT 70% 5 3 60.00
6. OPAP-13 TGAAGCCCCT 60% 7 5 71.42
7. OPR-15 GGACAACGAG 60% 6 5 83.30
8. OPM 05 GGGAACGTGT 60% 7 4 57.10
9. OPM-06 CTGGGCAACT 60% 7 5 71.42
10. OPM 13 GGTGGTCAAG 60% 6 5 83.30
11. OPO-20 ACACACGCTG 60% 6 5 83.30
12. OPB-18 CCACAGCAGT 60% 5 4 80.00
13. OPE-06 AAGACCCCTC 60% 4 4 100.0
14. OPE-15 ACGCACAACC 60% 3 2 66.60
15. RUF 202 TTGGCGGCCT 70% 4 3 75.00
16. RUF 205 TGGGTCCCTC 70% 3 2 66.60
17. RUF 207 CAGGCCCTTC 70% 6 5 83.30
18. RUF 210 TGCCGAGCTG 70% 5 4 80.00
19. RUF 211 GGGTAACGCC 70% 5 1 20.00
20. RUF 215 GCTGCGTGAC 70% 6 2 66.60
21. RUF 216 CAGCGAACTA 50% 7 2 28.57
22. RUF 217 CGACTCACAG 60% 5 4 80.00
23. RUF 218 GGGCCTCTAT 60% 5 4 80.00
24. RUF 219 CTAGAGGTCC 60% 6 4 66.6.
25. RUF 220 GGGTGAACCG 70% 6 3 50.00
26. OPO-03 TCCGATGCTG’ 60% 7 5 71.42
Total 146 97 66.44
Average 5.61 3.73

Data analysis

Amplified bands were scored according to their absence ‘0′ or presence ‘1′. The clustering of genotypes was performed on the basis of Jaccard’s similarity coefficient. The dendrogram was constructed by using the UPGMA cluster analysis with help of software NTSYS-pc ver. 2.0 (Rohlf, 2000).

Results and Discussion

Assessment of inherent dissimilarity is very of the essence for the continuance of plant genetic resources in their native territory (Khare et al. 2013). An Initial experiment on the amplification suitability of genomic DNA samples of four S. asoca was done with 35 RAPD primers. Among them only twenty six primers (Table 2) proved their efficiency of the amplification ofconsistentsharp bands.These efficient markers were further used for the amplification of DNA of all studied genotypes. Banding pattern of OPA-05 primer is illustrated in fig. 1. During the present study, total 146 bands were amplified and out of these 97 bands were found to be polymorphic and 49 bands were monomorphic. The average numbers of total band was 5.61 while average numbers of polymorphic bands was 3.73. The number of bands produced per primer ranged from 3 (OPE-15) to 8 (RUF205). Among all studied markers the highest percentage (100%) of polymorphism was demonstrated by only one marker (OPE-06). However rest of the markers had less polymorphism comparatively. The lowest percent of polymorphism (20%) was demonstrated by marker RUF211. The average percentage of polymorphism was 66.44%.

Figure 1: Electrophoretic banding pattern of RAPD marker OPA-05 amplified with 15 S. asoca genotypes Figure 1: Electrophoretic banding pattern of RAPD  marker OPA-05 amplified with 15 S. asoca genotypes

Click here to View figure

Cluster analysis was performed on the basis of Jaccard’s similarity co-efficient generated from RAPD fingerprinting. The clusteranalysis grouped all the S. asoca genotypes under study into two groups i.e. group A and group B (Fig. 2). Group A is a minor cluster consisting only twoS. asoca genotypes namely SA-9 and SA-10. Both of these genotypes were collected from Munnar road forest area, Kerala. Genotypes SA-9 and SA-10 showed higher similarity and group together.

Figure: 2 Dendrogram based on RAPD data representing genetic similarity among 15 S. asoca genotypes Figure: 2 Dendrogram based on RAPD data representing genetic similarity among 15 S. asoca genotypes

Click here to View figure

Group B is a major cluster consisting 13 genotypes. Group B was further divided into two sub groups C and D. Sub group C consisted 11 genotypes namely SA-11, SA-4, SA-1, SA-2, SA-3, SA-6, SA-8, SA-7, SA-5, SA-12 and SA-13. Among these eleven genotypes, SA-5 and SA-7 had maximum similarity however SA-13 showed highest genetic divergence from other ten genotypes of sub group C. This genotype was collected from Goa. Eight genotypes collected from different locations of Tamil Nadu state and one genotype from Karnataka, one from Maharashtra and one from Goa are also present in this sub group.The clustering of genotypes in sub group D demonstrated higher similarity among the genotypes collected from Tamil Nadu. However, the genotypes collected from Maharashtra, Goa and Karnataka showed genetic distance from Tamil Nadu genotypes and were clustered distantly. Further, sub group D had only two genotypes coded as SA-14 and SA-15. Both of these genotypes were collected from Jabalpur district of Madhya Pradesh. Geographically, secluded genotypes are tending to build up genetic variability throughout the way of ecological adjustments. The current study is an effort to ascertain the inherent multiplicity backdrop in S. asoca with the use of RAPD markers. Moderate levels of polymorphism observed in the current examination divulge that RAPD technique proved its suitabilityfor fingerprinting studies. The results obtained under this study will lay concrete on the wayfor comprehensiveexploration to recognize all the facets of thisdiscrepancy. RAPD technique has been used extensively for thedetection of diversity among and between medicinal plants (Tripathi et al.2012; Pagare et al. 2017).

Among all DNA fingerprinting techniques RAPDmarker technique is one of the easiest and cheaperthan other techniques available. Because, RAPD markers are decamer and produce multiple bands targeting multi locus in the genome of objective genotype (Khare et al. 2013). The current study demonstrates the suitability of RAPD markers for genetic diversity analysis at DNA level. This particular technique has been employed all the time more formolecular characterization studies in different plant species (Tripathi et al. 2013) and it provides helpful figures on assortment all the way through their aptitude to perceive variations at the DNA level.

Acknowledgement

Author is very thankful to Scientist Dr. S.K. Tiwari Branch Head Forest Genetics, Plant Propagation and Biotechnology who provided all lab facility and time to time he gave me his valuable scientific advised and helped me get results of better quality. I would like to express my special thanks of gratitude to my dear Director, State Forest Research Institute Dr. G. Krishnamurthy who supported encouraging my research work and give new innovative ideas in scientific manner. I also thankful to Dr. Dharmendra Verma who permitted as much as research works had done by me. I can use it in my Ph.D degree. We also thankful to AKS University Department of Biotechnology who give research platform.

Conflict of Interest

Authors have declared no conflicts of interests.

Funding source

The fund given by the National Medicinal Plant Board New Delhi, India to State Forest Research Institute, Jabalpur of this research work

References

  1. Tripathi N, Shrivastava D, Mir B. A, Kumar S, Govil S, Vahedi M and Bisen P. S. Metabolomic and biotechnological approaches to determine therapeutic potential of Withaniasomnifera(L.) Dunal: A review. , 2018; 50:127-136.
    CrossRef
  2. Senapati S. K, Das G. K, Aparajita S and Rout G. R. Assessment of geneticvariability in the Asoka Tree of India. Biodivers., 2012, 13(1), 16–23.
    CrossRef
  3. Mohan C, Reddy M. S, Naresh B, Kumar S. M, Fatima S, Manzelat B and Cherku, P. D. RAPD studies of Saraca asoca by fluorescent-labeled primers and development of micropropagation protocol for its conservation. Int. J. Appl. Agri. Res., 2017; 12(2): 137–151.
  4. Hegde S, Hegde H. V, Jalalpure S. S, Peram M. R, Pai S. R and Roy S. Resolving identification issues of Saraca asoca from its adulterant andcommercial samples using phytochemical markers. Pharmacog. Magaz., (2017); 13(Suppl. 2) S266.
    CrossRef
  5. Tripathi N, Saini N and Tiwari S. Morphological and molecular characterization of endangered medicinal plant species Coleus forskohlii collected from central India. J. Crop Sci. Biotechnol., 2013; 16(4): 253- 261.
    CrossRef
  6. Khare D, Bisen A, Nair P and Tripathi N. Genetic diversity in soybean germplasm identified by RAPD markers. Asia Pac. J. Mo. Biol. Biotechnol., 2013; 21: 121-123.
  7. Doyle J. J and Doyle J. L. Isolation of plant DNA from fresh tissue. Focus, 1990; 12, 3-15.
  8. Rohlf F. J. NTSYS-pc: numerical taxonomy system ver.2.1.Exeter Publishing Ltd, Setauket. 2002.
  9. Tripathi N, Saini N, Kumar S and Tiwari S. Assessment of Genetic Diversity among WithaniasomniferaCollected from Central India using RAPD and ISSR Analysis. J. Med. Arom. Plant Sci. Biotechnol., 2012; 6(1): 133-139
  10. Pagare S, Mishra R. P, Tripathi N, Rathore M and Kumar B. Assessment of genetic diversity among different biotypes of Physalis minima. Indian J. Weed Sci., 2017; 48(4): 417-420.
    CrossRef

Molecular Epidemiology of Hepatitis B Virus (HBV) Genotypes Prevalent in KP

$
0
0

Introduction

Hepatitis B virus (HBV) infection remains a critical health problem with significant rate of morbidity and mortality all over the world. Approximately 2 billion people have been infected with the virus and among them more than 350 million people are chronically infected (Schweitzer et al., 2015). Cirrhosis and hepatocellular carcinoma (HCC) are the major complications ascendsdue to HBV causes 1 to 2 million fatalities annually  and is the 10th leading cause of mortality around the globe(Yoo et al., 2018; Rehermann et al., 2005). Nine million people of Pakistan are infected with HBV and 0.27 million of population are believed to be chronically carriers with an overall prevalence rate of 5% in general population and around 20% in population at high risk (Mehr et al., 2012; Khan et al., 2018). In Khyber Pakhtunkhwa (KP) hepatitis B is considered as one of the top risk of liver infections with an average prevalence rate of 2.70% (Khan et al., 2018).

Hepatitis B virus was first identified in 1965 and after thorough research its molecular virology is currently quiet clear and well-understood. It belongs to family Hepadnaviridaeand possess a partially circular double stranded DNA genome of 3.2 kb in length, that composed of four major open reading frames (ORF) encoding the envelope (preS1, S2 and HBsAg), polymerase and X  proteins, respectively (Magnius et al., 1997; Stuyver et al., 2000). On the basis of genetic differencesHBV has been ordered into 10 different genotypes (A-J)established on the sequence variance of more than 8% on whole genome) and 40 different sub genotypes (> 4% of sequence divergence) (Pourkarim et al., 2014). These genotypes have distinct geographical distribution as genotype A is scattered worldwide and is the major genotype mostly found in Europe, Africa, America and India. Genotype B and C are prevalent in East and Southeast of Asia (Mahtab et al., 2008). Genotype D has been reported globally and mostly found in Middle East and Mediterranean countries while genotype E exists in western-sub-Saharan Africa (Mulders et al., 2004; Kramvis et al., 2005). Genotype F frequentlysurvives in America and Polynesia and genotype G is linked to North America and Europe while the most recently accepted HBV genotype H has been listed from US (Mexico) (Kramvis et al., 2005). A freshlyappeared genotype I has been recommended by scientists to define as a rare strain that was commenced from Hanoi,  Loas and Northern Vietnam and recently has been reported from northwest areas of China and northeast region of India (Huy et al., 2008) and J from Japan has been reported (Kao., 2011; Tanwar and Dusheiko., 2012). As HBV genotypes have a crucial role in progression of hepatic disease, transmission routes, treatment efficacy and clinical outcome (Tanwar and Dusheiko., 2012; Tanaka and Mizakomi 2007) so identification of specific HBV genotype and gaining information regarding divergence of HBV sequences will be quiet useful in improving the clinical practices, diagnosis and results.

Khyber Pakhtunkhwa (KP) is located in the Northwest of Pakistan and is the third most populous province of Pakistan. A recent report showed that KP has a high prevalence rate 3% of HBV infection with a 30.25 million of population and has more than 10 million of chronic HBV carriers (Khan et al., 2018). Despite of such a threatening situation, HBV genotypes and its genome sequences have not been sufficiently evaluated in KP and only scanty data is available. So the current study was planned with the aimto examine the existing patterns of HBV genotypes and its genetic variations among chronically HBV infected patients from KP province of Pakistan.

Methods

Sample Collection

A total of 3000 blood samples were collected from chronically HBV positive patients. The research plan was approved by ethical board of Abdul Wali Khan University Mardan (AWKUM) and informed consensuses were acquired during the sampling from the patients or their caretakers. Blood samples were collected from the chronically positive patients admitted at different healthcare units including Khyber Teaching Hospital Peshawar (KTH),Lady Reading Hospital Peshawar (LRH), Hayatabad Medical Complex (HMC), Mardan Medical Complex (MMC), Federal Genomics lab Islamabad, Biotech labs Rawalpindi in the study area. 5ml of blood was collected from chronically HBV positive patients in a sterile syringe and serum was extracted and stored at -20 until extraction of DNA was performed.

Immunochromatography (ICT)

All serum samples were firstly analyzed for the presence of anti-HBsAg by immuno chromatography (Abbott Laboratories, USA).

DNA extraction

DNA was extracted by using promegaMaxwell® HT Viral Total Nucleic Acid Kit, Custom (Cat# AX2340) from each sampleaccording to the manufacturer’s protocol.

Qualitative Screening of HBV DNA and type specific PCR

For detection of active HBV infection all samples including in the study were analyzed through qualitative PCR for confirmation. Viral qualitative detection was performed by carrying out two step PCR reactions as described earlier (Norder et al., 2004) which is sensitive as well as accurate practice as compared to other serological methods. Positive and negative controls were used for performing each PCR reaction.

HBV Genotyping

All samples were processed either through Type specific PCR or RFLP to distinguish different strains of HBV genotypes. Type specific PCR was done for the screening of HBV genotypes A-H as previously reported(Farazmandfar et al., 2012). In case of RFLP based genotyping process two enzymes AfaI (gt/ac) andHinfI (g/antc) were confirmed to distinguish between all 4 major HBV genotypes. Nucleotide sequences of HBV genotypes A-D were retrieved from online databases of DNA (NCBI / Gene Bank/ DDBJ/). By using primer3 tool available online two sets of primers were designed and their cross complementarity was checked. A highly conserved region of S gene was targeted for primers designing. Acomparatively larger 320bp fragment of viral genome was amplified by first set of primer while a smaller fragment of 230bp was amplified by second set of primer.

Restriction digestion of confirmed HBV PCR products was carried out to identify the HBV genotypes using RFLPs of S-Gene. The choice ofsuitable restriction enzyme was achieved by using NEB cutter toolthat is accessible online and restriction digestion by using nebcloner tool. 100μl of DNA was added with 1/10μl of 5M NaCl and double volume of ethanol and kept for half an hour on ice and then centrifuged at 14000 rpm for 10 min and supernatant was detached. Pellet was washed by using 70% ethanol and re-dissolved in 15μl of nuclease free water and kept at 4°C up till used. Restriction digestion of HBV amplified product was done by using two restriction enzymes Hinf1 & Afa1. Reaction mixture up to 30μl was set in a PCR tube containing amplified PCR product of 10μl, Res. Enzymes (10 U/μl) 1μl, reaction buffer 5μl, Nuclease free water 14μl and incubated at 37°C for 4 hrs. PCR-RFLP products pre-stained with ethedium bromide were run on 4 % agarose gel and the restriction fragments were observed under ultraviolet light.

Amplification of HBV S gene

100 geographically representative samples were selected randomly in our study for sequencing. Amplification of pre-S1 region of HBV genome and pre-S2 region was performed by hemi nested PCR (Operating BioER XP Cycler, China) reaction by using two sense primers(HBVS1, HBVS3) and antisense primer (HBVS2) including the whole region of S gene correspondingly, with 658bp expected amplicon size (Naito et al., 2001).

Purification of PCR product and sequencing

PCR products obtained through second round PCR were purified by PCR Purification Mini Kit (WizPrep™Gel) according to manufacturer’s protocol. Finally amplified PCR products were exposed to direct sequencing by an automated genetic analyzer ABI PRISM 3130.

Evaluation of sequence similarity

All the curetted sequences achieved were aligned so as to determine their similarities and consensus sequences were derived. In 100 a total of 28sequences of HBV signifying the entire genetic variation of the strains in different areas of KP were gaged for sequence similarity by means ofCLC Main workbench. Alignment of whole S gene sequences was carried out by means of NCBI nblast tool to validate the genetic resemblance of our selected sequences of HBV (query)with the already stated (subject) sequences.

Aminoacids/Polypeptides and peptide BLAST 

Translation of entire nucleotides sequences into amino acids sequenceswas carried out through online available software EMBOSS Transeq and the sequences were saved in FASTA format. All the obtained peptide sequences were blast by using NCBI-Pblast which showsmaches with several reported and selected sequences of Hepatitis B Virus.

Phylogenetic Analysis

HBV S gene sequences reported from different parts of the world were obtained and retrieved from online available repositories and were used for building of phylogenetic tree by using MEGA 6 tool(Saitou and Nei 1987).

Statistical Analysis

Statistical analysis of the data was done by using SPSS 20.0.

Results

Over all 2850 samples were detected positive for HBsAg by ICT and HBV DNA was detected among all the 3000 active HBV positive patients’ through qualitative PCR. Out of total 3000 patients, 56.3% were male and 43.7% were female of age ranges between 10-85 years. All positive samples were further subjected to diagnostic type specific PCR and RFLP procedure to recognize different types of HBV genotypes mingling in KP. Three genotypes of HBV were successfully confirmed in our study with the most prevalent genotype was D (68.83%) followed by genotype A and C, (22.63%, 8.53%). For confirmation of HBV geno types a total of 100 geographically representative samples were selected randomly for S gene amplification and sequencing. All the HBV strains sequenced in ongoing study along with reference sequences reported from 12 different countries of the world were retrieved from online DNA repositories and were used for further analysis. Only 28 geographically representative and genetically distinct sequences were considered for phylogenetic analysis. Phylogenetic data directed that some of the HBV isolates KP2 and KP3 were strictly linked to earlierstated Pakistani isolates NCVI-JN1321132.1 and NCVI-JN132120.1 while KP4, KP5, KP6 and KP25 grouped with some other Pakistani previously reported HBV isolate EF584653.1 also havinghigh bootstrap value. While HBV KP26 and KP28 clustered together with HBV isolates of Hungary, Canada, Argentina and Syria in a separate clad (Fig. 1). In the same way, one more HBV isolate KP27 did not cluster with Pakistani or any other foreign HBV isolates showing a very rare and distinct origin of the strain. As a whole, the phylogenetic data obtained indicates towards a great deal of diversity with some closer to the previously reported local isolates while others are genetically distinct among the HBV isolates sequenced in this study.

Figure 1: Phylogenetic tree of the partial S gene HBV KP isolates established by Maximum Likelihood algorithm with Bootstrap values displayed on the branches(MEGA 6.1 Software) Figure 1: Phylogenetic tree of the partial S gene HBV KP isolates established by Maximum Likelihood algorithm with Bootstrap values displayed on the branches(MEGA 6.1 Software)

Click here to View figure

All 28S gene nucleotide sequences were translated into their respective polypeptide and were blast. Several protein displaymatches with other peptides of HBV stated from foreign countries. All the S protein sequences of HBV were aligned and matched along with a reference local Pakistani HBV isolate named NCVI- JN132120.1. Firstly, the amino acid sequences alignment indicated that some of the strains were strictlyassociated to the reference sequence while some other HBV strains HBV KP7, KP26, KP27 and KP28 revealed a greater and wide range diversity with respect of its reference sequence.  An insertion mutation ‘I’ was not found in any of the KP isolates at position no 3, though a number of other mutations were seen in the isolates.

Discussion

HBV is one of the major health threats across the globeespecially in emerging countries as well asin Pakistan. Asdifferent strains of HBV genotypes have different impact on progression and development of liver disease, transmission routes, treatment response and clinical outcome including cirrhosis and hepatocellular carcinoma (HCC)thus accurate information regarding specific HBV genotypes is needed to tackle these problems ( Kao, 2002). Distribution of HBV genotypes varies accordingly different regions and geographical conditions so their epidemiological features need to be explored frequently thus to monitor control strategies of the disease and to figure out the transmission and dissemination patterns of the virus. So far HBV has been categorized into 10 different genotypes (A-J) that are distributed worldwide (Cao et al., 2009) and identification of specific genotype is important to explain the route and pathogenicity of the strain. Currently quite a lot oftechniques have been practiced for the detection of HBV genotypes comprising direct sequencing, PCR with type specific primers, RFLP, enzyme linked immunoassay and line probe assay among them sequencing even still considered as the ideal and role model method, but it is costly as compared to other methods (Naito et al., 2001; Grandjacques et al., 2000; Usada et al., 1999). Presently PCR with genotype specific primers and RFLP are most widely used for the detection of HBV genotypes as both are simple, inexpensive and highly sensitive methods.

In thisstudy we have successfully processed and genotype all positive HBV samples obtained from patients by performing genotype specific PCR and RFLP, with genotype D 68.83% found as the most predominant followed by HBV genotype A 22.63% which is typically occurs in South Asia, Europe and America (McMahon, 2009). The sameprevailing pattern of HBV genotypes were found in comparison with already reported studies from Pakistan (Noorali et al., 2008; Aalam et al., 2007; Baig et al., 2008; Abbas et al., 2006) except a single studyperformed by Idrees and Riazudin (2004) at Lahore that showing genotype A as the most prevailing genotype in Sindh and and genotype C in Punjab and KP as the most abundant and genotype of HBV. In a survey done by Baig et al., 2008, also stated that Genotype D is the most repeatedly type found 64% followed by A in 23% (Baig et al., 2008). Very similar and matching results were also presented by Hanif et al., 2013, that reported genotype D as the leading 58%  followed by combinationof two genotypes A and D 31% and genotype A was only 10% recorded.  In our present study the least circulating genotype observed was genotype C 8.53% that is in contrast with a study reported by Awan et al., 2010 in which they claimed HBV genotype C as the most prevalent genotype in our country(Awan et al., 2010). In south East Asia, the most prevalent genotypes are B and C, this is may be due to that majority of studies were reported from China and Japan where two genotypes of HBV, B and C are the most occurring genotypes (Chan et al., 2003)but from India three mixed strains of HBV (A, C and D) have been reported by scientists(Kumar et al., 2005). HBV genotype C is generally occurs in China and India whereas HBV genotype D is prevailing in Iran, Afghanistan and India which are alsoPakistan neighbor‘s countries(Norder et al., 2004; Khan et al., 2008). In our study 3 genotypes of HBV A, C, and D were confirmed while other five genotypes of HBV B, E, F, G and H were not showed in any sample revealing absence of these strains in this region of sub-continents.

Characterization of sequences possess crucial role in classifying the genome and distinguish different strains of HBV from one another mainly based on nucleotide substitutions, deletions or insertions. Such information is important in investigating the viral ancestries, patterns distribution and is also beneficial in controlling of disease in the better way. This is the very first in-depthdetailed study that revealing the genotypic and evolutionary analysis of the most frequently occur HBV strains based onS gene region of HBV genome in KP and also its comparison with other foreign isolates reported from different parts of the world.In this study the most prevalent genotype confirmed was D followed by genotype A and C. Earlier, numerous studies have been conducted which described that genotype D is the most prevalent genotype surviving in Pakistani population (Abbas et al., 2006, Alam et al., 2007b, Baig, 2009). Baig et al 2009 also reported the existing of sub genotypes D1 and D2 of HBV genotype D in Karachi based on phylogenetic analysis of pre S gene. This pattern of prevalence is in line with the studies conducted in countries especially sharing the border line with Pakistan including Afghanistan, India and Iran. A quiet similar distribution of HBV genotype D (62.5%) and A (8.9%) to the one in our study was found by Alam et al 2007 (Alam et al., 2007b). Whereas a study conducted by Awan et al 2010, claimed that HBV genotype C is the most abundant type of HBV prevalent in KPK that is 38.8%. It has been clarify by phylogenetic analysis that some of our isolates clustered closer to previously reported Pakistani HBV isolates specifying the presence of alike patterns of strains in other provinces of Pakistan (fig.1). Yet, two isolates of HBV clustered together closely with HBV isolates of Hungary, Canada, Syria and Argentina in a separate clad showing close similarity with them. Also, another isolate KP27 of HBV did not cluster with any Pakistani or foreign HBV isolates showing a distinct and unique origin of the strain. As a whole, the phylogenetic analysis points towards a great diversity among the HBV isolates sequenced in this study with some closer to the previously reported local isolates while others are genetically distinct.

The only limitation of the current study is that it doesn’t involve the role of the genotypes and their impact on the progression of liver disease so large scale studies are required to obtain further information.

Conclusion

It has been concluded from our study that genotype D is the most prevalent HBV genotype followed by genotype A and C circulating in this region and phylogenetic analysis based on S gene sequences revealed that there is a close homology of some of our sequences to the local as well as foreign isolates.As HBV genotype D shows a poor response to interferon antiviral therapy and genotype C causes a severe liver disease as compare to other genotypes so genotyping of samples should be made mandatory by practitioners before starting proper treatment to the patients.

Acknowledgment

Authors are highly grateful to Department of Biotechnology AWKUM and department of biosciences Comsats Islamabadfor their support to carry out this research work.

Conflict of Interest

The authors declare no conflict of interest.

Funding source

There is no funding source.

Refrences

  1. Schweitzer, Mmath J.H, T.M Rafael, G. Krause and J.J Ott, Estimations of worldwide prevalence of chronic hepatitis B virus infection: a systematic review of data published between 1965 and 2013.The Lancet. 2015;386(10003): 1546-1555.
    CrossRef
  2. Yoo, J., G. Park, and H. Hann, Persistent Risk for Hepatocellular Carcinoma in Patients on Antiviral Treatment: Desperate Need for HBV Cure.Clin Oncol. 3: 1459-1467.
    CrossRef
  3. Rehermann, B. and M. Nascimbeni, Immunology of hepatitis B virus and hepatitis C virus infection. Nature Reviews Immunology, 2005. 5(3): 215-223.
    CrossRef
  4. Mehr, M.T., et al., Efficacyof telbivudine in the treatment of hbeag negative chronic hepatitis B with normal baseline alt levels. Gomal Journal of Medical Sciences. 2012;10(2).
  5. Khan, N.U., A. Zalan, and A. Petruzziello, Suppl-1, M4: Determining the Actual Prevalence of Hepatitis B in Khyber Pakhtunkhwa-Pakistan: A Meta-Analysis.The open virology journal. 2018; 12: 33-41.
    CrossRef
  6. Magnius, L.O. and H. Norder, Subtypes, genotypes and molecular epidemiology of the hepatitis B virus as reflected by sequence variability of the S-gene.Intervirology. 1995;38(1-2): 24-34.
    CrossRef
  7. Stuyver, S.T Gendth, C. V Geyth, F. Zoulim, M. Fried and R. Rossau.A new genotype of hepatitis B virus: complete genome and phylogenetic relatedness.Journal of general virology. 2000;81(1): 67-74.
    CrossRef
  8. Pourkarim, M.R., S. A.B. Olayee, F. Kurbanov, M. V. Ranst and F. Tacke.Molecular identification of hepatitis B virus genotypes/subgenotypes: revised classification hurdles and updated resolutions.World journal of gastroenterology. 2014; 20(23): 7152-7159.
    CrossRef
  9. Mahtab, S. Rahman, M. Khan and F. Karim.Hepatitis B virus genotypes: an overview. Hepatobiliary & pancreatic diseases international. 2008;7(5): 457-464.
  10. Mulders, M.N, V. Venard, M. Njayou, A. P. Edorh, A.O.B. Oyefolu et al. Low genetic diversity despite hyperendemicity of hepatitis Bvirus genotype E throughout West Africa. The Journal of infectious diseases. 2004;190(2): 400-408.
  11. Kramvis, A., M. Kew, and G. Francois, Hepatitis B virus genotypes.Vaccine. 2005;23(19): 2409-2423.
    CrossRef
  12. Huy, T.T.T., T.T. Ngoc, and K. Abe, New complex recombinant genotype of hepatitis B virus identified in Vietnam.Journal of virology. 2008;82(11): 5657-5663.
    CrossRef
  13. Kao, J.-H., Molecular epidemiology of hepatitis B virus.The Korean journal of internal medicine. 2011;26(3): 255.
    CrossRef
  14. Tanwar, S. and G. Dusheiko, Is there any value to hepatitis B virus genotype analysis?.Current gastroenterology reports. 2012;14(1): p. 37-46.
    CrossRef
  15. Tanaka, Y. and M. Mizokami, Genetic diversity of hepatitis B virus as an important factor associated with differences in clinical outcomes.The Journal of infectious diseases. 2007;195(1): 1-4.
    CrossRef
  16. Khan, H A., B. Ullah, S. Attaullah, S. Sohail, Sero-prevalance of anti hbsag among female university students of district peshawar.Pakistan Journal of Public Health. 2018;8(4): 181-184.
    CrossRef
  17. Norder, H., A. M. Courouce, P. Coursaget, J. M. Echevarria, S. D. Lee et al. Genetic diversity of hepatitis B virus strains derived worldwide: genotypes, subgenotypes, and HBsAg subtypes.Intervirology. 2004;47(6): 289-296.
    CrossRef
  18. Farazmandfar, T., M. R. Haghshenas, G. Janbabai, H. Azadeh, R. Sharifian and M. Taghipour. A rapid and reliable genotyping method for hepatitis B virus genotypes (A–H) using type-specific primers.Journal of virological methods. 2012;181(1): 114-116.
    CrossRef
  19. Naito, H., S. Hayashi, and K. Abe, Rapid and specific genotyping system for hepatitis B virus corresponding to six major genotypes by PCR using type-specific primers.Journal of clinical microbiology. 2001;39(1): 362-364.
    CrossRef
  20. Saitou, N. and M. Nei, The neighbor-joining method: a new method for reconstructing phylogenetic trees.Molecular biology and evolution. 1987;4(4): 406-425.
  21. KAO, J.H., Hepatitis B viral genotypes: clinical relevance and molecular characteristics. Journal of gastroenterology and hepatology. 2002;17(6): 643-650.
    CrossRef
  22. Cao, G.-W., Clinical relevance and public health significance of hepatitis B virus genomic variations.World journal of gastroenterology. 2009;15(46): 5761.
    CrossRef
  23. Grandjacques, C., et al., Rapid detection of genotypes and mutations in the pre-core promoter and the pre-core region of hepatitis B virus genome: correlation with viral persistence and disease severity.Journal of hepatology. 2000;33(3): 430-439.
    CrossRef
  24. Usuda, S., et al., Serological detection of hepatitis B virus genotypes by ELISA with monoclonal antibodies to type-specific epitopes in the preS2-region product. Journal of virological methods. 1999;80(1): 97-112.
    CrossRef
  25. McMahon, B.J., The influence of hepatitis B virus genotype and subgenotype on the natural history of chronic hepatitis B.Hepatology international. 2009;3(2): 334-342.
    CrossRef
  26. Noorali, S., et al., Prevalence of Hepatitis B virus genotype D in females in Karachi, Pakistan.The Journal of Infection in Developing Countries. 2008;2(05): 373-378.
    CrossRef
  27. Alam, M.M, S. Z. Zaidi, S. A. Malik, S. Shaukat, A. Naeem et al.Molecular epidemiology of Hepatitis B virus genotypes in Pakistan.BMC infectious diseases. 2007;7(1): 115.
    CrossRef
  28. Baig, S., et al., Phylogenetic analysis of hepatitis B virus in Pakistan. Journal of the College of Physicians and Surgeons–Pakistan. 2008;18(11): 688-694.
  29. Abbas, Z., R. Muzaffar, A. Siddiqui, S. A. A. Naqvi, S. A. H. Rizvi.Genetic variability in the precore and core promoter regions of hepatitis B virus strains in Karachi. BMC gastroenterology. 2006;6(1): 20.
    CrossRef
  30. Awan, Z., et al., Pattern and molecular epidemiology of Hepatitis B virus genotypes circulating in Pakistan.Infection, Genetics and Evolution. 2010;10(8): 1242-1246.
    CrossRef
  31. Chan, H.L.-Y., et al., Hepatitis B virus genotype C takes a more aggressive disease course than hepatitis B virus genotype B in hepatitis B e antigen-positive patients. Journal of clinical microbiology. 2003;41(3): 1277-1279.
    CrossRef
  32. Kumar, A., et al., Hepatitis B virus genotype A is more often associated with severe liver disease in northern India than is genotype D.Indian journal of gastroenterology. 2005; 24(1): 19-22.
  33. Khan, A., et al., Epidemiological and clinical evaluation of hepatitis B, hepatitis C, and delta hepatitis viruses in Tajikistan.Journal of medical virology. 2008;80(2): 268-276.
    CrossRef

Evaluation of Critical Quality Attributes of Immediate Release Ciprofloxacin Tablets of Different Pharmaceutical Companies in Bangladesh

$
0
0

Introduction 

Critical Quality Attributes (CQAs) refers to a physical, chemical, biological, or microbiological featureof a product that must be within an appropriate range, or limit, or distribution to confirm the expected quality.1,2 CQAs are generally related to the active pharmaceutical ingredients (API), excipients, intermediates (in-process materials), and drug product. For solid dosage forms (SDFs) like tablets or capsules that are taken orally, CQAs are generally the aspects that determine the strength, purity, release of the API from SDFs, and stability. For other types of dosage forms, CQAs include additional aspects specific to that dosage form, for instance, sterility for parenteral products,aerodynamic features for metered dose inhalers (MDIs), and adhesion for transdermal patches. CQAs is an important factor in Pharmaceutical development.3The recently developed approach of drug development, ‘Quality By Design’ (QBD) include design involving the parameter ranges for all CQAs to ensure the product complies the quality target product profile (QTPP). 2

Substandard and counterfeit drugs have been a major concern in recent days. There are a number of instances that account for substandard and fraudulent medications in the global market. Substandard pharmaceutical products do not follow the specifications and are ineffective and even hazardous to the patients4,5. A study in 2017 showed that globally, about 10% of the pharmaceutical dosage forms were claimed to be counterfeit products, but this number increased to 25% for developed countries, and surpassed 50% in some countries, as reported by World Health Organization (WHO). The FDA reports that up to 25% of medications in developing states are not standard or fraudulent.In 2016, the volume of global trade in fraudulent pharmaceutical products was up to USD 4.4 billion, as per the OECD/EUIPO (2019) report which constitutes 0.84% of the estimated pharmaceutical goods imported worldwide 6.

By contributing more than 90 percent of the available drugs on the market, local pharmaceutical manufacturers have recently emerged as a game-changer. Bangladesh Pharmaceutical Market Future Opportunity Outlook 2025, a recentreport published in 2020, has demonstrated that Bangladesh Pharmaceutical Market has marketing prospects ofmore than US$ 6 Billion by 2025 with an absolute growth of 114% from 2019 levels and exports opportunity of more than US$ 450 Million by 2025. For the achievement of this goal, Bangladesh, like other countries, has to maintain the quality of the drugs and dosage forms by maintaining the critical quality attributes suggested by FDA.7

Ciprofloxacin tablets Ciprofloxacin is an antibiotic of fluoroquinolone group. It is used for the treatment of certain kinds of bacterial infections8. It exerts its effects by inhibiting DNA replication2. The enzyme inhibits the bacterial DNA gyrase (Topoisomerase II). This enzyme helps toinhibit relaxation of supercoiled DNA and consequently leads to breakage of dsDNA. 9–11

Vol17No4_-Eval_Are_fig1 Figure 1: Ciprofloxacin

Click here to View figure

The range of various brands of the same drug puts several prescribers in a challenging situation of choosing of an ‘ideal’ brand. In vitro research or drug quality control allows understanding in vivo dissolution pattern and bioavailability.  Ciprofloxacin is quickly and well absorbed from the gastrointestinal tract when given orally in tablet form.8,10 The absolute bioavailability is about 70 percent with no significant loss by first-pass metabolism.The half-life is about 3.5-4.5 hours for Ciprofloxacin.In 1987, Ciprofloxacin was approved by the Food and Drug Administration (FDA) to be used in the United States as the first oral broad-spectrum antibiotic. It is amongst the most necessary medicines required for the basic health care system and is present in the World Health Organisation (WHO)Model list of essential medicines.12In our currentstudy, we have analyzed the critical quality attributes of ciprofloxacin tablets of different pharmaceutical industries of Bangladesh to study whether the companies provide the necessary quality attributes so that the drug can be dissolved properly in vivo and give required bioavailability.Six brands of immediate release Ciprofloxacin HCl 500 mg were randomly collected from Bangladeshi market and uniformity of weight, thickness, length, hardness, friability, and disintegration tests were carried out with the aim to assess  their  physical quality.13–16

Materials and Methods

Materials

Hydrochloric acid (HCl) was taken from Merck, Germany and Ciprofloxacin VETRANAL analytical standard (Sigma Aldrich) was used as standard.17,18Distilled water used throughout the work. Six different brands of Ciprofloxacin 500 mg tablets were purchased from the retail pharmacy and were called as Brand-A, Brand-B, Brand –C, Brand-D, Brand-E and Brand-F respectively. The labeled shelf life was three years from the date of manufacturing and the tablets were evaluated two years before the labeled expiry date.

Different Physical Test Methods

Thickness and Length

Table thickness and length wasmeasured by slide calipers. Tablet thickness and length should be in variation within ±5 % of standard value according to USP guidelines.13,21,16

Weight Variation Test

The aim of this test is to check the weight uniformity of manufactured batches, which essentially represents the uniformity of the presence of the active pharmaceutical ingredient. 20 tablets were arbitrarily taken and individually measured, and the mean was also evaluated. The difference between mean and individual tablet was calculated.13,16,22,23If not more than two tablets fall below the percentage range and if no tablet varies by more than 2 times the percentage limit, the tablet batch passes the USP ( United States Pharmacopeia)  test.16-19The weight variation test was done for six different brands according to the Official USP guidelines.

Friability

Friability test was done using Roche friabilator. The friability test was done according to USP guidelines. 22,24–26The tablets are vulnerable to abrasion in the friability test. Thereby it is helpful to evaluate the strength of the tablet by this test.

Hardness

Tablet hardness of tablets of six brands was measured using Monsanto tablet hardness tester. Ten tablets were arbitrarily taken from each brand and then the pressure was given. The pressure point at which the tablet crushed was recorded. This is  the hardness value for the specific tablet.16,23,27 The average hardness value was calculated and compared.

Disintegration

The disintegration test was performed using Disintegration apparatus (Copley). 0.1 N HCl at 37° C was used for disintegration test. The test was performed according to USP guidelines.10,19,28

Sample collection

Six different brands of Ciprofloxacin tablet available in Bangladesh were randomly selected. They were collected from retail pharmacies. For confidentiality purposes, they w ere designated as A,B, C, D, E and F.

Table 1: Brands of Ciprofloxacin

Code Dosage form Tablet strength (mg) Manufacturing date Expiry date
A Tablet 500 May, 2018 Mar, 2021
B Tablet 500 Jan, 2018 Jan, 2021
C Tablet 500 May, 2018 May, 2021
D Tablet 500 May, 2018 Apr, 2021
E Tablet 500 Mar, 2018 Jul, 2021
F Tablet 500 Mar, 2018 Mar, 2021

Result and Discussion

Thickness Test

Table shows that thickness of all brands of ciprofloxacin tablets is acceptable according to USP/BP specification.

Table no 2:  Thickness studies for six brands

                         Thickness (mm)
Sl no Brand A Brand B Brand C Brand D Brand E Brand F
1 4.85 6.44 5.66 6.51 4.94 5.42
2 4.86 6.47 5.63 6.51 4.95 5.42
3 4.86 6.46 5.63 6.50 4.94 5.41
4 4.89 6.47 5.63 6.50 4.88 5.40
5 4.81 6.44 5.64 6.51 4.96 5.38
6 4.93 6.46 5.57 6.50 4.94 5.42
7 4.90 6.51 5.45 6.50 4.94 5.42
8 4.86 6.44 5.60 6.50 4.94 5.41
9 4.90 6.51 5.64 6.50 4.94 5.42
10 4.93 6.43 5.61 6.50 4.94 5.42
Mean 4.879 6.463 5.606 6.503 4.937 5.412
Standard Deviation 0.038 0.028 0.060 0.005 0.021 0.013

Length Test

Length of tablets can be dimensionally described and controlled. Tablet length should be within ±5 % of standard value according to USP/BP specification. Table 3 shows that, the length of brand-B shows less deviation compared to the brand-C, brand-A, brand-E, brand-D and brand-F. But all brands are acceptable according to USP/BP specification.

Table 3: Length studies for six brands

Length (mm)
Sl no Brand A Brand B Brand C Brand D Brand E Brand F
       1       19.26 20.72 19.32 18.18 18.28 17.86
2 19.27 20.72 19.32 18.17 18.28 17.87
3 19.27 20.71 19.34 18.17 18.30 17.84
4 19.27 20.72 19.37 18.18 18.30 17.86
5 19.27 20.72 19.32 18.17 18.28 17.86
6 19.27 20.71 19.31 18.18 18.30 17.86
7 19.26 20.72 19.33 18.18 18.28 17.86
8 19.25 20.71 19.33 18.17 18.28 17.85
9 19.27 20.71 19.32 18.17 18.30 17.86
10 19.26 20.72 19.32 18.17 18.30 17.86
Mean 19.265 20.716 19.328 18.174 18.29 17.858
Standard Deviation 0.007 0.005 0.017 0.005 0.010 0.008

Weight Variation Test

All the brands conformed to the USP guidelines of weight variation test as Table 4 shows. Weight of two tablets should not differ from the average weight not more than 5%. Table 4 shows that the weight of brand-B and brand-C shows less deviation compared to the brand-A, brand-D, brand-E, brand-F. But all brands were found topass according to USP/BP specification.

Table 4: Weight variation studies for six brands

Individual Weight Variations (gm)
Sl no Brand A Brand B Brand C Brand D Brand E Brand F
1 0.71 0.85 0.83 0.79 0.73 0.70
2 0.71 0.87 0.83 0.79 0.73 0.71
3 0.71 0.88 0.83 0.78 0.74 0.71
4 0.70 0.86 0.85 0.79 0.74 0.68
5 0.72 0.85 0.81 0.79 0.71 0.69
6 0.72 0.85 0.82 0.78 0.71 0.68
7 0.73 0.85 0.83 0.79 0.73 0.71
8 0.71 0.85 0.83 0.78 0.73 0.69
9 0.73 0.86 0.81 0.79 0.73 0.70
10 0.70 0.87 0.81 0.79 0.72 0.69
Mean 0.714 0.859 0.825 0.787 0.727 0.696
Standard Deviation 0.011 0.011 0.013 0.005 0.010 0.012

Hardness Test

The capacity of tablets to survive handling without cracking or chipping is shown by the hardness. It may influence friability and disintegration as well. The harder thetablet, the more time it takes to disintegrate. Table 5 shows that brand A and B had less hardness while brands C, D, E, F could not break at 5 kg/cm². So, brand C, D, E, F is preferable according to USP/BP specification but brand A, B show less deviation.

Table 5:  Hardness studies for six brands

Hardness (kg/cm²)
Sl no Brand A Brand B Brand C Brand D Brand E Brand F
1 3 3.5 6 4 6 6.5
2 3 3.5 5.5 4 6 6
3 3 3.5 6 4 5.5 6.5
4 3 3.5 6.5 3.5 6 6
5 3 3.5 4 4 6 5
6 3.5 3.5 6.5 4 6 5.5
7 3 4 6.5 4 6 6
8 3 4 4 4 6 6
9 3.5 4 6 4 6 5.5
10 3 4.5 6 3.5 6 5.5
Mean 3.10 3.75 5.7 3.9 5.95 5.85
Standard Deviation 0.211 0.354 0.949 0.211 0.158 0.474

Friability Test

The USP and BP specification for friability is not more than 1%. Friability for all the brands was below 1%. The value of friability that shown in table 6 of brand A is 0.140 % and brand C is 0.121% but it could be applicable because percent friability not more than 1% of USP/ BP specification is acceptable.

Table 6: Friability studies for six brands

Sl no Brands Average

Weight of tablet before test (gm)

Average

Weight of tablet after test (gm)

Loss due to friability       Friability (%) USP/BP

Specification

Deviation from BP/USP
1 A 8.24 8.23 0.01 0.140  


Not more than 1%

Pass the requirements according to USP/BP
2 B 7.88 7.88 0 0
3 C 7.24 7.23 0.01 0.121
4 D 6.94 6.94 0 0
5  E 7.24 7.24 0 0
6 F 6.94 6.94 0 0

Disintegration Test

Disintegration could be directly related to dissolution and subsequent bioavailability of a drug. All the brands complied with compendia specifications for disintegration. The BP specification is that uncoated tablets and film coated tablet should disintegrate within 15 min and coated tablets should disintegrate within 30 min while USP/BP specifies that un coated and film coated tablets should disintegrate within 15 min. Table 7 shows that brand A, brand B, brand C, brand D, brand E, brand F disintegrate within 15 min that fulfills the requirement of USP specification.

Table 7: Disintegration test results

Sl. No. Individual tablet DT

(Min:Sec)

A B C D E F
1 2:40 2:24 10:38 1:53 5:00 2:25
2 2:46 2:31 12:00 1:54 6:12 2:30
3 2:56 2:50 11:00 1:50 6:34 2:06
4 2:27 2:57 12:24 1:57 4:17 2:13
5


2:35 2:44 11:55 1:44 6:46 2:19
6 3:04 2:39 10:45 1:53 5:56 2:36
Average Dissolution Time (Min:sec) 2:44 2:46 11:27 1:51 5:47 2:35
BP/USP specification For uncoated or Film coated tablet Within 15 min
Comments Pass the requirements according to USP/BP

We have found that the length, thickness, friability, weight variation, hardness test and disintegration time of Ciprofloxacin tablet were compliant to BP or USP guidelines. Tablet formulations should have adequate hardness and minimum friability to uphold its mechanical strength and stability which are important resulting factors of critical quality attributes (CQAs). Again, hardness of a tablet can affect the disintegration and dissolution, overall the release of the active pharmaceutical ingredient from the dosage form which is another resulting factor of critical quality attribute. All parameters assay result show that all brands are within the pharmacopoeial requirements. Ciprofloxacin tablets from different pharmaceutical companies showed significant differences in weight variation, hardness, and disintegration probably because of the process factor and variation in formulation parameters from manufacturer to manufacturer. But it shows less deviation in length, thickness and friability. The critical quality attributes indicate that these tablets would have desired dissolution pattern in the body after administration.

Conclusion 

Ciprofloxacin is a second-generation fluoroquinolone derivative that exerts its effects by inhibiting bacterial DNA gyrase (TopoisomeraseII). It is used for the treatment of bacterial gastroenteritis, respiratory tract infections, controlling bronchitis and pneumonia caused by Gram negative bacteria. We have studied the Critical Quality Attributes including length, thickness, friability, weight variation, hardness test and disintegration time of Ciprofloxacin tablet to study whether the ciprofloxacin immediate release tablets of different pharmaceutical companies available in the Bangladeshi market to assess whether they are compliant to BP or USP guidelines in respect of physical parameters. The statistical analysis of the results shows that all the tablets from different brands are within the BP or USP requirements.The tablets are expected to show desired dissolution pattern in the body. So, from the study, we reached the conclusion that the critical quality attributes for ciprofloxacin immediate release tablets of different pharmaceutical companies in Bangladesh ensure the appropriateness of their strength, purity, release of the API from SDFs, and stability.

Acknowledgement

We are grateful to Department of Pharmacy,ASA University Bangladesh for the research facilities provided.

Conflict of interest

The research has no conflict of interest.

References

  1. Zhang, L.; Mao, S. Application of Quality by Design in the Current Drug Development. Asian Journal of Pharmaceutical Sciences2017, 12 (1), 1–8. https://doi.org/10.1016/j.ajps.2016.07.006.
    CrossRef
  2. Claycamp, H. G.; Kona, R.; Fahmy, R.; Hoag, S. W. Quality-by-Design II: Application of Quantitative Risk Analysis to the Formulation of Ciprofloxacin Tablets. AAPS PharmSciTech2016, 17 (2), 233–244. https://doi.org/10.1208/s12249-015-0349-2.
    CrossRef
  3. Adminstration, U. S. F. and D. Guidance for Industry – Q8(R2) Pharmaceutical Development; U.S. Food and Drug Administration, 2016.
    CrossRef
  4. Arefin, P. A Review on the Ayurvedic Management of Causes and Symptoms of Bronchial Asthma; Vol. 9.
    CrossRef
  5. Arefin, A.; Arefin, P.; Arefin, S. Study on Awareness about Food Adulteration and Consumer Rights among Consumers in Dhaka, Bangladesh. Journal of Health Science Research2020, 0 (0), 23–31. https://doi.org/10.18311/jhsr/0/25038.
    CrossRef
  6. Trade in Counterfeit Goods and Free Trade Zones; Illicit Trade; OECD, 2018. https://doi.org/10.1787/9789264289550-en.
    CrossRef
  7. Bangladesh Pharmaceutical Market Future Opportunity Outlook 2025; 2020.
  8. Joda, A. E.; Tayo, F.; Aina, B. A. Quality Assessment of Ciprofloxacin Tablets Obtained from Community Pharmacies in Lagos, Nigeria. Ife Journal of Science2018, 20 (1), 155. https://doi.org/10.4314/ijs.v20i1.16.
    CrossRef
  9. Sharma, P. C.; Jain, A.; Jain, S.; Pahwa, R.; Yar, M. S. Ciprofloxacin: Review on Developments in Synthetic, Analytical, and Medicinal Aspects. Journal of Enzyme Inhibition and Medicinal Chemistry2010, 25 (4), 577–589. https://doi.org/10.3109/14756360903373350.
    CrossRef
  10. Fourcroy, J. L.; Berner, B.; Chiang, Y.-K.; Cramer, M.; Rowe, L.; Shore, N. Efficacy and Safety of a Novel Once-Daily Extended-Release Ciprofloxacin Tablet Formulation for Treatment of Uncomplicated Urinary Tract Infection in Women. Antimicrobial Agents and Chemotherapy2005, 49 (10), 4137–4143. https://doi.org/10.1128/AAC.49.10.4137-4143.2005.
    CrossRef
  11. Fahmy, S.; Abu-Gharbieh, E. In Vitro Dissolution and In Vivo Bioavailability of Six Brands of Ciprofloxacin Tablets Administered in Rabbits and Their Pharmacokinetic Modeling. BioMed Research International2014, 2014, 1–8. https://doi.org/10.1155/2014/590848.
    CrossRef
  12. Uddin, M. S.; Mamun, A. Al; Hossain, M. S.; Asaduzzaman, M.; Sarwar, M. S.; Rashid, M.; Herrera-Calderon, O. In Vitro Quality Evaluation of Leading Brands of Ciprofloxacin Tablets Available in Bangladesh. BMC Research Notes2017, 10 (1), 185. https://doi.org/10.1186/s13104-017-2507-y.
    CrossRef
  13. Evagelin, M. P.; Elisha, Y.; Kumar, P. P.; Lakshmi, G. S.; Arathi, K. Design and Evaluation of Amlodipine and Losartan Potassium Immediate Release Tablets by Direct Compression Method. The Journal of Medical Research2020, 6 (3), 103–105. https://doi.org/10.31254/jmr.2020.6310.
    CrossRef
  14. Panda, N.; Reddy, A. V.; Subba Reddy, G. V.; Panda, K. C. Formulation Design and in Vitro Evaluation of Zolmitriptan Immediate Release Tablets Using Primojel and AC-Di-Sol. Journal of Pharmaceutical Sciences and Research2015, 7 (8), 545–553.
  15. World Health Organization. Revision of Monograph on Tablets. International Pharmacopeia REVISION OF MONOGRAPH ON TABLETS Final text for addition to The International Pharmacopoeia2011, No. March, 1–6.
  16. Nyol, S.; Gupta, M. M. Immediate Drug Release Dosage Form: A Review. Journal of Drug Delivery and Therapeutics2013, 3 (2), 155–161. https://doi.org/10.22270/jddt.v3i2.457.
    CrossRef
  17. Arefin, P.; Hasan, I.; Reza, M. S. Design, Characterization and in Vitro Evaluation of HPMC K100 M CR Loaded Fexofenadine HCl Microspheres. SpringerPlus2016, 5 (1). https://doi.org/10.1186/s40064-016-2322-2.
    CrossRef
  18. Arefin, P.; Hasan, I.; Islam, M. S.; Reza, M. S. Formulation and In Vitro Evaluation of Eudragit RL 100 Loaded Fexofenadine HCl Microspheres. Bangladesh Pharmaceutical Journal2016, 19 (1), 58–67. https://doi.org/10.3329/bpj.v19i1.29240.
    CrossRef
  19. Kassahun, H.; Asres, K.; Ashenef, A. In Vitro and In Vivo Quality Evaluation of Glibenclamide Tablets Marketed in Addis Ababa, Ethiopia. Journal of Pharmaceutics2018, 2018, 1–7. https://doi.org/10.1155/2018/7916368.
    CrossRef
  20. Matji, A.; Donato, N.; Gagol, A.; Morales, E.; Carvajal, L.; Serrano, D. R.; Worku, Z. A.; Healy, A. M.; Torrado, J. J. Predicting the Critical Quality Attributes of Ibuprofen Tablets via Modelling of Process Parameters for Roller Compaction and Tabletting. International Journal of Pharmaceutics2019, 565, 209–218. https://doi.org/10.1016/j.ijpharm.2019.05.011.
    CrossRef
  21. Kar, A.; Amin, M. N.; Hossain, M. S.; Mukul, M. E. H.; Rashed, M. S. U.; Ibrahim, M. Quality Analysis of Different Marketed Brands of Paracetamol Available in Bangladesh. International Current Pharmaceutical Journal2015, 4 (9), 432–435. https://doi.org/10.3329/icpj.v4i9.24473.
    CrossRef
  22. Rahman, M. Z.; Ahamed, S. K.; Banik, S.; Hossain, M. S. Release Profile of Losartan Potassium from Formulated Sustained Release Matrix Tablet. Bangladesh Pharmaceutical Journal2015, 16 (2), 177–183. https://doi.org/10.3329/bpj.v16i2.22301.
    CrossRef
  23. Karim, S.; Bhuiyan, M. A.; Rana, M. S. Formulation and in Vitro Evaluation of Glimepiride Sustained Release Tablets: Comparison with Immediate Release Tablets. Bangladesh Pharmaceutical Journal2015, 18 (2), 157–162. https://doi.org/10.3329/ bpj.v18i2.24315.
    CrossRef
  24. Gaikwad, S. S.; Chafle, S. A.; Morris, P. S.; Avari, J. G. Development and Evaluation of Bilayer Tablets of Combination of Antibiotics for the Treatment of Sexually Transmitted Disease. Brazilian Journal of Pharmaceutical Sciences2016, 52 (3), 555–566. https://doi.org/10.1590/s1984-82502016000300020.
    CrossRef
  25. Rayakwar, N.; Singh Dangi, Y.; Professor, A. Development and Characterization of Controlled Release Bilayered Tablets of Citicoline Sodium. Journal of Drug Delivery and Therapeutics2019, 9 (2-s), 125–131.
  26. Nasrin, N.; Asaduzzaman, M.; Mowla, R.; Rizwan, F.; Alam, A. A Comparative Study of Physical Parameters of Selected Ketorolac Tromethamine Tablets Available in the Pharma Market of Bangladesh. Journal of Applied Pharmaceutical Science2011, 1 (8), 101–103.
  27. Khreit, O. I.; Alkailani, H. A.; Alqathafi, W. S. A Comparative Study of Physical and Chemical Parameters of Selected Paracetamol Tablets Available in the Pharma Market of Libya. Der Pharma Chemica2017, 9 (2), 1–6.
  28. United States Pharmacopoeia. Disintegration Test for Tablets and Capsules. The International Pharmacopoeia2016, No. 6, 1–4.

Dermatoglyphic study in Azoospermic and Oligozoospermic males

$
0
0

Introduction

Infertility resulting in men has evoked considerable medical and social interest. According to WHO, the infertility isa disease of the reproductive system, defined as the inability to achieve clinical pregnancy over one year or more of regular unprotected sexual intercourse. Male infertility refers to a males inability to result in pregnancy in a fertile female.Male infertility affects approximately 10% of couples worldwide.1 Sperm abnormalities have been significantly associated with male infertility. The normal sperm concentration plays a substantial role in fertilisation and pregnancy outcomes.2

The dermatoglyphic study has been proven to be a useful diagnostic tool as a marker for genetic origin diseases. During a few decades, the magnitude of male infertility has increased globally. Early detection of infertility is still a problematic medical task in such cases. The dermatoglyphic study may play an important role to identify suspected infertile males from a vast population.

An objective of the present study was to investigate dermatoglyphic patterns in azoospermia and oligozoospermia male patients and compare the findings of patients with the general population.

Material and Methods

This study was done on seventy-six infertile males (35 individuals having azoospermia and 41 individuals having oligozoospermia) visiting the Indira IVF Centre, Patna, Bihar. The male individuals who have infertility with not less than three years period were included in the infertile group.The average age of included males in the infertile group was 39.84years. The control group included normal healthy individuals representing the general population having the same reproductive age group and socioeconomic status. The infertile and control subjects without any particular genetic disease were taken.The verbal and informed consent from individuals of each group were taken.All of them were explained about the procedure of taking dermatoglyphics before having fingerprints and palmar prints.

Clinical information of subjects were collected including age, the period of the marriage, history of infertility and parity. Semen was collected for estimation of sperm count as per the World Health Organization guidelines.The individuals ofthe infertile group were classified based on sperm concentration, as azoospermia (no spermatozoa) and oligozoospermia (<20million sperm/ml). In the fertile control group, the sperm count was ranged from 35-200 million sperm/ml. The ethical clearance was obtained from the Institutional Ethics Committee, AIIMS, Patna (IEC/AIIMS/PAT/158/2017) before doing this study.Confidentiality and anonymity of subjects were ensured.

Necessary equipment required includes good quality printer ink, a flat glass, rubber roller,glazed surface paper (A3), cotton,turpentine oil, spirit,measuring protractor, sharpener, pointed pencil, and a hand lens (Magnavision).

The standard ink method was used to take prints.4 The hand was impregnated with a thin layer of ink and gently pressed on the paper from proximal to a distal end. The patterns were classified into loops, whorls, arches and unknown (Galton system).We considered “unknown” to any prints other than these three main classes and their subgroups. The ridges counting of each fingerprint pattern was analysed using a hand lens. The palmar angles such as ‘atd’, ‘dat’ and ‘adt’ were measured after drawing lines connecting the ‘a’, ‘d’ and ‘t’ triradii. The findings of both hands of cases and controls were compared. All data were collected and statistically analysed using the student’s t-test and chi-square test. After the sampling data was compiled and analysed in the Department of Anatomy, All India Institute of Medical Sciences, Patna.

Results and Discussion

The mean age (in years) of cases and control was 39.84±6.02 and 36.30±5.32,respectively. Most of the infertile males were in the age ranging from 41-50 years, comprising approximately 49% of the total cases. Examination on fingerprint patterns revealed that the loop was the most common type of fingerprint, followed by whorls and arches in men with azoospermia and oligozoospermia (53.14% and 57.32% respectively). Astatistically significant difference (p<.05) was noticed on comparing the fingertip ridge patterns of both hands of azoospermia males and control group. In men with azoospermia demonstrated a higher prevalence of whorl and arch patterns with a low prevalence of loop patterns as compared to the males of the control group(Table1).

Table 1: Comparison of Tip ridge pattern of all fingers (both hands) between men with azoospermia and control men.

Status Total number Loop Whorls Arch Unknown
Azoospermia

(35)

350 186 104 53 7
55.14% 29.71% 15.14% 2%
Controls

(35)

350 217 96 34 3
62% 27.43% 9.71% 0.86%
Chi2 8.45
p value 0.0375*

*Significant at p<.05

Similarly, on observing the frequencies of different types of fingertip patterns in men with oligozoospermia and control males, we also found the statistically significant differences in these groups (p<.05). The total number of arches was increased in men with oligozoospermia (35; 8.54%) as compared to control males (20; 4.88%) (Table 2).

Table 2: Comparison of frequencies of different types of fingerprint between men with Oligozoospermia and control men.

Status Total number Loop Whorls Arch Unknown
Oligozoospermia

(41)

410 235 122 35 18
57.32% 29.76% 8.54% 4.39%
Controls

(41)

410 259 127 20 4
63.17% 30.98% 4.88% 0.98%
Chi2 14.27
p value 0.0026*

*Significant at p<.05

The mean of ‘dat’ angle (left hand) of cases (azoospermia and oligozoospermia) was statistically significant on comparing with the control group. In contrast, the other angles, such as ‘atd’ and ‘adt’palmar angles were found insignificant in both hands of infertile and control groups (Table 3).

Table 3: Comparison of palmar triradii angle patterns in the right and left hands of cases and controls.

Palmar angles Mean ±SD p-value Result
Cases (n=76) Controls (n=76)
Right Hand
‘atd’ 40.43±5.50 40.84±4.07 0.6041 NS
‘dat’ 59.86±5.81 59.20±4.10 0.4213 NS
‘adt’ 79.71±5.85 79.96±3.50 0.7498 NS
Left Hand
‘atd’  40.47±4.25 41.61±4.26 0.1033 NS
‘dat’ 59.53±5.88 57.84±4.39 0.0473* S
‘adt’ 80.00±5.32 80.55±3.84 0.4637 NS

*S: Significant at p<.05, †NS: Not significant

The observed mean TFRC (Total finger ridge count) seen between azoospermia and oligozoospermia infertile males was 128.45 and 134.10, respectively, whereas mean AFRC in those two groups was 177.77 and 134.10, respectively. There were insignificant differences between both types of infertile males concerning AFRC and TFRC (Table 4).

Table 4: Finger ridge count (TFRC and AFRC) observed in men with azoospermia and oligozoospermia.

Parameter TFRC AFRC
Azoospermia


N 4496 N 6152
Mean 128.45 Mean 177.77
Oligozoospermia N 5498 N 7212
Mean 134.10 Mean 134.10
t value 0.5936 0.0077
p value 0.5546 0.9939
Result NS NS

In the present study,most of the infertile males were between the age group of 41-50 (37; 48.68%). Some studies suggested that the advanced age may be associated with impaired sexual function, sperm count profile which may be responsible for increased time to conception, and increased miscarriage rates.6-8 The main concern of this work was to compare the dermatoglyphic patterns in infertile men with azoospermia and oligozoospermia. Based on the result, the most common type of fingerprints in these cases was a loop pattern. Statistically  significant differences were found in fingerprint patterns of cases and controls. A significant decrease in the frequency of loops in men with azoospermia (186, 55.14%) and oligozoospermia (255, 57.32%). Where as in controls the frequency of loops(217, 57.32% and 259, 63.17% respectively). Similar results were also reflected in a dermatoglyphics study conducted on 24 infertile males by Sontakke et al.9 While Makol et al. 10 in New Delhi and Jafari etal.11 in Iran found significantly increased frequencies of loops in infertile males as compared to that of controls.The increased whorl pattern in the infertile men with azoospermia (104, 29.71%) as compared to that of controls (96, 27.43%). A similar finding was reached by Sontakke et al.and Jafari et al.11,but this outcome is contrary to that of Singh et al. (2017)who found that in infertile males,there was a significant decrease in the frequency of whorls as compared to the general population.13

Vol17No4_-Der_Pra_fig1 Figure 1: showing the frequency distribution of fingerprint patterns in men with azoospermia and controls.

Click here to View figure

We found a significantly increased frequency of arches in men with azoospermia (53, 15.14%) and oligozoospermia (35, 8.54%) as compared to controls (34, 9.71% and 20, 4.88% respectively). The arches increased frequency was consistent with the findings of Sontakke et al.9 and Prasad etal.12In another study done on infertile males and compared to controls by Singh et al. reported significantly decreased frequencies in the arches.13

Figure 2: Frequency distribution of fingerprint patterns in men with oligozoospermia and controls. Figure 2: Frequency distribution of fingerprint patterns in men with oligozoospermia and controls.

Click here to View figure

The present study has shown that the significant differences in ‘atd’ angle (left hand)among infertile males and control group, whereas the findings of the right hand were insignificant regarding differences in’atd’ angle among infertile males and control group. Partial similar findings were reported by Sontakke et al.9 and Prasad et al.12

The finger ridge count determines the size of the pattern. In this study, we found that differences in men with azoospermia and oligozoospermia concerning TFRC and as well as AFRC were insignificant. Similarly,on comparing with the control,non-significant differences in TFRC and AFRC of infertile patients were reported by Sontakke and colleagues as well as also by Jafari et al.Singh et al also reported similar facts in oligozoospermia affected males.9,11,13

Conclusions

The dermatoglyphic study is easy due to its cost-effectiveness and non-invasive procedure and would serve as a prediction tool, for early screening of infertile male subjects. This study revealed a significant dermatoglyphic difference between controls and men with azoospermia and oligozoospermia. This study showed an increased number of whorl and arch patterns along with decrease number of loop patterns with an increase in the ‘dat’ angle value of the left hand. Thedetection of such patterns by a physician could aid them toanticipate infertility problems in the susceptible patient.It can be used as a ready cost-effective screener to identify infertile subjects from a larger population for further investigations and to confirm or rule out infertility in such patients.So, physicians may advise for necessary preventive and encouraging health measures for individuals at risk.

Acknowledgements

Authors are very thankful to Dr Dayanidhi Kumar, who gave us the chance to get the fingerprints of infertile males in Indira IVF, Patna, Bihar. We are also grateful to the persons who have extended their cooperation in this study.

Conflict of Interest

There are no conflict of interest.

Funding Source

It was a non-funds project-based work. No financial support or any sponsorship was taken by any of the authors for the same.

References

  1. Prasad B, Jain R. The Cytogenetic Basis of Human Infertility: A Review. Journal of Dental and Medical Sciences. 2014; 13(8):83-88.http://www.iosrjournals.org/iosr-jdms/papers/Vol13-issue8/Version-2/Q013828388.pdfDOI: 10.9790/0853-13828388
    CrossRef
  2. Bonde JP, Ernst E, Jensen TK, Hjollund NH, Kolstad H, Henriksen TB et al. Relation between semen quality and fertility: a population-based study of 430 first-pregnancy planners. 1998; 352:1172-1177.https://www.thelancet.com/journals/lancet/article/ PIIS0140-6736(97)10514-1/fulltextDOI: 10.1016/S0140-6736(97)10514-1 PMID:9777833
    CrossRef
  3. Cooper TG, Noonan E, von Eckardstein S, Auger J, Baker HW, Behre HM, Haugen TB, Kruger T, Wang C, Mbizvo MT, Vogelsong KM. World Health Organization reference values for human semen characteristics. Hum Reprod Update. 2010 May-Jun;16(3):231-45. https://academic.oup.com/humupd/article/16/3/231/639175DOI:10.1093/humupd/dmp048. PMID:19934213.
    CrossRef
  4. Cummins H, Mildo C, editors. Methods of printing ink method. Fingerprints of Palms and Soles: In: An Introduction to Dermatoglyphics. 1st ed. Philadelphia, PA: Blakiston Company; 1943. p. 45-55.
  5. Galton F. Finger prints. Facsimile Ed. New York and London: Mac Millan; 1892.
  6. Ford WC, North K, Taylor H, Farrow A, Hull MG, Golding J. Increasing paternal age is associated with delayed conception in a large population of fertile couples: evidence for declining fecundity in older men. The ALSPAC Study Team (Avon Longitudinal Study of Pregnancy and Childhood). Hum Reprod. 2000 Aug;15(8):1703-8. https://academic.oup.com/humrep/article/15  /8/1703/670811 DOI: 10.1093/humrep/15.8.1703. PMID:10920089.
    CrossRef
  7. Hassan MA, Killick SR. Effect of male age on fertility: evidence for the decline in male fertility with increasing age. Fertil Steril. 2003 Jun;79(3):1520-7. https://www.fertstert.org/article/S0015-0282(03)00366-2/pdfDOI: 10.1016/s0015-0282(03)00366-2. PMID:12801554.
    CrossRef
  8. Elzanaty S.Association between age and epididymal and accessory sex gland function and their relation to sperm motility. Arch Androl. 2007 May-Jun;53(3):149-56. https://pubmed.ncbi.nlm.nih.gov/17612873/DOI: 10.1080/01485010701225667. PMID:17612873.
    CrossRef
  9. Sontakke BR, Talhar S, Ingole IV, Shende MR, Pal AK, Bhattacharaya T. Dermatoglyphic pattern in male infertility. Nepal Med Coll J. 2013 Jun;15(2):106-9. https://pubmed.ncbi.nlm.nih.gov/24696927/PMID:24696927.
    CrossRef
  10. Makol N, Kshatriya G, Basu S. Study of finger and palmar dermatoglyphics in primary infertile males. Anthropol Anz. 1994 Mar;52(1):59-65. https://pubmed.ncbi.nlm.nih.gov/8192434/PMID:8192434
    CrossRef
  11. Jafari HP, Chaleshtori MH, Farhud DD. Dermatoglyphics in Patients with Oligo / Azoospermia. Iranian J Publ Health. 2005; 34:56-61.https://ijph.tums.ac.ir/index.php/IJPH/article/view/1856
  12. Prasad B. Kumari S, Panchal P, Kumar D. Palmar and digital dermatoglyphic patterns in infertile males in the population of Bihar. Res. Chron. 2018; 5(5):323-329. https://medrech.com/index.php/medrech/article/view/320DOI:10.26838/medrech.2018.5.5.429
    CrossRef
  13. Singh B, Jafar S. Study of Fingerprint Patterns in oligospermic Male. Journal of Medical Science and Clinical Research. 2017; 05(11): 30480-83. http://jmscr.igmpublication.org/v5-i11/113%20jmscr.pdfDOI:https://dx.doi.org/10.18535/jmscr/v5i11.113
    CrossRef

Metagenomic Analysis of Dam Reservoirs in Pune City for Bacterial Fingerprints Through BLAST and Kaiju Tool

$
0
0

Introduction

Until the late 20th century, the outcomes of microbiology were restricted by the meagre potential of pure culturing techniques in terms of throughput data and accuracy. This is largely because of the dependency of culturing techniques on the ability of a microbe to grow in the appropriate medium. Although culturing techniques have led to the discovery of a plethora of microorganisms, a century worth of research has only able to identify 1% of the speculated microbial population. Acknowledging the limitations of pure culturing techniques, Pace and colleagues utilized the available sequencing techniques to sequence the 16s rRNA and 5s rRNA in order to describe the microbial diversity in an environmental soil sample 1. This was one of the pioneer projects that led to the development of a new field of environmental ecology, called metagenomics. First introduced by Jo Handlesman, metagenomics is an innovative approach of analyzing the total genetic material from an environmental source in order to understand the taxonomic composition and the role of each member in the community 2. Simultaneously, advancement in sequencing technologies leading to Next Generation Sequencing (NGS), had a remarkable effect on the frequency and accuracy of the studies performed under the domain of metagenomics. Since the start of the 21st century, efforts towards metagenomic analysis have increased several folds with multiple benchmark projects aimed at understanding the complex taxonomic structure of the microbial communities inhabiting various environmental sources and their role in maintaining the biogeochemical cycles responsible for governing the flow of carbon and energy in the ecosystem. Some of the most remarkable studies have been published covering a wide range of environmental samples that are directly or indirectly involved in the health of our species. One of the most interesting of these studies started in 2003 was “The Sorcerer II Global Ocean sample expedition” (popularly known as GOS) that followed the renowned route of Darwin’s HMS Beagle, answering one of the most complex questions regarding the diversity of microbes in global marine environments (data sets of which are available on NCBI and CAMERA databases) 3. The uncultured viral community associated with the human fecal matter was another vital study carried out by 4 under the paradigms of metagenomics revealing important data regarding ~60 strains of phages and other viruses colonizing the lower areas of the gut microbiome.  Another set of studies deeply investigates local environmental samples, examples of which include acid mine drainage biofilms, Sargasso Sea, Whale falls, Eel river sediments, Minnesota farm soil, Pleistocene bear caves fossils, Soudan Mine, Hawaii Ocean, Mammoth fossils, Bras del Port Saltern, Coral holobiont, Neanderthal microbiome, Mediterranean Sea, Coral Reefs in Australia, Tasmanian Tiger Genome and many more. The collection of data from these studies has enhanced our understanding of various factors of human evolution, gut microbiome, and most importantly the role of microorganisms in the environmental samples that are directly involved in the general human lifestyle of that particular locality 5. The data collected from the various samples can be categorized as either sequence driven data or function-driven data. While the former has a great potential to discover novel microbial species and their evolutionary relationship with existing taxa, the latter reveals important features about the genetic and proteomic factors responsible for carrying out the physiochemical processes within a particular microbial community. Considering the wide success of various large-scale environmental projects, Metagenomics has inevitably permeated in the research of freshwater bodies and related sciences like limnology to address the lacunae in our understanding of the microbial factors responsible for 90% of global organic degradation and nutrient recycling 6.

Different kingdoms of microorganisms are known to inhabit all kinds of extreme and non-extreme environments. Similarly, each freshwater body has its indigenous microbiome or microbial community that might not occur in other systems like marine, soil, or terrestrial ecosystems 7. Microorganisms from all kingdoms like protozoa, fungi, bacteria, and archaea present in these freshwater ecosystems dominate a large number of biogeochemical processes that occur in the respective habitat. Most of the members of this community are also directly involved in maintaining the quality of water and pollutants. Bacterial species (Gram-positive and negative) are one of the most frequent inhabitants of freshwater bodies (more than 90%) like rivers, lakes, and other inland waters 8. Studies by 9 further confirmed that bacterial species found in a particular freshwater system is closely related to communities from other freshwater sources but differed significantly when compared to marine ecosystems. They also established that certain bacterial colonies are typical to the freshwater systems and were universally observed in different freshwater systems, examples of such families of bacteria include Actinobacteria (ACK M1), Betaproteobacteria (GKS98, polynucleobacter, and R-BT065), and Bacteroides (SOL). It is also observed in many species that despite the cosmopolitan presence of certain families of bacteria in different climatic zones, they did show adaptation to a range of temperature but could only acclimatize to the particular temperature they are subjected to 10. Furthemore, freshwater habitats also provide the essential conditions to favor the growth of a range of bacterial pathogens like Botulism, Campylobacteriosis, Cholera, E. coli Infection, M. marinum infection, Dysentery, Legionellosis (two distinct forms: Legionnaires’ disease and Pontiac fever), Leptospirosis, Otitis Externa (swimmer’s ear), Salmonellosis, Typhoid fever and Vibrio Illness 11. These pathogens are directly responsible for an estimated 1.8 million death (4.1% of the global burden of diseases) globally. Consequently, the uses of antibiotics by a large population contribute to the development of antibiotic-resistant genes in the bacterial colonies through fecal matter and industrial contamination.

Advancement in sequencing techniques and transformative progress in metagenomics provides an unprecedented platform for functional and taxonomic characterization of the enormous microbial diversity inhabiting and governing various biochemical processes of the freshwater sources. Metagenomic analysis of freshwater resources has led to the discovery and identification of novel microbial genes and an understanding of how microorganisms mediate energy and carbon. A combination of techniques developed under the paradigms of functional metagenomics and sequence-driven metagenomics has been utilized in identifying novel microbial species and their peculiar biogeochemical processes, enzymatic or catalytic properties, or their pathogenic properties that are primary markers in deciding the quality of water. Various projects recently carried out in the concerned field have led to the discovery of antibiotic-resistant bacterial strains, novel viral families, gene families, and pathogenic strains. The freshwater metagenomics approach further provides the potential to compare bacterioplankton of different water bodies, identifying generic microbial families of specific water body systems (lake, river, pond) and phylogenetic classification of resident microbial members. Most importantly, Metagenomics has extensively helped in categorizing genes from various bacterial strains that are directly involved in antibiotic resistance under a new term, called resistome 12.

Realizing the potential and success of metagenomics in decoding microbial communities from local freshwater resources, we focused this study on the analysis of 65 samples collected over 6 dams (Khadakwasla, Panshet, Varasgaon, Bhatgar, Mulshi, and Temghar) in Pune city (Maharashtra, India) to elucidate the bacterial composition and establish their taxonomic relationship. The building of river dams has a significant effect on the riverine environment causing a myriad of physical, biological, and chemical variations. These effects are key factors in deciding the composition of the microbial communities inhabiting within them as discussed before 13. We further analyzed, samples from the same sources over various seasons (Summer, Winter, and Monsoon), and from the surface, middle and, bottom layers. The seasonal analysis was carried out with an objective to understand the effect of the annual hydrological cycle on the bacterial community while the water column was analyzed to draw important conclusions regarding the effect of light and temperature on the bacterial composition.

Material and Methods 

Chemicals

All the bulk chemicals, solvents used in the study were of analytical reagent (AR) grade and procured from suppliers including SD fine-chemicals, Loba Chemie, Sisco Research Laboratories and Qualigenes, India.

Fine chemicals like sodium acetate, STE buffer, lysozyme, proteinase K, dithiothrietol, HEXfluorescent dye were obtained from Sigma–Aldrich, Germany, and geneOmbio Technologies, India. Membrane filters of 45µm were procured from Himedia, India. DNA ladder mix, RNAase was procured from Promega, UK; dNTP, HF PCR buffer, Taq polymerase, was PCR primers were provided by IDT, USA and PCR purification kit was purchased from geneOmbio Technologies, India.

Water sample Collection

Total 72 water samples were collected from six dams, Temghar, Bhatgar, Khadakwasla, Warasgaon, Panshet, and Mulshi of Pune city (18.5204° N, 73.8567° E). This study had been taken three samples (Bottom layer, Middle layer, and Upper layer) at a time for every season (rainy, winter, and summer). Total of nine samples were taken from one place. All water samples were collected in a sterile Labifie borosilicate glass reagent bottle with a screw cap. While taking the sample, the bottle was used to rinse three times with the respective sample (river/lake/dam water). After rinsing, the bottle was submerged below the water level till it will fill with the sample below 2.5 cm below the lid to maintain homogeneity. After the collection of the samples, till analysis, it is used to store at 400C in the fridge.

DNA isolation from water samples

15ml samples were collected and stored in sterilized bottles followed by the addition of 1.5ml 3M Sodium acetate and 33ml absolute ethanol. The mixture was stored at 40C until extraction.

For DNA extraction, the mixture was centrifuged at 10000 rpm for 20 mins (60C) and the supernatant was discarded. The pellet was washed and re-suspended in 0.9% saline. Nucleic acid extraction was performed by the addition of the STE buffer, lysozymes, and Proteinase K (10µg/ml). Purification of nucleic acid was performed by the NaCl and SDS lysis followed by phenol: chloroform: isoamyl alcohol-based extraction. Extracted and purified DNA was deproteinized thrice using the Tris-saturated phenol (isoamyl alcohol: CHCl3: Phenol in ratio 2:48:50), followed by CHCl3: isoamyl alcohol (24:1). The DNA was precipitated using 2% sodium acetate and absolute alcohol. The DNA was dried and dissolved in 30L nuclease-free water.

DNA Sequencing

The extracted DNA was amplified using PCR and the amplicons were used for sequencing. The sequencing of DNA was performed using the BigDye Terminator V 3.1 Cycle sequencing kit (Applied Biosystems, USA); 2µl Sequencing primer (1.6pMol), 2µl Purified PCR product (template DNA ~ 50 -100 ng/uL concentration), 1.8µl sequencing buffer, 0.5µl ready reaction mix and 3.7µl Nuclease free water.

Applied Biosystems 3130 Genetic Analysis (Automated Sequencing Analysis machine) was used for the analysis of the sequencing products obtained from the cycling kit. The sequences were generated in .abl format which was then exported to FASTA format for analysis on BLAST and Kaiju tools.

Results and Discussion

72 samples collected from 6 different dam sites were compared and analyzed to the existing databases using BLAST and Kaiju tools for analysis of bacterial composition.  It was observed that sequences from Burkholderia, Sutterella, Wolinella, Escherichia, Acetobacter, and Staphylococcus were relatively abundant compared to the others, while an average of 40% nucleotide sequences obtained from the various samples remained unidentified following the comparison with the mentioned database. It is a clear indication of uncultured bacterial communities. A consistent bacterial composition was observed over various dam reservoirs at different locations in the city.

Analysis Through Kaiju Tool

Figure 1 to 6, shows the relative abundance of different bacterial groups within each of the reservoir systems. Among the 6 dam reservoir systems, Khadakwasla Dam has the highest proportion of unidentified sequences at 49% while Varasgaon Dam has the lowest percentage of unidentified sequences at 35%. While all the systems resulted in a relatively higher majority of Burkholderia (8-11%), Sutterella (8-14%), Wolinella (5-9%), Staphylococcus (3-7%), Acetobacter (4-7%), Lactobacillus (2-4%), and Escherichia (5-8%), a few cases were observed to have a significantly lower population of the mentioned species, for example, Mulshi dam comprising 7% Burkholderia, Panshet comprising 3% Wolinella and Khadakwasla comprising only 2% Escherichia sequences. Albeit, in lower concentrations, another set of sequences observed throughout the 6 systems were from Pleomorphonas (1-4%), Helicobacter (0-3%), Rhodococcus (0-2%), Coxiella (1-2%), Taylorella (1-3%), Vibrio (0-2%), and Thiomonas (2-3%). With an exception of Mulshi Dam, Campylobacter was observed in all the other systems at relatively low concentrations ranging from 0-1%. Paenobacillus was completely absent in Khadakwasla and Varasgaon dam while ranging at 0-1% in other systems. Similar trends were observed for other sequences from Paenathrobacter (0-1%), Salmonella (0-1%), Curvibacter (0-2%), and Bifidobacterium (0-1%), where each of these species was absent from 2 reservoir systems: Paenathrobacter from Temghar and Varasgaon dam, Salmonella from Panshet and Varasgaon Dam, Curvibacter from Panshet and Varasgaon Dam, and Bifidobacterium from Bhatgar and Temghar Dam. Sequences from the Bacillus group were only obtained from Bhatgar and Khadakwasla Dam in ultra-trace quantities ranging from 0-1%. Mycobacterium sequences were further observed to be absent from Khadakwasla, Temghar, and Panshet dam, while Vitrioscella sequences were missing from Bhatgar, Mulshi, and Temghar Dams. Furthermore, Varasgaon Dam and Mulshi Dam reported the presence of sequences from exclusive groups, Listeria and Klebsiella, respectively.

 Vol17No4_Met_Pri_fig1 Figure 1: Bacterial diversity analyzed by Kaiju tool of Bhatghar Dam.

Click here to View figure

 Vol17No4_Met_Pri_fig2 Figure 2: Bacterial diversity analyzed by Kaiju tool of Khadakwasla Dam.

Click here to View figure

Vol17No4_Met_Pri_fig3 Figure 3: Bacterial diversity analyzed by Kaiju tool of Mulshi Dam.

Click here to View figure

 Vol17No4_Met_Pri_fig4 Figure 4: Bacterial diversity analyzed by Kaiju tool of Panshet Dam.

Click here to View figure

The presence of the Staphylococcus aureus and Burkholderiales cepacia complexes, suggests an important link to the human respiratory tract as the former is a commensal in the microbiome while the latter is an opportunistic pathogen causing respiratory infections 14, 15.   Burkholderia genus comprises a range of 30 different species that are involved in various bioremediation, ecological, and pathogenic processes. Some of the species from Burkholderia have been known pathogens of plants (carnation, onions, blight) and have also found early applications as bioweapons (Germany, during World War I) for its ability to cause infectious diseases in humans, horses, mules, and donkeys like melioidosis, septicemia, and pneumonia 16, 17. Furthermore, Burkholderia species have been actively utilized in industrial bioremediation processes, nutrition delivery in plants, and disintegration of biohazardous waste 18. A high percentage presence (~18%) of Suterella sp. also indicates fecal contamination since the bacterial species has been most commonly isolated from human feces 19.  Similarly, a considerable composition of reservoir freshwater bacterial colonies was identified to be commensals of the human GI tract microbiome like various strains of Escherichia coli, while sequences of various pathogenic strains from the family Campylobacter like Wolinella succinogenes and Helicobacter cinaedi were recovered in trace quantities 20, 21, 22. Escherichia also shows a peculiar ability to grow under low nutrient and other physiological stress, therefore, showing a high species richness. It also contributes to the microbial resistome of the habitat by expressing various genes for multidrug antibiotic resistance 23. Various pathogenic species of the Helicobacter genus including H. bilis, H. canis, H. trogontum, and H. hepaticus responsible for causing a range of infections in mammals were also persistently recovered throughout the year, although in trace quantities 24, 25, 26. Coxiella burnteii, a Rickesitta looking bacteria, further adds to the list of pathogens recovered from the river samples. It is a characteristic mild pathogen, resistant to extreme environmental changes and is the sole etiological factor responsible for the Q fever in cattle and humans 27.

Vol17No4_Met_Pri_fig5 Figure 5: Bacterial diversity analyzed by Kaiju tool of Panshet Dam

Click here to view figure

Vol17No4_Met_Pri_fig6 Figure 6: Bacterial diversity analyzed by Kaiju tool of Varasgaon Dam

Click here to View figure

Analysis Through BLAST

A seasonal analysis was performed for each reservoir site was performed using BLAST to understand the effect of the annual hydrological cycle on the bacterial composition. BLAST analysis resulted in a much more sensitive taxonomic analysis compared to that of Kaiju with significant differences in the bacterial composition. The results obtained through BLAST alignment reported various species from the bacterial groups identified in the Kaiju analysis, for example, Wolinella succinogenes, Helicobacter billis, Helicobacter pylori, and Bacillus pumilus among others. Additionally, sequences from bacterial taxa, Vogisella, Chromobacterium, Psuedogulbekiania, Citrobacter, Flexispira, Streptomyces, Neisseria, Pantoea, Enterobacterium, Glyxomyces, and Iodobacter were also identified from various samples suggesting the presence of a wide spectrum of ecologically important bacteria in the reservoir sites. Figure 7-12, shows the relative abundance of various species obtained from different sites in Summer, Winter, and Rainy seasons. 

Vol17No4_Met_Pri_fig7 Figure 7: Bacterial diversity analyzed by BLAST tool of Bhatgar Dam

Click here to View figure

Vol17No4_Met_Pri_fig8 Figure 8: Bacterial diversity analyzed by BLAST tool of Khadakwasala Dam

Click here to View figure

Vol17No4_Met_Pri_fig9 Figure 9: Bacterial diversity analyzed by BLAST tool of Mulshi Dam

Click here to View figure

According to the BLAST analysis, Vogisella indigofera was the most dominating bacterial species found among all the dams. Vogisella indigofera is a known mesophilic freshwater proteobacterium that shows a perennial presence in relatively high concentrations in rivers 28. In comparison to other seasons, winter can be attributed to a rise in the population of Wolinella Succiongenes in both the rivers that might possibly affect the anaerobic consumption of sulfites, polysulfide, nitrites, fumarates, and nitrates 29. One of the rare bacteria, Chromobacterium violaceum, was slightly more abundant during the rainy season compared to the summer or winter. C. violaceum is common to soil or stagnant waters, therefore, its presence can be directly correlated with the interplay of rivers with the environmental soil, ponds, or lakes. While ingestion of water contaminated by C. violaceum might not be harmful, it can cause localized skin infections with a potential to progress into septicemia, hence increasing the chances for multiorgan failure 30. A high percentage of bacterial sequences obtained from unknown species of Proteobacteria phylum or Enterobacteriaceae family might have a potential role in maintaining ecological cycles involving nitrogen, oxygen, sulfur, and carbon. Another agent of contamination, Bacillus pumilus was reported from Bhatgar and Khadakwasla dam. Bacillus pumilus is a Gram-positive aerobic bacteria that is commonly an inhabitant of soil microbial communities and is actively involved in rhizosphere formation and fungal resistance in various plants like red peppers and wheat 31. Furthermore, it serves the ecology of the surrounding environment by taking the responsibility for fixing atmospheric nitrogen to ammonia 32. It is also rarely pathogenic to humans causing toxic effects on epithelial cells through a complex of lipopeptide and pumilacidins. Streptomyces glaucinger represents the cosmopolitan mesophilic freshwater actinomycete that actively degrades starch, xanthin, casein, and hypoxanthine. It has applications in anti-fungal therapies for its pathogenic activity towards clinically important Candida albicans 33. Industrially important strains of bacteria were also found to be active members of the Pune dam microbiome community, like, Pantoea agglomerans, a species that can be exploited as a rich source for various antibiotics like phenazine and pantocins 19. Furthermore, P. agglomerans have been recently modified to cause antimalarial effects towards Plasmodium in mosquito guts 34.

Vol17No4_Met_Pri_fig10 Figure 10: Bacterial diversity analyzed by BLAST tool of Mulshi Dam

Click here to view figure

Vol17No4_Met_Pri_fig11 Figure 11: Bacterial diversity analyzed by BLAST tool of Temghar Dam

Click here to View figure

Vol17No4_Met_Pri_fig12 Figure 12: Bacterial diversity analyzed by BLAST tool of Varasgaon Dam

Click here to View figure

There were certain bacterial species exclusive to certain dams in specific seasons. An unusual presence of Psychrobacter pacificensis was reported in Khadakwasla dam during the rainy season, as this is a non-motile, deep water bacteria adapted to psychrophilic conditions that show oxidative and catalytic activities 35. The summer season further marks the growth of Zooglea ramigera in Khadakwasla dam, suggesting deposition of minerals, since Z. ramigera growth indicates the presence of an enriched aqueous environment 36.  Panshet dam accounts for on of the highest species richness among all the environments studied. In addition to species obtained in other resources, Panshet dam sustains the growth of Acidiferrobacter thiooxydans, Achromatium, and Neisseria elongata. A. thiooxydans are a highly resistant species towards acidic and thermal stress belonging to the family, Ectothiorhodospiraceae. It might have a potential role in the anaerobic oxidation of Iron and Sulfur radicals, hence contributing to the overall ecology of the environment 37. Another sulfur oxidising class of bacterial genus called, Achromatium was also isolated from Panshet Dam. Achromatium has an interesting genome that is highly similar to many environmental genomes and often contributes to the bacterial population at the interface of river sediments 38. An ancestor of the pathogenic Neisseriaceae family, N. elongata was also isolated from Panshet Dam. Usually a commensal in the pharynx of humans, these organisms can otherwise cause systematic diseases like endocarditis, osteomyelitis, and septicemia 39. A biologically and industrially important genus, Vitrioscella, was isolated from Mulshi dam during the rainy season. It is one of the earliest bacteria that has the capability to biosynthesize bacterial hemoglobin and find many applications in industrial biotechnology for its ability to promote cell growth, fermentation, biodegradation of toxic substances, and expulsion of toxic xenobiotics from cells, enhance protein synthesis, and metabolic productivity 40. A chemoorganoheterotrophic bacterium, Leptothrix fluviatis was isolated from Temghar dam, indicating neutral to slightly acidic environmental conditions. Leptothrix further suggests the presence of rust contamination in the dam as the organism is highly ferrugenic 41.

Conclusion

A deep metagenomic investigation of bacterial composition at various dam reservoir sites in Pune resulted in the identification of various etiologically, industrially, and ecologically important bacterial strains. However, an analysis performed using tools, Kaiju, and BLAST, reported significant differences in the taxonomic classification obtained. This suggests a lot of inaccuracy and inconsistency in results obtained through the existing tools for the alignment of metagenomic reads. To develop an efficient metagenomic analysis technique is the need of the hour.

Acknowledgment

We would like to acknowledge our institute for providing us the infrastructure facilities. We would like to thank Ms. Sanober Khatoon for helping us in technical issues.

Conflict of Interest

Authors declare no conflict of interests.

Funding Source

Bharati Vidyapeeth (Deemed to be University) has provided the funding for the current project.

References

  1. Wooley J, Godzik A, and Friedberg I. A primer on Metagenomics. PLoS Computational Biology.. 2010. 6(2) : e100067
    CrossRef
  2. Handlesman J, Rondon M, Brady S, Clardy J, and Goodman R. Molecular biological access to the chemistry of unknown soil microbes: a new frontier for natural products. Chemistry and Biology. 1998. 5(10) :
    CrossRef
  3. Rusch D, Halpern A, Sutton G, Heidelberg K, Williamson S, et al. The Sorcerer II Global Ocean Sampling Expedition: Northwest Atlantic through Eastern Tropical Pacific. PLoS Biology 5(3) :77.
  4. Breitbart M, Hewson I, Felts B, Mahaffy J, Nultan J, et al. Metagenomic Analyses of an Uncultured Viral Community from Human Feces. Journal of Bacteriology. 2003. 185 (20) :6220.
    CrossRef
  5. McKenna A, Hanna M, Banks E, Sivachenko A, Cibulskis K, et al.. The Genome Analysis Toolkit: a MapReduce framework for analyzing next-generation DNA sequencing data. Genome Research. 2010. 20(9) :
    CrossRef
  6. Wetzel R. Freshwater ecology: changes, requirements, and future demands. Limnology. 1: 3.
    CrossRef
  7. Shreeve J. The blueprint of life. US News World Reports. 139(16) :70.
  8. Hiorns W, Methe´ B, Nierzwickibauer S, and Zehr J. Bacterial diversity in Adirondack mountain lakes as revealed by 16S rRNA gene sequences. Applied Environmental Microbiol 1997. 63: 2957.
    CrossRef
  9. Zwart G, Crump B, Kamst-van A, Hagen F, and Han S. Typical freshwater bacteria: an analysis of available 16S rRNA gene sequences from plankton of lakes and rivers. Aquat Microb Ecol. 2002. 28:141-155
    CrossRef
  10. Hahn M, and Pockl M. Ecotypes of planktonic Actinobacteria with identical 16S rRNA genes adapted to thermal niches in temperate, subtropical, and tropical freshwater habitats. Applied Environmental Microbiology. 71: 766.
    CrossRef
  11. Sharma S, Sachdeva P, and Virdi J. Emerging water-borne pathogens. Applied Microbiol Biotechnolgy. 61 : 424.
    CrossRef
  12. Nnadozie C, and Odume O. Freshwater environments as reservoirs of antibiotic resistant bacteria and their role in the dissemination of antibiotic resistance genes. Environmental pollution. 2009. 254(part B) :113067.
    CrossRef
  13. Yan Q, Bi Y, Deng Y, He Z, Wou L, et al. Impacts of the Three Gorges Dam on microbial structure and potential function. Scientific Reports. 2015. 5:
    CrossRef
  14. Masalha M, Borovok I, Schreiber R, Aharonowitz Y, and Cohen G . Analysis of transcription of the Staphylococcus aureus aerobic class Ib and anaerobic class III ribonucleotide reductase genes in response to oxygen. Journal of Bacteriology. 2001. 183 (24): 7260.
    CrossRef
  15. Chandler L. Challenges in Clinical Microbiology Testing. Accurate results in ththe clinical laboratory. 315.
    CrossRef
  16. Godoy D, Gaynor R, Simpson A, Aanensen DM, Pitt T, et al. Multilocus sequence typing and evolutionary relationships among the causative agents of melioidosis and glanders, Burkholderia pseudomallei and Burkholderia mallei. Journal of Clinical Microbiology. 2003. 41(5) :2068.
    CrossRef
  17. Vazquez N, Cesar V, Rocio A, Yendi N, Marco L, et al. Modifications of bacterial populations in anthracene contaminated soils. Applied soil ecology. 61 :113.
    CrossRef
  18. Coenye T. and Vandamme P.  Diversity and significance of Burkholderia species occupying diverse ecological niches. Environmental Microbiology. 2003. 5(9) :719.
    CrossRef
  19. Wang L, Christophersen C, Sorich M, Gerber J, Angley M, et al. Increased abundance of Sutterella spp. and Ruminococcus torques in feces of children with autism spectrum disorder. Molecular Autism. 2013. 4(1) :42.
    CrossRef
  20. Baar C, Eppinger M, Raddatz G, Simon J, Lanz C, et al. Complete genome sequence and analysis of Wolinella succinogenes. Proceedings of the National Academy of Sciences of the United States of America. 100(20): 11690.
    CrossRef
  21. Batt C. Alcaligenes. Encyclopedia of Food Microbiology Second edition. 2014 :38.
    CrossRef
  22. Kawamura Y, Tomida J, Morita Y, Fujii S, Okamoto T, et al.. Clinical and bacteriological characteristics of Helicobacter cinaedi infection. Journal of Infection and Chemotherapy. 2014. 20(9) : 517.
    CrossRef
  23. Kaper J, Nataro J and Mobley H. Pathogenic Escherichia coli. Nat Rev Microbiol. 2004. 2 :123.
    CrossRef
  24. Dutasta F, Samaha E, Carayol N, Masse J, Bourillon C, et al.. Acute Colitis Caused by Helicobacter trogontum in Immunocompetent Patient. Emerging Infectious Diseases. 2016. 22(2) :335.
    CrossRef
  25. Abidi M, Wilhelm M, Neff J, Hughes J, Scott C, et al.. Helicobacter canis Bacteremia in a Patient with Fever of Unknown Origin. Journal of clinical microbiology. 51(3) : 1046.
    CrossRef
  26. Falsafi T, and Mahboub M. Helicobacter hepaticus, a new pathogenic species of the Helicobacter genus: Similarities and differences with H. pylori. Iranian Journal of Microbiology. 5(3). 185.
  27. Walker D. Rickestti. International Encyclopedia of Public Health (Second Edition) .2017.
  28. Gleim D, Kracht M, and Weiss N.. Prokaryotic Nomenclature Up-to-date. Leibniz Institute DSMZ – German Collection of Microorganisms and Cell Cultures.
  29. Simon J, and Kroneck M. Microbial Sulfite Respiration. Advances in Microbial Physiology. 2013. 62 :4
    CrossRef
  30. Kumar M. Chromobacterium violaceum: A rare bacterium isolated from a wound over the scalp. International journal of applied & basic medical research. 2(1): 70.
    CrossRef
  31. Sari, E, Etebarian, R, and Aminian H. The effects of Bacillus pumilus, isolated from wheat rhizosphere, on resistance in wheat seedling roots agains the Take-all fungus, Gaeumannomyces graminis var. tritici. Journal of Phytopathology. 2007. 155 :720.
    CrossRef
  32. Hernandez J, Bashan, L, Rodriguez D, Rodriguez Y, and Bashan Y. Growth promotion of freshwater microalga Chlorella vulgaris by the nitrogen-fixing, plant growth-promoting bacterium Bacillus pumilus from arid zone soils. European Journal of Soil Biology. 2009. 45:
    CrossRef
  33. Huang Y, Li W, Wang L, Lanoot B, Vancanneyt M, Rodriguez C et al. Streptomyces glauciniger sp. nov., a novel mesophilic streptomycete isolated from soil in south China. International Journal of Systematic and Evolutionary Microbiology. 54(6): 2085.
    CrossRef
  34. Lim J, Hwan L; Byoung K, and Sunggi H. Draft genome sequence of Pantoea agglomerans R190, a producer of antibiotics against phytopathogens and foodborne pathogens. Journal of Biotechnology. 2014. 188: 7.
    CrossRef
  35. Maruyama A, Honda D, Yamamoto H, Kitamura K, and Higashihara T. Phylogenetic analysis of psychrophilic bacteria isolated from the Japan Trench, including a description of the deep-sea species Psychrobacter pacificensis sp. nov. International Journal of Systematic and Evolutionary Microbiology. 2000. 50 (2): 835.
    CrossRef
  36. Roinestad F, and Yall I. Volutin granules in Zoogloea ramigera. Appl Microbiol. 1970 19 (6): 973.
    CrossRef
  37. Hallberg K, Hedrich S, and Johnson DB. Acidiferrobacter thiooxydans, gen. nov. sp. nov.; an acidophilic, thermo-tolerant, facultatively anaerobic iron- and sulfur-oxidizer of the family Ectothiorhodospiraceae. Extremophiles. 2011. 15(2) :271.
    CrossRef
  38. Ionescu D, Bizic M, and Maio N. Community-like genome in single cells of the sulfur bacterium Achromatium oxaliferum . Nat Commun. 8: 455
    CrossRef
  39. Grant P, Brenner D, Steigerwalt A, Hollis D, and Weaver R. N. elongata subsp. nitroreducens subsp. nov., Formerly CDC Group M-6, a Gram-Negative Bacterium Associated with Endocarditis. Journal of Clinical Microbiology. 1990: 2591.
    CrossRef
  40. Stark B, Dikshit K, and Pagilla K. Recent advances in understanding the structure, function, and biotechnological usefulness of the hemoglobin from the bacterium Vitreoscilla. Biotechnol Lett. 33(9) : 1705.
    CrossRef
  41. Emerson D, Reitner J, and Thiel V. Leptothrix. Encyclopedia of Geobiology Springer Dortrecht. 2013.

Intestinal Macrophages and Intestinal Infection

$
0
0

Introduction

A macrophage is a reference to a specific kind of white blood cell that forms part of the human body’s defense mechanism. It protects the body against foreign bodies, microbes, cellular debris, cancerous cells, and anything whose protein composition does not correspond to healthy body cell information on its surface. Macrophages are considered the sentinels of the intestinal immune system, and have a significant influence on the maintenance of homeostasis in the intestinal passage (1). Nonetheless, macrophages are also responsible for chronic ailments in the gastrointestinal tract, including inflammatory bowel disease. This research paper aims to perform an extensive discussion on intestinal macrophage and infection, with a special focus on intestinal infection by inflammatory bowel disease in human beings. Consequently, the essay will describe the structure, functions, as well as different types of macrophages. Moreover, it will discuss the role of macrophages in intestinal infection, especially inflammatory bowel disease(2, 3).

The gastro-intestinal tract houses the largest part of the immune system because it is highly prone to foreign antigens(1). It contains an extensive system of mono-nuclear phagocytes such as conventional dendric cells as well as macrophages. This network of cells has distinct roles that are complementary in the discrimination of potential pathogens, innocuous antigens, and subsequent corrective action (4). The breakdown of the efficiency of this process in the intestinal passage can result in the deployment of unsuitable defense mechanisms targeting commensal microbiota. This can cause chronic gastro-intestinal complications such as inflammatory bowel syndrome. Macrophages have wound-healing capabilities as well as plasticity that makes them potential novel remedies for the treatment of bowel inflammation. The role played by the macrophages in the intestinal tract also highly depends on their anatomical placement. Intestinal and colonic macrophages have a strategic location in the subepithelial lamina propria, where there is the largest concentration of antigenic stimulation.

Structure of Macrophage

Classification of macrophages has always been a difficult and ever-changing task, thanks to the difficulty of their identification. Traditionally, murine macrophages have been identified because they express the pan-macrophage marker F4/80 gene (1, 5). However, later research revealed that the gene could be expressed to some extent by eosinophils and conventional dendritic cells (cDCs). These cDCs have been previously known based on how they express MHCII as well as CD11c markers.

Nonetheless, these makers have also been extensively expressed by numerous macrophages, including gastro-intestinal ones. Superior markers of identifying macrophages in diverse tissues include FcγR1 (CD64) as well as the Mer tyrosine kinase (MERTK) (4). CD64 can be used together with CD11c and MHCII to differentiate macrophages and cDC in the intestinal tract.

There are several types of macrophages based on their location and function in the human body. There are two dominant types of macrophages in the intestine: M1 and M2(6, 7). The former class secrete interleukin-12 (IL-12) in higher amounts as compared to IL-10, and are activated by interferon-gamma (IFN) as well as lipopolysaccharide (LPS). Their functions are phagocytic, pro-inflammatory, and bactericidal. M2 macrophages, on the other hand, engage in constructive activities such as regeneration and healing of inflamed muscles (8)(Shaw et al., 2018). By producing cytokines like IL-10 with inflammatory properties, they inhibit the activation of damaging the immune system(9). In the early stages of inflammation or wound healing, M1 macrophages are the dominant phenotype. They recede as the wound heals and are replaced by M2 macrophages which are necessary for the formation of collagen through re-epithelialization and revascularization (Figure 1)(4, 10, 11).

Vol17No4_-Int_Had_fig1 Figure 1: M1 and M2 polarization of macro phages. Pro-inflammatory M1 polarization and anti-inflammatory M2 polarization of macrophages. Interferon-g and LPS are the major stimulators of M1 polarization, whereas interleukin-4 and 13 are inducers of M2 polarization.

Click here to veiw figure

Fig.1. M1 and M2 polarization of macro phages. Pro-inflammatory M1 polarization and anti-inflammatory M2 polarization of macrophages. Interferon-g and LPS are the major stimulators of M1 polarization, whereas interleukin-4 and 13 are inducers of M2 polarization. M1 activation is associated with inflammation, tumor resistance, and graft rejection. M2 activation is associated with immune regulation, matrix deposition, tissue remodeling, and graft acceptance. IFN: interferon, LPS: lipopolysaccharide, IL: interleukin, iNOS: inducible nitric oxide synthase, TNF: tumor necrosis factor, MCP: monocyte chemoattractant protein, CD: cluster of differentiation, Ym1: chitinase-like 3, TGF: transforming growth factor, VEGF: vascular endothelial growth factor (taken after (12)).

Differentiation

Monocyte differentiation in the mucosa of healthy tissue results in the creation of anti-inflammatory macrophages. Differentiation allows macrophages to evolve specific functions and characteristics that mirror their environment(2, 13). Macrophages are characterized by high plasticity which aids their environmental differentiation. Intestinal macrophages exist in environments that contain other numerous microbiotas which cannot be identified as ‘self,’ and can, thus, be candidates for phagocytosis by macrophages (14, 15). To avoid the destruction of useful bacteria in the digestive tract, intestinal macrophages have evolved to suit their immediate environment.

Consequently, unlike tissue macrophages, intestinal macrophages do not secrete inflammatory cytokines. This change can be attributed to the production of TGF-β by intestinal epithelial cells which transform them into anti-inflammatory from pro-inflammatory (14). Nonetheless, phagocytosis in the gastro-intestinal tract is not affected by these environmental changes. Moreover, intestinal macrophages do not express receptors for IgA, IgG, or LPS to avoid the detection of gut microbiome molecular patterns(16, 17).

The differentiation of macrophages in the intestinal tract or lack of it is credited for the creation of pro-inflammatory conditions in the gut, which are a precursor for the onset of inflammatory bowel diseases (14). Monocytes in the gut undergo significant changes to their default functionality through a process of differentiation from the rest of tissue monocytes. Not only do they become hypersensitive to exogenous stimulation resulting in anti-inflammatory responses, but they also learn to distinguish microbiota in the gut to avoid their destruction. However, when the host is not in good physical health, the differentiation of these macrophages does not occur normally. The implication of this is the accumulation of macrophages in the gut and adverse influence on both the composition and diversity of commensals, thus leading to an inflamed gut(18, 19).

Functuion of Macrophages

The environment in which macrophages exist is very crowded, and, thus, immune responses must differentiate disease-causing micro-organisms from commensal ones. The epithelium of the gut acts as a structural inhibitor for both pathogens and commensals by producing a protective mucus coat containing antimicrobial elements (16). Gut macrophages play a phagocytic role in the intestinal tract, including scavenging dead cells or debris, preventing infection of the mucosa by disease pathogens, and controlling inflammatory reactions to the breach of the epithelial wall by pathogens and antigens (17, 20). Their phagocytic function is important to the regulation of inflammation because they ingest mature neutrophils which are responsible for initial inflammation. Fixed macrophages are located strategically in organs such as the liver, spleen, lungs, bones, and neural tissue where they ingest and destroy foreign micro-organisms as well as dead cells(21). Upon ingestion of these foreign materials by the phagocytes, they become surrounded by a phagosome. Consequently, fuses occur with a lysosome inducing the breakdown of the micro-organism by toxic peroxides and enzymes(22).

Besides, macrophages also participate in innate or non-specific immunity and the activation of adaptive or specific defense mechanisms. This is achieved through the recruitment of another immunity mechanism such as lymphocytes. Together with dendrites, these monocytes play an important role in the presentation of antigens and consequently initiating the body’s defense mechanisms against pathogens (16, 17). Upon digestion, the antigen of the pathogen is represented to the appropriate helper T-cell. This is achieved through cell membrane integration as well as by attachment to an MHC class II molecule (MHCII), which differentiates it from other antigens containing pathogens and white blood cells. The body produces antibodies for the attachment of antigens which aid in the adherence of macrophages to the pathogen cell membrane for phagocytosis(22).

Macrophages and monocytes regulate inflammation as well as immunity responses by the production of powerful secretions known as monokines. Such chemical substances include complement proteins, regulators such as interleukin-1, and enzymes (20, 23). They also have receptors for lymphokines, which once activated, relentlessly pursue tumor cells and micro-organisms.

Macrophages also play a vital role in muscle regeneration, growth, and repair. The onset of muscle injury stimulates the activation of two waves of macrophages: a phagocytic and regenerative wave. The first wave of phagocytes occurs during physical activity that can result in lysis and inflammation of the muscle membrane. These macrophages are at their peak during the first 24 hours and focus on the degradation of injured muscle tissue (20, 24). Upon their decline after 48 hours, the second wave of non-phagocytic macrophages occurs to stimulate muscle regeneration. This second wave occurs approximately 2-4 days after muscle injury, remaining in high concentration over a span of several days. The accumulation of macrophages in tissue regeneration is not muscle-specific but occurs in responses to an injury. Macrophages also influence wound healing by phagocytosis of pathogen and injured tissue as well as re-epithelialization. Growth factors secreted by cells such as platelets attract monocytes reserved in the spleen, which mature into macrophages upon reaching the wound site (20). Macrophages also secrete factors that participate in the proliferation of the healing stage.

Furthermore, macrophages participate in iron and tissue homeostasis. They play a crucial role in parenteral irons’ pharmacokinetics by virtue of their role in the destruction of erythrocytes, macromolecules, and other cellular debris (25). The iron that results from this process is either circulated into the body through ferroportin or stored in the ferritin. When high levels of systemic iron are present, hepcidin inhibits macrophage channels maintaining the homeostatic conditions. Resident as well as specialized populations of macrophages are also found in tissues. This non-migratory or sessile macrophages have vital growth factors that aid tissues in their physiological functions and protect them from excessive inflammation (25). Moreover, a sub-set of macrophages known as melanophages absorb both native as well as exogenous phagocytosed pigment.

Macrophages in Intestinal Infection

Research has shown that macrophages play an important part in the occurrence of the IBDs such as Crohn’s disease and ulcerative colitis (25, 26). Symptoms of IBD are rectal bleeding, diarrhea, weight loss, abdominal pain, and internal pelvic cramps(27). Ulcerative colitis only inflames the colon as well as the rectum, while Crohn’s disease affects numerous parts of the digestive tract,  including the anus, ileum, colon, stomach, esophagus, and the mouth (28, 29)(Figure 2).

Vol17No4_-Int_Had_fig2 Figure  2:  Anatomic distribution of (A) ulcerative colitis and (B) Crohn’s disease. 

click here to view figure

Not only do they maintain tissue homeostasis, but they also resolve the onset of inflammation. Some individuals have an environmental or genetic predisposition that impairs their intestinal immunity in a chronic relapse of their immune system activation as well as gastro-intestinal infection, including but not limited to IBD (25, 30). When the gut is in a healthy condition, the inflammatory response is limited by intestinal macrophages. Disease-causing organisms alter intestinal macrophages extensively as far as diversity and numbers are concerned. The implication of this is an inflamed gut and subsequent IBD symptoms.

Macrophages have been touted in academic circles as potentially having novel treatment implications on patients suffering from inflammatory bowel syndrome. Recent studies have established a causal link between defective intestinal homeostasis and the differentiation of macrophages in the gut of IBD patients. The gut environment is symbiotic, and altering the composition as well as diversity of microbiota in the gut impacts immunity negatively and promotes the onset of IBD(14, 31). This intestinal ecosystem can be altered by oral medication such as antibiotics as well as environmental factors like concentrated milk fats often present in normal confectionery processed foods. Inflammation is generally resolved through the accumulation of externally activated pro-resolution macrophages as well as localized monocyte recruitment (4). Alternatively, activating differentiation of macrophages has resulted in successful therapeutic interventions targeting inflammatory bowel syndrome patients. Resolving intestinal inflammation and subsequent mucosal healing plays a vital part in the elimination of IBD signs and symptoms (25, 32, 33).

Conclusion

In conclusion, understanding the role of macrophages in the digestive tract is critical to the development of alternative therapies for IBD patients. Not only are they part of the intestinal immune system but they are also the maintainers of homeostasis in the gut. Homeostatic conditions in a healthy intestinal canal result in the downregulation of pathogen recognition receptors, preventing the destruction of microbiota and maintaining ecosystem balance. Epithelial breach, however, activates monocytes and lymphocytes from the bloodstream, which react protectively and in a pro-inflammatory manner. Failed resolution of the anti-microbial response and restoration of homeostasis can result in chronic inflammation. Nonetheless, numerous aspects of the biology, functionality, and differentiation are still not adequately understood. Case in point, human understanding of macrophage diversity in the intestinal ecosystem is still very limited.

Further research is necessary to better classification of macrophages and intra-system translation. Macrophage subpopulations that have been discovered will be critical in providing insight into mediating conditions that determine function, longevity, and phenotype of these macrophages. Such a new understanding will be invaluable in answering the question “why are some niches supportive of macrophage longevity while others are dependent on replenishment by monocytes?” There is also a need for further research on the impact of differences that exist along the digestive tract on the function and development of macrophages.

Acknowledgments

The authors would like to acknowledge the microbiome members, Department of Biological Science, Faculty of Science, King Abdulaziz University, Jeddah, Saudi Arabia for their expertise and assistance throughout all aspects of our study.

Conflict of Interests

The authors declare no conflicts of interest

References

  1. Scott CL, Bain CC, Wright PB, Sichien D, Kotarsky K, Persson EK, et al. CCR2+ CD103− intestinal dendritic cells develop from DC-committed precursors and induce interleukin-17 production by T cells. Mucosal immunology. 2015;8(2):327.
    CrossRef
  2. Na YR, Stakenborg M, Seok SH, Matteoli G. Macrophages in intestinal inflammation and resolution: a potential therapeutic target in IBD. Nature Reviews Gastroenterology & Hepatology. 2019:1.
    CrossRef
  3. Hine AM. Intestinal macrophages in resolving inflammation. The Journal of Immunology. 2019;203(3):593-9.
    CrossRef
  4. Shaw TN, Houston SA, Wemyss K, Bridgeman HM, Barbera TA, Zangerle-Murray T, et al. Tissue-resident macrophages in the intestine are long lived and defined by Tim-4 and CD4 expression. Journal of Experimental Medicine. 2018;215(6):1507-18.
    CrossRef
  5. Zhu Y, Zhang L, Lu Q, Gao Y, Cai Y, Sui A, et al. Identification of different macrophage subpopulations with distinct activities in a mouse model of oxygen-induced retinopathy. International Journal of Molecular Medicine. 2017;40(2):281-92.
    CrossRef
  6. Martinez FO, Gordon S. The M1 and M2 paradigm of macrophage activation: time for reassessment. F1000prime reports. 2014;6.
    CrossRef
  7. Mihic-Probst D, Reinehr M, Dettwiler S, Kolm I, Britschgi C, Kudura K, et al. The role of macrophages type 2 and T-regs in immune checkpoint inhibitor related adverse events. Immunobiology. 2020;225(5):152009.
    CrossRef
  8. Atri C, Guerfali FZ, Laouini D. Role of human macrophage polarization in inflammation during infectious diseases. International journal of molecular sciences. 2018;19(6):1801.
    CrossRef
  9. Iyer SS, Cheng G. Role of interleukin 10 transcriptional regulation in inflammation and autoimmune disease. Critical Reviews™ in Immunology. 2012;32(1).
    CrossRef
  10. Krzyszczyk P, Schloss R, Palmer A, Berthiaume F. The role of macrophages in acute and chronic wound healing and interventions to promote pro-wound healing phenotypes. Frontiers in physiology. 2018;9:419.
    CrossRef
  11. Kotwal GJ, Chien S. Macrophage differentiation in normal and accelerated wound healing. Macrophages: Springer; 2017. p. 353-64.
    CrossRef
  12. Lee K. M1 and M2 polarization of macrophages: a mini-review. Medical Biological Science and Engineering. 2019;2:1-5.
    CrossRef
  13. Grainger JR, Konkel JE, Zangerle-Murray T, Shaw TN. Macrophages in gastrointestinal homeostasis and inflammation. Pflügers Archiv-European Journal of Physiology. 2017;469(3-4):527-39.
    CrossRef
  14. Bernardo D, Marin A, Fernández-Tomé S, Montalban-Arques A, Carrasco A, Tristán E, et al. Human intestinal pro-inflammatory CD11c high CCR2+ CX3CR1+ macrophages, but not their tolerogenic CD11c− CCR2− CX3CR1− counterparts, are expanded in inflammatory bowel disease. Mucosal immunology. 2018;11(4):1114.
    CrossRef
  15. Bain CC, Schridde A. Origin, differentiation, and function of intestinal macrophages. Frontiers in immunology. 2018;9:2733.
    CrossRef
  16. Kim M, Galan C, Hill AA, Wu W-J, Fehlner-Peach H, Song HW, et al. Critical role for the microbiota in CX3CR1+ intestinal mononuclear phagocyte regulation of intestinal T cell responses. Immunity. 2018;49(1):151-63. e5.
    CrossRef
  17. Shalhoub J, Falck-Hansen MA, Davies AH, Monaco C. Innate immunity and monocyte-macrophage activation in atherosclerosis. Journal of inflammation. 2011;8(1):9.
    CrossRef
  18. Belkaid Y, Hand TW. Role of the microbiota in immunity and inflammation. Cell. 2014;157(1):121-41.
    CrossRef
  19. Zheng D, Liwinski T, Elinav E. Interaction between microbiota and immunity in health and disease. Cell Research. 2020:1-15.
  20. Panea C, Farkas AM, Goto Y, Abdollahi-Roodsaz S, Lee C, Koscsó B, et al. Intestinal monocyte-derived macrophages control commensal-specific Th17 responses. Cell reports. 2015;12(8):1314-24.
    CrossRef
  21. Murray PJ, Wynn TA. Protective and pathogenic functions of macrophage subsets. Nature reviews immunology. 2011;11(11):723-37.
    CrossRef
  22. Walters M-I, Papadimitriou JM, Spector W. Phagocytosis: a review. CRC critical reviews in toxicology. 1978;5(4):377-421.
    CrossRef
  23. Spiering MJ. Primer on the immune system. Alcohol research: current reviews. 2015;37(2):171.
  24. Huen SC, Cantley LG. Macrophages in renal injury and repair. Annual review of physiology. 2017;79:449-69.
    CrossRef
  25. Bain CC, Schridde A. Origin, differentiation, and function of intestinal macrophages. Frontiers in immunology. 2018;9.
    CrossRef
  26. Halfvarson J, Brislawn CJ, Lamendella R, Vázquez-Baeza Y, Walters WA, Bramer LM, et al. Dynamics of the human gut microbiome in inflammatory bowel disease. Nature microbiology. 2017;2(5):1-7.
    CrossRef
  27. Fakhoury M, Coussa-Charley M, Al-Salami H, Kahouli I, Prakash S. Use of artificial cell microcapsule containing thalidomide for treating TNBS-induced Crohn’s disease in mice. Current Drug Delivery. 2014;11(1):146-53.
    CrossRef
  28. Alshehri D, Saadah O, Mosli M, Edris S, Alhindi R, Bahieldin A. Dysbiosis of gut microbiota in inflammatory bowel disease: Current therapies and potential for microbiota-modulating therapeutic approaches. Bosnian Journal of Basic Medical Sciences. 2020.
    CrossRef
  29. Al-Amrah H, Saadah O, Mosli M, Edris S, Alhindi R, Bahieldin A. Alteration Of The Gut Microbiome For Patients With Inflammatory Bowel Disease: A Review. Applied Ecology And Environmental Research.18(5):7379-92.
    CrossRef
  30. Alatawi H, Mosli M, Saadah O, Dulai P, Al-Hindi R, Bahieldin A, Et Al. Primary Non-Response In Inflammatory Bowel Disease, Definition, Potential Causes, Therapeutic Drug Monitoring And Microbiota–A Review. Applied Ecology And Environmental Research. 2020;18(4):5505-25.
    CrossRef
  31. Lozupone C, Lladser Me, Knights D, Stombaugh J, Knight R. Unifrac: An Effective Distance Metric For Microbial Community Comparison. The Isme Journal. 2011;5(2):169-72.
    CrossRef
  32. Sommer F, Rühlemann MC, Bang C, Höppner M, Rehman A, Kaleta C, et al. Microbiomarkers in inflammatory bowel diseases: caveats come with caviar. Gut. 2017;66(10):1734-8.
    CrossRef
  33. Sokol H, Leducq V, Aschard H, Pham H-P, Jegou S, Landman C, et al. Fungal microbiota dysbiosis in IBD. Gut. 2017;66(6):1039-48.
    CrossRef

Preventive Effects of Dietaryraisins on Steroid – Induced Bone Changes in Rats

$
0
0

Introduction

Corticosteroids are an integral part of many chemotherapy protocols. They are commonly prescribed for different type of diseases in medicine. Steroid-induced osteoporosis is iatrogenic disorder; itis a major disabling complication that require special attention and treatment [1-4].Osteoporosis is an escalating metabolic bone disease associated with both poor bone and muscle mass. Its clinical manifestation is the fragility fracture of which the femoral neck fractures are the most serious. The magnitude of the problem presented by hip fractures is considerable, especially as their frequency is increasing in many countries.The definition of osteoporosis varies among authors.True osteoporosis is when bone strength and mass cannot meet the needs of muscle strength and physical activities so that spontaneous fractures and bone pain occur, mainly in the spine; an intrinsic bone disorder would cause this problem.Osteoporosis can be classified into primary osteoporosis (e.g. postmenopausal and senile osteoporosis) and secondary osteoporosis; some patients may have a combination of primary and secondary causes.  Secondary (OP) can occur at any age and is equally common in men and women. The etiology of osteoporosis is multifactorial and involves, for example, genetic factors, life style factors and sex hormone/endocrinology changes with age. Glucocorticoids is the most common cause of secondary osteoporosis,Glucocorticoid-induced osteoporosis (GIO),leading to fracture in patients. For example, methylprednisolonecan induce osteoporosis which causes profound reduction of bone mineral density (BMD), bone quality, bone formation, and bone mechanical properties which lead to fracture. The same pathophysiologic mechanisms responsible for primary osteoporosis could occur in some of the different types of secondary osteoporosis [5-7]. Although, there are histological differences between steroid-induced osteoporosis and primary osteoporosis there are secondary types of the disease that do not have specific histological features [8].

Dietary calcium, protein phosphorus and vitamin D play active roles in bone metabolism in addition to others which affects bone directly or indirectly (for review see Palacios C, 2006) [9]. Recent research has found that many food substances such as olive oil, soybeans, blueberries, fish oil and dried fruits may a positive effects on bone metabolic diseases [9-12].Boron is a trace element capable of enhancing the development and the growth of bone, vitamin D, and affecting the absorption and elimination its minerals, including calcium, phosphorus and magnesium. It has been shown to be very beneficial for bones and joints, and it is mainly helpful in reducing the complications of post-menopausal osteoporosis.Furthermore, boron deficiency can produce brain changes [7-10]. The top boron-rich food sources are fruits, dried fruits, vegetables, and nuts. Among the dried fruit products, raisins (Vitis vinifera L.) have the highest total phenolic concentrations, antioxidant activity, andis the top nutrient-dense foods with boron[10-16]. Raisins are dried grapes largely consumed for it nutritional value all over the world. Its health beneficial properties has been increasingly reported in literature. This may be contributed to its nutritional composition and its being rich polyphenols. Furthermore, raisins have been used since ancient times for energetic value and nutritional composition. Several studies have been demonstrated the health benefits of raisins, due to their high levels of flavonoids and polyphenols, which have antioxidant properties[17-28].The present study was conducted to evaluate the effects of raisin consumption on steroid – induced bone changes in young male albino rats.

Material and Methods

Chemicals

Methylprednisolone(MP) and all chemicals for sensitive biochemical assays were acquired from Sigma chemical company (St. Louis, MO, USA). Raisin juice was prepared fromdried black grapes (raisin).

Experimental design

The ethical regulations of the Medical Research Ethics Committee (Faculty of Medicine, Mutah University, Jordan) were followed in the management of thirty male albino rats (Sprague Dawley strain), average weight 150-200g. They were fed on basal diet for adaptation and supplied with water ad libitum. The environmental conditions (temperature, humidity and light) were standardized for accommodation of the rats. They were obtained from the animal house of MutahUniversity. The rats were randomly divided into three main groups, 10 rats each.Group I, Normal control group. Animals in this groupwere further subdivided into two subgroup 5 rats each, the first subgroup received no treatment for 4 weeks, while the second subgroup received treated with raisin alone (6 gm per day for each rat orally) for 4 week.Group II, osteoporotic group, where osteoporosis was induced by subcutaneous injection of methylprednisolone 28 mg/kg/week for 4 week. Group III, protected group, animals in this group were given 6 gm of raisin per ratorally, from the first day of experiment,concomitant daily withmethylprednisolone 28 mg/kg/week for 4 week [29, 30].

Collection of urine

24-hour before scarification each rat was kept in a special cage with perforated stand to calculate the urine output for 24 hours.Urine passed to a collecting bottle via a glass funnel fixed under each cage. Urine samples were collected in dry test tubes centrifuged and kept at –20ºC until being analyzed.

Preparation of serum

 Blood samples were obtained from the heart of the rat. Blood was then collected into a clean dry non-heparinized Wassermann tubes for separation of serum. The serum was separated by centrifugation at around 3000 rpm for 15 minutes and was stored at –20ºC until assayed.

Biomarkers

 the following bone biomarkers were analyzed;Hydroxyproline (mg/L) and Urinary calcium excretion (mmol/L) both demonstrating bone resorption. For bone formation Osteocalcin (ng/ml), Alkaline phosphatase (IU/L) and Serum calcium.

Histological preparation

 Followingscarification of the animals on day 28,lumber vertebrae were cleaned from muscle fibers and excised using bone cutter. The bones were placed in 10% formalin solution for 48 hours and then decalcified using EDTA.They were embedded in paraffin blocks. Thin sections of 5 µm thick, were prepared for staining by Hematoxylin and eosin stain and trichrome stain. Sections were then examined under light microscopy.

Statestical analysis

 Results were statistically analyzed using SPSS software v.20. The values were expressed as mean±SE. The difference between groups was determined using ANOVA test, p< 0.05 values were considered significant.

RESULTS

Biochemical Results

The present study was carried out to estimate the impact of raisins on methylprednisolone for 4 week induced bone changes in young male albino rats by assessing some biochemical markers of bone turnover,bone formation as well as the histological findings in lumbar vertebrae.Table 1 shows the results of the five biochemical markers of bone turnover expressed as mean±SE in the studied groups.

Table 1: The levels of examined biochemical markers of bone turnover in the studied groups expressed as mean±SE

  Group  I

Control group

n=10

Group II

Osteoporotic group

n=10


Group III

Protected group

n=10

Urinary Hydroxyproline (mg/L) 15.48±0.47 23.49±1.01 17.09±0.92
Urinary Calcium (mmol/L) 2.75±0.29 4.32±0.45 3.01±0.34
Serum Osteocalcin (ng/ml) 5.12±1.07 8.64±0.66 5.48±0.44
Serum Alkaline phosphatase (IU/L) 111.61±1.96 125.65±4.97 113.60±1.73
Serum Calcium (mg/dl) 10.14±0.20 8.97±0.40 9.82±0.23

Markers of Bone Resorption

Urinary hydroxyproline was one of the main bone resorption markers available.As illustrated in Table 1 methylprednisolonetreated group (group II) was associated with a significant increase of urinary hydroxyproline excretion when measured 4 week after the experiment compared to control group (group I) (p<0.001). In group III, where methylprednisolonetreated rats concomitant with raisins has been associated with a significant decrease in hydroxyproline level (p<0.001). On the other hand, elevated calcium excretion is generally included among the factors predisposing to osteoporosis. There was an increase of urinary calcium excretion in group IIcompared to a normal control group (group I) (p<0.05). Group III has been associated with a significant decrease ofurinary calcium excretion compared to group II (p<0.05).

Markers of Bone Formation

Alkaline phosphatase and osteocalcin were used clinically as a marker of osteoblast activity.There was a significant increase in serum level of osteocalcin in group II compared to the normal control group (p<0.05).Concomitant treatment with raisinswithmethylprednisolone(group III)was associated with a significant decrease in serum osteocalcin when compared group II (p<0.01). On the other hand, osteoporotic group (group II) showed asignificant increase of serum alkaline phosphatase level as compared to the normal control group (p<0.05). Furthermore, treatment withmethylprednisoloneand raisins (group III) compared with methylprednisolone treatment alone (group II) associated with a significant decrease in serum alkaline phosphatase level (p<0.05). Moreover, group II presented a significant decrease in serum calciumcompared to the normal control group (group I) (p<0.05).However, there was a significant increase of serum calcium in group III compared to group II (p>0.05).

Histological Results

Sections stained with hematoxylin and eosin stain and trichrome stain of the lumber vertebrae were examined of all three groups.Group I;this group revealed typical picture of cancellous bone with regularly thickened, classical regular parallel bone lamellae,multiple branched bony trabeculae delimiting the bone marrow spaces containing red bone marrow. Regularly oriented osteocytes were resident in their lacunae over the bone trabeculae (Figure 1a, b).Group II; this group revealed irregular bone lamellae with variable thickness with increased number of osteoclast.Some of them showed marked thinning and disturbed with anastomosing bone marrow cavities, splitting and separation of bone lamellae, ill-defined immature (osteoid) tissue,and other bone lamellae appeared pale stained with many widened lamellae. The osteocytes are randomly oriented in their lacunae, and some of these lacunae appeared either empty or with peripherally located osteocytes (Figure 1c, d). Group III; this group presented variable degrees of bone affection with widened separated lamellae, trabeculae appeared thinned in some  parts with anastomosing bone marrow cavities, many irregular bone lamellae with randomly oriented osteocytes presenting newly formed woven bone were also noticed. The periosteum was thickened and highly cellular (Figure 1e, f).

Vol17No4_Pre_Qta_fig1 Figure 1: Photomicrographs of cancellous bone in rat vertebrae. (a) Showing control group (group I) hematoxylin and eosin stain. (b) Showing control group (group I) trichrome stain. (c) Showing osteoporotic group (group II) hematoxylin and eosin stain. (d) Showing osteoporotic group (group II) trichrome stain. (e) Showing protected group (group III) hematoxylin and eosin stain. (f) Showing protected group (group III) trichrome stain.

Click here to view figure

Discussion

Synthetic glucocorticoids are indicated in various conditions. Their use have been accompanied with many side effects in many systems within the human body, particularly those over the skeletal system,consequential producing osteoporosis.Treatment of osteoporosis emphasis on preventing bone resorption and affecting the remodeling process.Prophylactically management of osteoporosis are limited to calcium and vitamin D[31-34].Diet and health have been linked since ancient times. Recently, remedies of specific food and diets are recommended for certain illnesses for their preventive values. Chronic diseases, like osteoporosis, have been recently treated with herbal plants due to the recent advancement in phytotherapy.Few herbal plants have been investigated clinically to assess their therapeutic effect on bone [35]. Dried fruits provide healthy bone, e.g.  prunes, because it contains vitamin K, manganese, boron, copper and potassium [36]. Raisins are rich in potassium, magnesium, and iron; and they have low sodium compared to other fruits.Additionally, raisins offer high fiber content, essential nutrients and protective components [37]. There are few studies concerning human health and raisins. Most of these studies are related to cardiovascular diseases, diabetes and oral health[19, 24].The bone biochemical and histological data presented above confirm that raisins have the ability to reduce the side effects of glucocorticoids over bone in GIO rats. Raisins are extremely rich in boron. Boron is supposedto be necessary for bones and joints development [37, 38]. As an estimate of bone resorption, the fasting urinary hydroxyproline excretion and urinary calcium excretion were measured.  Hydroxyproline and urine calcium levels were found to increase in the methyl prednisolone (MP ) treated group. These results are in agreement with other studies [39], which showed that glucocorticoids increase the urine calcium level and decrease serum calcium levels in GIO. Additionally, in postmenopausal women, there were a significant reduction in both magnesium and calcium excretion after daily administration of 3 mg of boron [37].Furthermore, this prebiotic compound, not only reduce calcium excretion but also increases the levels of ionized calcium in plasma [40]. Most of human studies have shown that boron may be useful in preventing osteoporosis, by decreasing the loss of  calcium and magnesium, which are essential for bone health [41, 42]. The present study demonstrated that methyl prednisolone (MP) induced bone changes is clearly associated with increased bone turnover, evidenced by the biochemical as well as the histological results

Our results showed that Methyl prednisolone (MP )decreased serum calcium levels as compared to serum calcium of the control  group. Those findings are supported by other studies where, a similar pattern of fall in serum calcium and phosphate in adrenalectomized rats [31, 43]. However, at the end of treatment, raisins treated group showed a significant increase in serum calcium levels were observed as compared to methyl prednisolone (MP) treated group. Similarly, raisins demonstrated a significant decrease in the urine calcium levels as compared to the methyl prednisolone (MP) treated group.  Probiotics in raisins may encouragethe augmentation of bone mineral content, by increasingcalcium and magnesium absorption to maintain the quality of bone [44]. Further studies have shown that oligosaccharides present in raisins can improvethe absorption and retention of mineral consequently supporting the bone mineralization [44].

In terms of the direct impact on bone, endogenous glucocorticoids at physiologic concentrations may have a role in promoting osteogenesis, while excess glucocorticoids increase osteoclastogenesis and suppress osteblastogenesis in cell culture, murine, and human models [45]. In our study, there was an increase in the number of osteoclasts in the bones of animals treated with MP as compared to the control group. Bones of rats treated with raisins showed increased trabecular bone thickness and decreased a number of osteoclasts as compared to the bones of methyl prednisolone (MP) treated group. Glucocorticoids also inhibit the formation of osteoblast and encourage osteoblasts and osteocytes apoptosis, causinga decline inbone formation [46]. These finding were evident in the present study by decrease in the number of osteocytes inside lacunae or its dark and eccentric nuclei. MP usually target trabecular bone loss in lumbar spine leading to osteoporosis, which was successfully demonstrated by H and E staining and trichrome stains. MP reduced the trabecular thickness as compared to the control group. At the end of the experiment, there was a distinct difference in the trabecular thickness of both the MP treated group and raisins treated. Those findings agree with the results obtained by others where, dried plum, apple, apricot, and grape suppressed the formation of osteoclasts in osteopenic overectomized mice [47].Furthermore, the same study showed that bone densitometry analysisapproved that dried plum, apricot and grape have protective effects for bone tissue. These biomechanical improvements, including bone strength and stiffness,influencethe bone quality.

Alkaline phosphatase (ALP) is an enzyme formed by osteoblasts;it facilitates the mineralization of bone.The earlier spreading of alkaline phosphatase at the calcification front assist the preparation function of the enzyme [48]. Our results indicate that alkaline phosphatase has been increased initially in ostoporotic group and then decreased to almost normal control group levels. Those results supported the results obtained by others [49], where the same was appeared by observing the increase levels of ALT, AST, ALP and GGT in negative control group, while doses of raisins extracts significantly decreased the levels of these four enzymes indicating protective effects of the extract. Alkaline phosphatase is produced by several cells in various tissues, such as liver, bone and kidney. Clinically, bone alkaline phosphatase has been generally accepted diagnostic enzyme for bone disease. On the other hand, serum alkaline phosphatase increases in severalnon-bone diseases and conditions, such as liver diseases[50]. However, in the presence of liver disease, the specificity of serum alkaline phosphatase measurements is improved by measuring bone alkaline phosphatase. In most other clinical situations, serum alkaline phosphatase appears to provide sufficient clinical information [51].

Osteocalcin is a protein synthesized by osteoblast; it is the most available noncollagenous protein in bone, forming about 20% of the non-collagen proteins. Like alkaline phosphatase, osteocalcin is examined clinically as anindicator of osteoblast activity; also, serum osteocalcin is a well-accepted serum marker of bone formation measured by radioimmunoassay [48]. To monitor the effect of each respective treatment on bone formation, serum osteocalcin, was measured. As expected, MP led to a significant increase in serum osteocalcin level.  Also as expected, with raisins treatment reduced bone turnover (resorption as well as formation) in osteoporotic rats, as indicated by the marked and significant decrease in serum osteocalcin to almost normal control group levels. Under normal physiological conditions, bone resorption is coupled to bone formation. Consequently, our results harmonized with the results obtained by others where, an inhibition of bone resorption, estradiol and boron treatment in ovariectomized animals, is frequently followed by a decrease in bone formation [52]. Furthermore, those results are consistent with these in human; serum osteocalcin levels in postmenopausal women supplemented with boron were significantly higher than that of control group [53]. Therefore, daily raisins intake may affect osteocalcin levels in induced osteoporosis positively.

Noteworthy, antioxidants have a great potential in preventing and reducing degenerative diseases. Therefore, consumption food rich in antioxidants may help reduce the risk of suffering from these diseases. Raisins contain many antioxidant bioactive components [see for review, 54]. Phenolic compounds in raisins provide antibacterial and antioxidant action. Several in vivo and in vitro studies have  shown the association of phenol compounds in raisins and their antioxidant properties. Our results do exclude that raisin intake may cause changes in the antioxidant defensive system,which show positive effects observed on bone.However, these conclusions needs further investigation in this context.

In conclusions:This study suggests that daily raisins intake may affect bone metabolism in methylprednisolone-induced osteoporosis positively. Raisins may contain specialbioactive compounds that have positive effects on bone. However, further investigation of the bioactive components is needed and this will consolidate this specific conclusion at this time.

References

  1. Silverman S, Curtis J, Saag K, Flahive J, Adachi J, Anderson F,Chapurlat R, Cooper C, Diez-Perez A, Greenspan S, Hooven F, Le Croix A, March L, Netelenbos JC, Nieves J, Pfeilschifter J, Rossini M, Roux C, Siris E, Watts N, Compston J, International management of bone health in glucocorticoid-exposed individuals in the observational GLOW study. Osteoporos. Int. 2015; 26(1): 419–420.
    CrossRef
  2. Balasubramanian A, Wade SW, Adler RA, Lin CJF, Maricic M, O’Malley CD, Saag K, Curtis JR. Glucocorticoid exposure and fracture risk in patients with new-onset rheumatoid arthritis. Osteoporos. Int. 2016; 27(11): 3239–3249.
    CrossRef
  3. Overman RA, Gourlay ML, Deal CL et al. Fracture rate associated with quality metric-based anti-osteoporosis treatment in glucocorticoid-induced osteoporosis. Osteoporos Int2015; 26(5): 1515–1524.
    CrossRef
  4. Overman RA, Yeh JY, Deal CL. Prevalence of oral glucocortidoid usage in the United States: a general population perspective. Arthr Care Res.2013; 65:294–8.
    CrossRef
  5. Majumdar SR, Lix LM, Morin SN et al. The disconnect between better quality of glucocorticoids-induced osteoporosis preventive care and better outcomes: a population-based cohort study. J Rheumatol2013; 40:1736–41.
    CrossRef
  6. Thomas T, Horlait S, Ringe JD et al.  Oral bisphosphonates reduce the risk of clinical fractures in glucocorticoid-induced osteoporosis in clinical practice. Osteoporos Int.2013; 24:263–9.
    CrossRef
  7. Vanderoost J, Soe K, Merrild DM, Delaisse JM, van Lenthe GH. Glucocorticoid-induced changes in the geometry of osteoclast resorption cavities affect trabecular bone stiffness. Calcif. Tissue Int. 2013; 92(3): 240–250.
    CrossRef
  8. Aaron JE, Makins NB and Sagreiya K. The microanatomy of trabecular bone loss in normal aging men and women. Clinical Orthopedic and Related Research 1987; 215: 260-271
    CrossRef
  9. Palacios c. The Role of Nutrients in Bone Health, from A to Z. Critical Reviews in Food Science and Nutrition 2006; 46: 621–628.
    CrossRef
  10. Rizzoli R, Adachi JD, Cooper C et al. . . . Management of glucocorticoid-induced osteoporosis. Calcif Tissue Int. 2012; 91:225–43.
    CrossRef
  11. Kucukkurt I, Akbel E, Karabag F, Ince S. The effects of dietary boron compounds in supplemented diet on hormonal activity and some biochemical parameters in rats.Toxicol Ind. Health 2015;31:255–260
    CrossRef
  12. Ince S, Kucukkurt I, Demirel HH, Acar oz DA, Akbel E, Cigerci H. Protective effects of boron on cyclophosphamide induced lipid peroxidation and genotoxicity in rats. Chemosphere 2014;108:197–204
    CrossRef
  13. Ince S, Keles H, Erdogan M, Hazman O, Kucukkurt I. Protective effect of boric acid against carbon tetrachloride- ınduced hepatotoxicity in mice. Drug Chem Toxicol 2012; 35:285–292.
    CrossRef
  14. Ince S, Kucukkurt I, Cigerci IH, Fidan AF, Eryavuz A. The effects of dietary boric acid and borax supplementation on lipid peroxidation, antioxidant activity, and DNA damage in rats. J Trace Elem Med Biol. 2010; 24:161–164.
    CrossRef
  15. Devirian TA, Volpe SL. The physiological effects of dietary boron. Crit Rev Food Sci Nutr. 2003; 43: 219-31.
    CrossRef
  16. Pawa S, Ali S. Boron ameliorates fulminant hepatic failure by counteracting the changes associated with the oxidative stress. Chem Biol Interact. 2006; 160: 89-98.
    CrossRef
  17. Davoud Ghorbanian, Mohammed Gol, Mohsen Pourghasem, Jamshid Faraji, Kaveh Pourghasem, and  Nabiollah Soltanpour. Spatial Memory and Antioxidant Protective Effects of Raisin (Currant) in Aged Rats. Prev Nutr Food Sci. 2018; 23(3): 196–205.
    CrossRef
  18. O’Grady J, O’Connor EM, Shanahan F. Review article: Dietary fibre in the era of microbiome science. Aliment. Pharmacol. Ther. 2019; 49: 506–515.
    CrossRef
  19. Jeszka-Skowron M, Zgoła-Grze´skowiak A, Stanisz E, Wa´skiewicz A. Potential health benefits and quality of dried fruits: Goji fruits, cranberries and raisins. Food Chem. 2017; 221: 228–236.
    CrossRef
  20. Fanelli, F, Cozzi G, Raiola A, Dini I, Mulè G, Logrieco AF, Ritieni A. Raisins and currants as conventional nutraceuticals in Italian market: Natural occurrence of ochratoxin A. J. Food Sci. 2017; 82: 2306–2312.
    CrossRef
  21. Vallverdú-Queralt, A.; Regueiro, J.; Alvarenga, J.F.R.; Martinez-Huelamo, M.; Leal, L.N.; Lamuela-Raventos, R.M. Characterization of the phenolic and antioxidant profiles of selected culinary herbs and spices: Caraway, turmeric, dill, marjoram and nutmeg. Food Sci. Technol. 2015, 35, 189–195.
    CrossRef
  22. Kelebek, H, Jourdes M, Selli S, Teissedre PL. Comparative evaluation of the phenolic content and antioxidant capacity of sun-dried raisins. J. Sci. Food Agric. 2013; 93: 2963–2972.
    CrossRef
  23. Di Lorenzo C, Frigerio G, Colombo F, de Sousa LP, Altindisli A, Dell’Agli M, Restani P. Phenolic profile and antioxidant activity of different raisin (Vitis vinifera L.) samples. BIO Web Conf. 2016; 7: 1–7
    CrossRef
  24. Parker TL, Wang XH, Pazmiño J, Engeseth NJ. Antioxidant capacity and phenolic content of grapes, sun-dried raisins, and golden raisins and their effect on ex vivo serum antioxidant capacity. J. Agric. Food Chem. 2007; 55: 8472–8477.
    CrossRef
  25. Camire ME, Dougherty MP. Raisin dietary fiber composition and in vitro bile acid binding. J. Agric. Food Chem. 2003; 51: 834–837.
    CrossRef
  26. Li YO, Komarek AR. Dietary fibre basics: Health, nutrition, analysis, and applications. Food Qual. Saf. 2017; 1: 47–59.
    CrossRef
  27. Uchida K, Nakajima H, Miyazaki T, Yayama T, Kawahara H, Kobayashi S, et al. Effects of alendronate on bone metabolism in glucocorticoid-induced osteoporosis measured by18F-fluoride PET: A prospective study. J Nucl Med. 2009; 50:1808-14.
    CrossRef
  28. Nansie A, McHugh NA, Vercesi HM, Egan RW, Hey JA.In vivo rat assay: Bone remodeling and steroid effects on juvenile bone by pQCT quantification in 7 days. Am J Physiol Endocrinol Metab. 2003; 284:E70-5.
    CrossRef
  29. Wang Y, Ohtsuka-Isoya M, Shao P, Sakamoto S, Shinoda H. Effects of methylprednisolone on bone formation and resorption in rats. Jpn J Pharmacol. 2002; 90:236-46.
    CrossRef
  30. Hayman AR, Bune AJ, Bradley JR, Rashbass J, Cox TM. Osteoclastic tartrate-resistant acid phosphatase (Acp 5): Its localization to dendritic cells and diverse murine tissues. J Histochem Cytochem. 2000; 48:219-28.
    CrossRef
  31. Mahgoub A, Hirsch PF, Munson PL. Calcium-lowering action of glucocorticoids in adrenalectomized-parathyroidectomized rats. Specificity and relative potency of natural and synthetic glucocorticoids. Endocrine. 1997; 6:279-83.
    CrossRef
  32. Akhtar B, Mahto RR, Dave AR, Shukla VD. Clinical study on Sandhigata Vata w.s.r. to oste Caplan, A., Fett, N., Rosenbach, M., Werth, V. P. & Micheletti, R. G. Prevention and management of glucocorticoid-induced side effects: a comprehensive review: a review of glucocorticoid pharmacology and bone health. J. Am. Acad. Dermatol. 2017; 76: 1–9.
  33. Vandewalle J, Luypaert A, De Bosscher K and Libert C. Therapeutic mechanisms of glucocorticoids. Trends Endocrinol. Metab. 2018; 29: 42–54.
    CrossRef
  34. Mazziotti G, Angeli A, Bilezikian JP, Canalis E & Giustina A. Glucocorticoid-induced osteoporosis: an update. Trends Endocrinol. Metab. 2006; 17: 144–149.
    CrossRef
  35. James Jam Jolly, Kok-Yong Chin, Ekram Alias, Kien Hui Chua and Ima Nirwana Soelaiman. Protective Effects of Selected Botanical Agents on Bone Int. J. Environ. Res. Public Health. 2018; 15: 963
    CrossRef
  36. Jennette Higgs, Emma Derbyshire, Kathryn Styles. Nutrition and osteoporosis prevention for the orthopaedic surgeon: a wholefoods approach EFORT Open Rev. 2017; 2(6): 300–308.
    CrossRef
  37. Arianna Carughi, Thea Lamkin and Dalia Perelman, RD. Health Benefits of Sun-Dried Raisins Review of the Scientific Literature Health Research & Studies Center July 2008. http://www.raisins.net /Raisins_and_ Health_200810.pdf
  38. Nora M Al-aboud. Effect of Red Raisins (Vitis Vinifera L.) Intake on the Level of Some Hematological Tests in a Group of Female Volunteers . Biomed J Sci & Tech Res. 2018; 2 (3): 2659-2665
    CrossRef
  39. Rubin MR & Bilezikian JP. Clinical review 151: the role of parathyroid hormone in the pathogenesis of glucocorticoid-induced osteoporosis: a re-examination of the evidence. J. Clin. Endocrinol. Metab. 2002; 87: 4033–4041.
    CrossRef
  40. Forrest H, NielsenCurtiss D, HuntLoanne M, Mullen Janet R. Hunt Effect of dietary boron on mineral, estrogen, and testosterone metabolism in postmenopausal women.FASEB Journal. 1987;1 (5): 394-39
    CrossRef
  41. Cristina Palacios, The Role of Nutrients in Bone Health, from A to Z Critical Reviews in Food Science and Nutrition. 2006; 46:621–62
    CrossRef
  42. Tara A Devirian & Stella L Volpe. The Physiological Effects of Dietary Boron.Critical Reviews in Food Science and Nutrition.  2003;43(2): 219-23
    CrossRef
  43. Claudia D’Alessandro, Pietro Manuel Ferraro, Caterina Cianchi, Massimiliano Barsotti, Giovanni Gambaro and Adamasco Cupisti. Which Diet for Calcium Stone Patients: A Real-World Approach to Preventive Care. Nutrients . 2019; 11: 118
    CrossRef
  44. Corrie M. Whisner, Luisa F. Castillo Prebiotics, Bone and Mineral Metabolism. Calcif Tissue Int. 2018; 102:443–47
    CrossRef
  45. Emory Hsu and Mark Nanes . Advances in Treatment of Glucocorticoid-Induced Osteoporosis. Curr Opin  Endocrinol Diabetes Obes. 2017; 24(6): 411–41
    CrossRef
  46. Charles A O’brien, Dan Jia, Lilian I Plotkin, Teresita Bellido, Cara C Powers, Scott A Stewart, Stavros C Manolagas and Robert S Weinstein. Glucocorticoids Act Directly on Osteoblasts and Osteocytes to Induce Their Apoptosis and Reduce Bone Formation and Strength. Endocrinology. 2004; 145(4):1835–184
    CrossRef
  47. Elizabeth Rendina, Kelsey D Hembree, McKale R Davis, Denver Marlow, Stephen L Clarke, Bernard P Halloran , Edralin A Lucas , Brenda J Smith. Dried Plum’s Unique Capacity to Reverse Bone Loss and Alter Bone Metabolism in Postmenopausal Osteoporosis Model. PLOS ONE. 2013; 8 (3): 1-
    CrossRef
  48. Aiman I Al-Qtaitat, Saed M Aldalaen. A review of non-collagenous proteins; their role in bone. American Journal of Life Sciences. 2014; 2(6): 351-355
    CrossRef
  49. Shamim A Qureshi, Uzma Imran, Tooba Lateef , Muhammad Bilal Azmi, Sumera Rais, Hina Akram Mudassir, Musarrat Jahan , Syed Muhammad Shabib Zaidi, Rabia Badar and Dildar Ahmed. Raisins: A kitchen cabinet item can restores the liver function and structure. Pak. J. Pharm. Sci. 2020;33(4):1787-1794
  50. Brommage R, Allison C, Stavisky R, Kaplan J. Measurement of serum bone-specific alkaline phosphatase activity in cynomolgus macaques. J Med Primatol 1999; 28:329-333
    CrossRef
  51. Henning W, Woitge, Markus J. Seibel, and Reinhard. Comparison of total and bone-specific alkaline phosphatase in patients with nonskeletal disorders or metabolic bone diseases. Clinical Chemistry. 1996; 42(11): 1796-1804
    CrossRef
  52. Matilda Hc. Sheng L, Janette Taper, Hugo Veit, Elizabeth A. Thomas, Sanford J Ritchey, and Kh William Lau. Dietary Boron Supplementation Enhances the Effects of Estrogen on Bone Mineral Balance in Ovariectomized Rats Biological Trace Element Research.  2001;81P: 29-4
    CrossRef
  53. Boyacioglu O, Orenay-Boyacioglu S, Yildirim H, Korkmaz M. Boron intake, osteocalcin polymorphism and serum level in postmenopausal osteoporosis. J Trace Elem Med Biol. 2018;48:52–
    CrossRef
  54. Olmo-Cunillera, Danilo Escobar-Avello, Andy J Pérez, María Marhuenda-Muñoz, Rosa M Lamuela-Raventós and Anna Vallverdú-Queralt. Is Eating Raisins Healthy? Alexandra Nutrients. 2020; 12 (1): 54.
    CrossRef

Biosynthesis and Characterization of Silver Nanoparticles using Ziziphus Mauritiana Leaf Extract

$
0
0

Introduction

Nanotechnology has turned into a prominent zone of the revolutionary interdisciplinary research that manages structure, synthesis, and manipulation of nano sized particles. It has an immense potential for use in various applications such as drug gene delivery, biomedical sciences, and mechanics (Shanmuganathanet al., 2018). However, research on nanoparticles (NPs) still gainingimmense interest towards different synthesis methods and applications (Ghiassiet al., 2018). Traditionally, chemical and physical syntheses of NPs yield byproducts that are dangerous and unsafe to environment; also, these methods are not efficient (Mancuso et al., 2020). Keeping this view, researchers focus to use‘green engineering science’ that incorporates a wide scope of potential applicationswith ecologically friendly.It also provides procedure that lessen squander items and pollution (Bankaret al., 2010; Begumet al., 2018; Farzanehet al., 2020). Therefore, green synthesis gains an immense interest, which includes the utilization of ecofriendly compatible materials such as bacteria, fungi, and plants (Ahmad et al., 2010;Farzanehet al., 2020). In this manner, green synthesis forproduction of NPs is developing rapidly that fills as a critical strategy for growing clear, safe, and eco-accommodating methodology for the synthesis metal NPs (Yallappaet al., 2013). Benefits of green synthesis of NPs over conventional methods include being economical and easy to regulate. Besides it produces less wastage, is an energy-efficient procedure, has decreased rates of fewer accidents, yields safe products, is competitive, and contributes to healthier workplaces and communities (Kumar et al., 2016). Nature has structured various strategies for the synthesis of nano- and micro-sized inorganic materials. They help being developed of a novel and uninvestigated area zone of research dependent on the green synthesis of NPs (Mandalet al., 2018). Numerous works have been distributed on the green synthesis of NPs utilizing microorganisms such as fungi, bacteria, and plants, because of their diminishing qualities that lead to the decrease of metal compounds to respective NPs (Mittal et al., 2017). Among many NP biosynthesis methods, microbe-mediated synthesis is not thought to be feasible on industrial scale as it requires high aseptic conditions and a considerable maintenance (Sinha et al., 2015). Accordingly, plant extract uses for this reason is conceivably valuable over microbes because of the simplicity of the less biohazard and opportunity from expand procedure of keeping up cell cultures (Pambuket al., 2019; Setegnet al., 2020). In such a way, plant extracts provide a better platform for synthesis of NPs as it skipsthe use of harmful chemicals and yields natural capping agents (Obaid et al., 2015; Sasikalaet al., 2015; Ganjkhanlu and Sara, 2019). Among the different important NPs, silver NPs are becoming a quite significant product as they have gained huge interest because of their novel characteristics like chemical stability, excellent conductivity, catalytic activity, and antifungal, antibacterial, and antiviral properties (Parmar et al., 2011; Sureshet al., 2020). On account of their good anti-inflammatory activities, silver NPs can be consolidated into various applications, for example, cryogenic superconducting materials and composite fibers, into cosmetics, and into electronic parts as well. They exhibit extensive biocidal action against microorganisms by disrupting their unicellular membrane (Sutradhar and Saha, 2015). As a consequence, it has huge potential in biomedical applications such as topical creams, antiseptic sprays, fabrics, and wound dressings. A few investigations have been led on the utilization of plant concentrates to blend silver NPs. Several phytocompounds acquired from leaf extracts of Solidago altissima(Kumar et al., 2016), Acalypha indica (Krishnarajet al., 2010; Sorbiunet al., 2018),Murrayakoenigii (Christensen et al., 2011, Al-Quwaieet al., 2020), Xanthium strumariumL. (Mittal et al., 2017), seed extricate of Acacia farnesiana(Yallappaet al., 2013), Ocimum sanctum (Ahmad et al., 2010), root extracts of Trianthemadecandra(Geethalakshmi and Sarada, 2012), Macrotyloma uniflorum (Vidhu et al., 2011), fruit extricate of Musa paradisiaca peels (Bankaret al., 2010), Carica papaya (Jain et al., 2009), and stem extracts of O. sanctum (Ahmad et al., 2010; Farzanehet al., 2021) to fill in as diminishing or/and topping specialists reaction with silver nitrate (AgNO3) as precursor have been studied. In any case, plausibility of plants to be utilized as organic materials for synthesizing NPs has not been totally considered.

Among the members of the family Rhamnaceae, plants of genus Ziziphus have been utilized for a long time due to their medicinal and nutritive properties (Sutradhar and Saha, 2015, Khataket al., 2020). They are common plants that are mostly available throughout the world. There are about 40 species available in genus Ziziphus. Among them, Z. mauritiana is the one that mostly grows in dry places and has abundant amount of starch, sugar, carbohydrate, mucilage, proteins, and vitamins (Parmar et al., 2011). The dried ripe fruit of this plant is a mild laxative and fruits are used for treating depression, diabetes, and ulcers (Lopez et al., 2018). It is utilized as a medicine in fevers and the leaves of this plant are useful in liver problem and asthma. Also, the powder of its leaves is applied on wounds. It is appeared to have antioxidant, antimicrobial, antitumor, and anticancer activities, consequently demonstrated to be one among the most encouraging plants to be utilized for phytomedicinal applications (Parmar et al., 2011).Recently, Z. mauritianaleaves were used for biosynthesis of copper oxide (CuO) andgold NPs.Using this plant material, silver NPs were not yet synthesized by biological method using aqueous extract of Ziziphus mauritianaL. leaves as a reducing and stabilizing agent. In this study, Z. mauritianaleaves was used as plant source for biosynthesis of silver NPs. Further, integrated NPs were portrayed by various techniques.

Methodology

Preparation of Plant Extract

Every single fine chemical from Merck (Mumbai, India)and solvents, and media used in this investigation were acquired from HiMedia (Mumbai, Maharashtra, India) and of AR grade. Every one of the arrangements were made in sterile Milli-Q water. Commonly, a plant-extract-mediated biosynthesis of NPs incorporates blending the watery plant separate with a fluid solution of the suitable metal salt. Here, Z. mauritiana leaf concentrate was utilized to get ready silver NPs thinking about simplicity of availability, cost-effectiveness, and medicinal properties. Z. mauritianaleaves are alternate and elliptic. Flowers are small and bisexual. The leaves are about 2.5 – 3.2 cm long. Fresh leaves were collected from Hussain Sagar Road, Hyderabad district, Telangana, India, in the month of January. They were surface-cleaned by tap water followed by double-distilled water to remove contaminated organic contents and other debris. Additionally, they were parched at room temperature and turned into a fine powder utilizing an electric blender. About 10 g of the powder was overflowed with 150 mL double-distilled water for 30 min at 70-80 °C and was hatched overnight. The extract was chilled off and sifted with Whatman Filter Paper Number 1. The filtrate was centrifuged at 13000 rpm for 3 minutes and the supernatant was utilized for the further explores.

Biosynthesis of Silver NPs

Initially, 500 mL, 1 mM (0.08 g silver nitrate was disintegrated in 500 mL distilled water to prepare 1 mM solution of AgNO3) solution of silver nitrate was set up in an Erlenmeyer flask. Thereafter, 50 mL aqueous extract of Z. mauritiana leaves was mixed with 500 mL AgNO3 solution. The solution mixture was heated on a mantle at 70-80 °C for 30 min. To maintain a strategic distance from photo-activation, the solution was brooded in a dim chamber at room temperature overnight. Decrease of Ago from Ag+was affirmed by the adjustment in color of the solution, from colorless to brown. After medium-term incubation, the mixture was centrifuged at 12000 rpm for 4 minutes. Supernatant was isolated and the pellets were washed two times with twofold refined water. Further, particles were secluded by presenting to centrifugation again at 12000 rpm for 3 min. The washed pellets were collected in a watch glass and left to dry in a hot-air oven at 30-42 °C. After totally drying out, the AgNPs, which seemed dim dark colored, were scratched utilizing a surgical tool and put away in a cool dry spot.

Characterization of Silver NPs

Fundamentally, the silver NPs synthesized from the Z.mauritiana leaf extract were portrayed by UV–Vis spectral analysis, which was completed by using a UV–Vis spectrophotometer (UV-1800 Model; Shimadzu, Japan) with goals of 1 nm somewhere in the scope of 300 and 600 nm with de-ionized water as clear. At that point, 1 mL sample was lay hold of test tube and in this way dissected at room temperature. Dynamic light dispersing (Spectroscatter 201) was done to choose the ordinary size of blended silver NPs. Fourier-transform infrared spectroscopy (FTIR) was utilized to distinguish the conceivable biomolecules present that are in charge of keeping up the dependability, capping, and formation of silver NPs in the Z. mauritiana aqueous leaf extract. It likewise decided the potential physiochemical connections among the components of the extract. The estimations were taken for the synthesized silver NPs after 24 h incubation using an FTIR spectrophotometer (8400S; Shimadzu) with a wavelength scope of 4000–500 cm1 and resolution of 4 cm−1. The examples were joined into KBr pellets to gain the spectra. The got outcomes were looked at for computing shift in functional peaks of critical value. The morphology of the synthesized silver NPs was contemplated by a SEM (S-3700N; Hitachi, Japan). The crystalline reality of the synthesized silver NPs was investigated using an X-ray diffractometer (XRD700 Model; Shimadzu) with K-beta filter, using monochromatic Cu Kα radiation of wavelength 1.5418 Å. The X-ray generator was worked at 30 mA and 40 KV, and the checking mode was nonstop with scanning range (2θ) from 4 o to 90o.

Results and Discussion

Visual Monitoring and UV-Vis Spectroscopy

It is notable that silver NPs display a solid retention band in the obvious region. In this analysis, expansion of plant extract of Z. mauritiana to aqueous solution of silver nitrate prompted the adjustment in the color of the blend from yellowish to rosy dark colored (reddish brown). The imaged properties of silver NPs were examined by UV–Vis assimilation spectroscopy. The Plasmon resonance reverberation band distinguished at 400-430 nm is practically like that revealed by Obaid et al. in 2015, and is delineated in Figure 1. The slight varieties in the estimations of absorbance imply that there is adjustment in particle size. The reddish brown color showed up because of the excitation of the surface plasmon resonance (SPR). Silver NPs having absorbance esteems in the visible scope of 410-448 nm have been accounted for somewhere else. The examined tests displayed a strong and steady noticeable ingestion spire in the scope of 413 nm (Figure 2) because of excitation of SPR. The results are near the reports introduced in literature demonstrating absorbance crest at 413 nm for silver NPs combined by Cochlospermumreligiosum extricate (Sasikalaet al., 2015) and by Pithophoraoedogonia extract (Sinha et al., 2015).

Vol17No4_Bio_Nee_fig1 Figure 1: Surface plasmon resonance peak for biosynthesized silver nanoparticles

Click here to view figure

X-ray Diffraction Analysis

So as to check the aftereffects of the UV–V is spectral analysis, the examples of the synthesized silver NPs were analyzed by X-ray diffraction (XRD). Figure 2 outlines the XRD pattern for silver NPs. The diffractogram comprised of four distinct reflections at 38.01° (1 1 1), 44.35° (2 0 0), 64.39° (2 2 0), and 77.37° (3 1 1). Consequently, the XRD result affirmed the crystalline nature of the sample. The XRD pattern additionally demonstrated a peak at 31.67°. This might be because of the presence of other organic compounds of the leaf extract or crystalline impurities present on the surface of silver NPs. For example, a few investigations describing green synthesis of silver NPs using plant extracts by XRD analysis have likewise revealed the presence of comparable additional peaks in the XRD pattern of silver NPs.

Vol17No4_Bio_Nee_fig2 Figure 2: XRD pattern of silver NPs synthesized using Z. mauritiana.

Click here to view figure

Table 1: Values of diffraction peaks in the range of 2θ and FWHM

Sl. No. 2θ (deg) FWHM (deg)
1 31.673 (8) 0.10 (3)
2 38.014 (14) 0.563 (16)
3 44.35 (4) 1.15 (4)
4 64.39 (2) 0.47 (4)
5 77.377 (15) 0.44 (4)

Scanning Electron Microscope Studies

Figure 3 demonstrates the images of SEM synthesized silver NPs, which uncovers that a large portion of the silver NPs are predominately round with smooth surface, and the particles are in the scope of 4-96 nm. Additionally, the examination utilizing SEM showed that the totals of silver NPs were very much scattered in a balanced out structure as they were in indirect contact with each other because of plant-capping agents. Using software, ImageJ, it was discovered that the averageparticle size was about 13.25 nm.

Vol17No4_Bio_Nee_fig3 Figure 3: Scanning electron microscopy image indicating the size of the biosynthesized silver nanoparticle

click here to view figure

FTIR Spectroscopy Studies

The results of the synthesized NPs from FTIR were looked at for figuring the move in functional peaks of critical value. The spectrum is spoken to in Figure 4. The FTIR spectrum studies of the Z.mauritiana leaf extract shows various bands, which uncovers a perplexing nature of the leaf extract. An aggregate of 41 pinnacles were watched,  among which 3 sharp peaks were seen at 3417.98, 3444.98, and 1629.90 cm1 relating to the O-H stretch of the alcohol, N-H stretch of amides, ArO-H H-bonded phenol compound, and Ar-CH=CHR compound of alkenes, as appeared in Figure 4. Likewise, the outcomes were analyzed using IRPal2.0 software. Peak value and the functional groups present in leaf extracts of Z. mauritiana obtained by FTIR studies are shown in Table 2. They demonstrate the presence of natural mixes containing carbon and oxygen, along these lines proposing that silver may be topped by organic components of plant extract, stabilizing them and further upgrading their antimicrobial activity. The shifting of bands at 3444.12 and 1629.90 implies the presence of organic components such as phenols, alcohols, alkenes, and primarily primary amines of the plant associated with the decrease procedure for arrangement of silver NPs. Carboxyl groups, a middle formation of phenolic gatherings, proteins, and carbohydrates of Z. mauritiana leaf extract are associated with the decrease forms for synthesis of silver NPs.Silver NPs are built up as antimicrobial agents, while the presence of plant bioorganic capping material on the silver NPs gives them improved antibacterial movement and potential to be utilized as antioxidant agents.

Vol17No4_Bio_Nee_fig4 Figure 4: FTIR pattern of AgNPs synthesized using Z. mauritiana

Click here to veiw figure

Table 2: FTIR peak value and its functional groups present in leaf extracts of Z. mauritiana

Peak Range Bond  Compound   Structure
       3444 3600-3400 O–H stretch Alcohols RCH2OH
3600-3400 O–H stretch Alcohols R2CHOH
3600-3400 O–H stretch Alcohols R3COH
3445-3435 NH- stretch Amides RCONHR
3500-3200 ArO–H H-bonded Phenols ArO–H bonded
3417 3600-3400 O – H stretch Alcohols RCH2OH
3600-3400 O – H stretch Alcohols R2CHOH
3600-3400 O – H stretch Alcohols R3COH
3500-3200 ArO–H H-bonded Phenols ArO–H bonded
1629 1640-1600 NH out of plane Amides RCONH2
1630-1620 Ar–CH=CHR Alkenes Ar–CH=CHR
1700-1615 C=N C=N

Conclusion

The improvement of cost-efficient and eco-friendly methods for synthesis of nanomaterials still stays a scientific logical challenge. In this study, Z. mauritiana plant leaf extract was effectively used as a diminishing and balancing out agent for consistent and quick synthesis of silver NPs. Silver NPs were synthesized by a clean, nontoxic, low-cost, and eco-friendly method. The green blend of silver NPs was performed by mixing Z. mauritiana leaf extract with 1 mM AgNO3 at 70-80 °C for 30 minutes. The spectroscopic portrayals from UV–Vis, FTIR, SEM, and XRD bolster the development and dependability of the biosynthesized silver NPs. The results of UV–Vis qualitative analysis confirmed the existence of silver as a result of the actual peak in the 400–430 nm region.The SEM analysis affirmed spherical and uniform silver NPs with broadness varying from 4 to 96 nm. This is a simple, proficient, and quick technique for green synthesis of silver NPs that can be utilized in various biomedical and biotechnological applications. Such sort of studies, for instance, production of NPs using plant extracts, which are used for mediating the NPs for rapid single-step protocol, can beat a several environmental issues and can give another dimension to green synthesis of silver NPs.

Acknowledgement

Authors are thankful to Sreenidhi Institute of Science and Technology, Hyderabad, and Addis Ababa Science and Technology University, Ethiopia for providinglaboratory support.

Conflict of Interest

Authors assure to disclose there is no conflict of interest including honorarium, grants, membership, employment, ownership of stock or non‐financial interest.

References

  1. Abdelghany T. M, Al-Rajhi A. M. H, Al-Abboud M. A, Alawlaqi M. M, Magdah A. G, Helmy E. A. M, Mabrouk A. S. Recent advances in green synthesis of silver nanoparticles and their applications: about future directions. A review. Nano Science. 2018;8(3):5-12.
    CrossRef
  2. Ahmad N, Sharma S, Alam M. K, Singh V, Shamsi S, Mehta B, and Fatma A. Rapid synthesis of silver nanoparticles using dried medicinal plant of basil. Colloids and Surfaces B: Biointerfaces. 2010;81(1):81.
    CrossRef
  3. Al-Quwaie D. A. H. Extracorporeal Circuit Device for Camel Antibodies Production from Blood Using Magnetic Nanoparticles. Biosci. Biotech. Res. Asia. 2020;17(1): 127-132
    CrossRef
  4. Bankar A, Joshi B, Kumar A. R, Zinjarde S. Banana peel extract mediated novel route for the synthesis of silver nanoparticles. Surf. A. 2010;368(1):58.
    CrossRef
  5. Begum S. R, Rao D. M, Reddy P. D. S. Role of Green Route Synthesized Silver Nanoparticles in Medicinal Applications with Special Reference to Cancer Therapy. Biosci. Biotech. Res. Asia. 2018;15(4): 783-790
    CrossRef
  6. Christensen L, Vivekanandhan S, Misra M, Mohanty A. K. Biosynthesis of silver nanoparticles using Murrayakoenigii (curry leaf): an investigation on the effect of broth concentration in reduction mechanism and particle size. Adv. Mater. Lett. 2011;2(6):429.
    CrossRef
  7. Farzaneh M, Saeid T. F, Ali R, Samira O, Ilnaz A.  Green sol–gel synthesis of CoMnCrO4 spinel nanoparticles and their photocatalytic application. Micro & Nano Letters. 2020;15(10);674.
    CrossRef
  8. Farzaneh M, Saeid T. F,Ali R,Vinod K. G. Green synthesis of recyclable MgFeCrO4 spinel nanoparticles for rapid photodegradation of direct black 122 dye. Photochem. Photobiol. A. 2020;392(1):1
    CrossRef
  9. FarzanehM,SaeidT. F,Ali R.B,Sang W,Rajender S.V. Magnetic Mg0.5Zn0.5FeMnO4 nanoparticles: Green sol-gel synthesis, characterization, and photocatalytic applications, J. Clean. Prod, 2021;288(3):125632
    CrossRef
  10. Ganjkhanlu, Sara. Biosynthesis of MgFe2O4 magnetic nanoparticles and its application in photo-degradation of malachite green dye and kinetic study, Nanochemistry Research. 2019;4(1): 86-93.
  11. Geethalakshmi R, Sarada D. Gold and silver nanoparticles from Trianthemadecandra: synthesis, characterization, and antimicrobial properties. J. Nanomedicine. 2012;7(6):5375.
    CrossRef
  12. Ghiassi S, Sedaghat S, Mokhtary M, Kefayati H. Plant-mediated biosynthesis of silver-montmorillonite nanocomposite and antibacterial effects on gram-positive and negative bacteria. Nanostructure. Chem. 2018;8(3):353.
    CrossRef
  13. Jain D, Daima H. K, Kachhwaha S, Kothari S. L. Synthesis of plant-mediated silver nanoparticles using papaya fruit extract and evaluation of their anti-microbial activities. J. Nanomater. Bios. 2009;4(3):557.
  14. Kathiravan V.Green synthesis of silver nanoparticles using different volumes of Trichodesma indicum leaf extract and their antibacterial and photocatalytic activities. Chem. Intermediat. 2018;44(9):4999.
    CrossRef
  15. Khatak S, Wadhwa N, Jain P. Probiotics: An Alternative Therapeutic Strategy for Covid-19. Biosci. Biotech. Res. Asia. 2020;17(4): 674.
    CrossRef
  16. Krishnaraj C, Jagan E. G, Rajasekar S, Selvakumar P, Kalaichelvan P. T, Mohan N. Synthesis of silver nanoparticles using Acalypha indica leaf extracts and its antibacterial activity against water borne pathogens. Surf. B. 2010;76(1):50.
    CrossRef
  17. Kumar V. A, Uchida T, Mizuki T, Nakajima Y, Katsube Y, Hanajiri T, Maekawa T. Synthesis of nanoparticles composed of silver and silver chloride for a plasmonic photocatalyst using an extract from a weed Solidago altissima (goldenrod). Nat. Sci-Nanosci. 2016;7(1):0150.
    CrossRef
  18. Lopez-Miranda L. J, Vazquez Gonzalez M. A, Mares-Briones F, Cervantes-Chavez J. A, Esparza R, Rosas G, Perez R. Catalytic and antibacterial evaluation of silver nanoparticles synthesized by a green approach. Chem. Intermediat. 2108;44(12):7479.
    CrossRef
  19. Mancuso L, Manis C, Murgia A, Isola M, Salis A, Piras F, Caboni P, Cao G. Effect of Zno Nanoparticles on Human Bone Marrow Mesenchymal Stem Cells: Viability, Morphology, Particles Uptake, Cell Cycle and Metabolites. Biosci. Biotech. Res. Asia. 2018;15(4).
    CrossRef
  20. MandalP, GhoshS. Green synthesis of poly (vinyl alcohol)–silver nanoparticles hybrid using Palash (Butea monosperma) flower extract and investigation of antibacterial activity. Bull. 2018;75(5):1949.
    CrossRef
  21. Milorad C, Glisic S, Cvetkovic D, Miroslav C, Ljiljana S, Bojana D,Katarina C. Green synthesis, characterization and antimicrobial activity of silver nanoparticles produced from Fumaria officinalis L.plant extract. J. 2018;80(2):803.
    CrossRef
  22. Mittal J, Jain R, Sharma M. M. Phytofabrication of silver nanoparticles using aqueous leaf extract of Xanthium strumerium L. and their bactericidal efficacy. Nat. Sci-nanosci. 2017; 8(2):1.
    CrossRef
  23. Obaid A. Y, Al-Thabaiti S. A, Al-Harbi L. M, Khan Z. Extracellular bio-synthesis of silver nanoparticles. Global Advanced Res. J. of Microb. 2015;3(8):11.
  24. Pambuk C. I. A, Muhammad F. M. Nanoparticles in Medicine: Applications and Hope. Biosci. Biotech. Res. Asia. 2019;16(3).
    CrossRef
  25. Parmar P, Bhatt S, Dhyani S, Jain A. Phytochemical studies of the secondary metabolites of Ziziphus mauritiana Lam. leaves. J. Curr. Pharm. Res. 2011;4(3):153.
  26. Sasikala A, Linga Rao M, Savithramma N, Prasad T. N. V. K. V. Synthesis of silver nanoparticles from stem bark of Cochlospermumreligiosum (L.) Alston: an important medicinal plant and evaluation of their antimicrobial efficacy. Nanosci. 2015;5(7):827.
    CrossRef
  27. Setegn G. A, Fedlu K. S, Dinsefa M. A, Osman A. Z.Green synthesis of p-Co3O4/n-ZnO composite catalyst with Eichhornia Crassipes plant extract mediated for methylene blue degradation under visible light irradiation. Mater. Res. Express. 2020;7(2):95508
    CrossRef
  28. Shaikh A. E, Satardekar K. V, Khan R. R, Tarte N. A. Silver nanoparticles: green synthesis using Phoenix dactylifera fruit extract, characterization, and anti-oxidant and anti-microbial activities. Nanosci. 2018;8(3):407.
    CrossRef
  29. Shanmuganathan R, Ali D. M, Prabakar D, Muthukumar H, Thajuddin N, Kumar S. S, Pugazhendhi, A. An enhancement of antimicrobial efficacy of biogenic and ceftriaxone-conjugated silver nanoparticles: green approach. Sci. Pollut. Res. 2018;25(11):10362.
    CrossRef
  30. Sinha S. N, Paul D, Halder N, Sengupta D, Patra S. K. Green synthesis of silver nanoparticles using fresh water green alga Pithophoraoedogonia (Mont.) Wittrock and evaluation of their antibacterial activity. Nanosci. 2015;5(6):703.
    CrossRef
  31. Sorbiun M, Mehr E. S, Ramazani A, Fardood S. T. Green synthesis of zinc oxide and copper oxide nanoparticles using aqueous extract of oak fruit hull (Jaft) and comparing their photocatalytic degradation of basic violet 3. J. Environ. Res. 2018;12(1):29.
    CrossRef
  32. Suresh G, Trupti P, Shreyas P, Rajeshwari O, Dhananjay M, Prashant K. Plant Extract Assisted Eco-benevolent Synthesis of Selenium Nanoparticles- A Review on Plant Parts Involved, Characterization and Their Recent Applications, J.Chem.Rev. 2020;2(3):157.
  33. Sutradhar P, Saha M. Size-controlled synthesis of silver nanoparticles using Zizyphusmauritiana fruit extract. Main Group Chem. 2015;15(1):47.
    CrossRef
  34. Vanlalveni C, Rajkumari K, Biswas A, Adhikari P. P, Lalfakzuala R, Lalthazuala R. Green synthesis of silver nanoparticles using Nostoclinckia and its antimicrobial activity: a novel biological approach. Bionanoscience. 2018;8(2):624.
    CrossRef
  35. Vidhu V, Aromal S. A, Philip D. Green synthesis of silver nanoparticles using Macrotyloma uniflorum. Acta.A. 2011;83(1):392.
    CrossRef
  36. Yallappa S, Manjanna J, Peethambar S, Rajeshwara A, Satyanarayan N. Green synthesis of silver nanoparticles using Acacia farnesiana (sweet acacia) seed extract under microwave irradiation and their biological assessment. Clust sci. 2013;24(4):1081.
    CrossRef

Effect of Drupe size Grading on in Vivo and in Vitro Germination and its Dormancy Mechanism of Teak (Tectona grandis Linn. F)

$
0
0

Introduction

Teak (Tactona grandis Linn.f) is one of the most durable and highly preferred plantation timber species which is indigenously distributed in four countries (Myanmar, Lao PDR, Thailand and India) across the globe1.  Internationally traded teak timber plays a significant role in the forest economy with an annual trade of 1 million m3 which is worth US$ 487 million2.  The reputation of teak is due to its matchless combination of qualities – termite, fungal and weather resistance, lightness with strength, attractiveness, workability and seasoning capacity without splitting, cracking warping or materially altering shape3. In recent years a number of private enterprises have come up for teak growing in many tropical countries including India. Guiding forces behind this have perhaps been initial fast growth and successful agroforestry practices resulting in early returns.  Teak is a seed propagated tree although vegetative means such as bud and / or root grafting are possible.  However, the later has little practical feasibility to measure up to the vast demand for planting material every year4. Seed size has been found to influence germination and seedling growth and ultimately the population in the field5. Seed grading has been suggested as an integral part in post-harvest operation to enhance the planting value of seed lots. In teak, drupe size exerts a significant influence and fillingness, germination as well as seedling vigour6. This will help nursery men to minimize the production cost of seedlings on a broad scale. Till date, there was no detailed experiment to evaluate the effects of drupe size on true seed dormancy mechanism and germination of teak. Poor seed germination is a significant problem for propagation of teak. Seed dormancy is the putative cause for delayed and sporadic germination of teak seed but specific dormancy mechanisms have not been proven7. The whole drupe physical dormancy mechanisms require exclusion of water from the embryo via an impermeable fruit wall or endocarp8 and physiological dormancy prevails in the mesocarp9,6 water soluble germination inhibitors. Minimal germination of viable true seeds may have been influenced by morphological embryo dormancy10,11,12. Against the stalemate an experiment was conducted to evaluate the effect of drupe size on fillingness in vivo germination of dupe and in vitro germination of true seed to find out the dormancy mechanism in teak drupe as well as true seed.

Materials and Methods

Seed Collection

Teak drupes (fruit with seed) were collected from existing 20-year-old plantation at Agricultural Engineering College and Research Institute, Kumulur, Tiruchirappalli, Tamil Nadu (10º4’ N; 78º5 E; 70 msl). Newly fallen matured drupes were collected during April, 2020. After collection, the drupes were dried and cleaned and removing the insect infected and shriveled drupes. The study samples were drawn from those lots.

Size Grading

The drupes were size graded using sieves of different mesh sizes. The different size grades were 15 mm retained (>15 mm diameter), 13 mm retained (13 – <15 mm), 11 retained (11- <13 mm), 9 mm retained
(9 – < 11 mm), and 9 mm pass (< 9 mm). The smallest drupes were discarded. After grading the drupes, weighed 100 drupes weigh (g) grade wise Fig 1 (a).

Vol17No4_Eff_Poo_fig1-(A) Figure 1: (a) Size grading of teak drupes

click here to view figure

Cutting Test

Cutting test was made grade wise and two hundred drupes were soaked in water for 24 hour and then individually cut form horizontally with the help of areca nut cutter.  The empty locules, one seeded, two seeded, three seeded and four seeded drupes were counted and mean numbers recorded.  The fillingness was expressed as percentage Fig 1 (b).

Vol17No4_Eff_Poo_fig1-(b) Figure 1: (b) Frequency of seed development (%) in teak drupes

click here to view figure

Drupe Germination Test

The drupes were subjected to soaking in water followed by drying at 12 hours interval for 6 days and 7th day the pre-conditioned drupes were placed for germination in sand taken in earthen pots (30 cm height and 30 cm upper width) and kept in open sun light.  Experiment was conducted in Completely Randomized Design and 10 replications of 30 drupes were used in all grads. A germination period of 28 days as recommended by13 was adopted. Time taken for initial emergence was observed. The normal seedlings (one (or) more) produced by single drupe was counted as one seedling and germination (expressed as percentage) was computed, total number of seedlings produced by 30 drupes were also counted and the mean value was expressed as 100-1.  For the estimation of dry matte production, ten seedlings were selected at random and kept in a hot air oven maintained at 85oC for 24 hours after measuring their root and shoot length. The vigour index was derived from the formula14.

VI=Percent germination X Total seedling length (cm)

True Seed Extraction

The true seeds were extracted grade wise with a wooden mallet; the seeds located inside the locules of the fruit were removed carefully without any damage to the cotyledon and seed coat. After extracting the true seeds from the fruit, weighed 100 true seed weigh (g) grade wise. Those seed only used for in vitro germination studies Fig 1 (c).

Vol17No4_Eff_Poo_fig1-(c) Figure 1: (c) Extracted true seeds from teak drupes

click here to view figure

Media Preparation for in vitro Germination

To perform in vitro germination, half strength MS media was prepared by adding 50 % of the recommended dose of macro, micro and minor elements of the MS medium15. Full strength of vitamins, 3 % Sucrose and 0.22 µM BAP was added to the medium and the pH was adjusted to 5.8. After pH adjustment 0.8 % agar was added, and the media was melted to homogenize the agar. The melted media was evenly distributed in to culture bottles up to 50 ml per vessel. Finally, the culture vessels with media was autoclaved at 121°C plus 15 psi pressure for 20 minutes.

Sterilization and Inoculation of True Seeds

Each grade of the true seeds was dried for 1 hour in sun light prior to sterilization. The seeds were placed in distilled water containing 0.1 % Bavistin and 0.1 % Tween 20 for five minutes with constant shaking. After Bavistin treatment the seeds were washed in tap water for one minute and washed in 70 % ethanol for 30 seconds. After ethanol wash the true seeds were washed with sterile distilled water. Now the seeds were sterilized in 0.1 % mercuric chloride (HgCl2) solution for five minutes with constant shaking. After HgCl2 sterilization the true seeds have been washed three times with sterile distilled water.

Vol17No4_Eff_Poo_fig2 Figure 2: In vivo germination o teak drupes (13 – <15 mm dia.)

Click here to view figure

In Vitro True Seed Germination Test

The sterilized seeds were carefully inoculated in to a half MS media bottle under a laminar airflow chamber by following the ascetic techniques. Six seeds were inoculated per bottle and eight replicates were made for each treatment. Then the culture vessels were placed in a primary growth room maintaining 25°C temperature, 16 hours light and 8 hours dark conditions. Once in a day the in vitro seed inoculates were observed for time taken for initial emergence and germination percent were taken 14 and 28 days after sowing13. fig. 3 For the estimation of dry matte production, three seedlings were selected at random and kept in a hot air oven maintained at 85oC for 24 hours after measuring their root and shoot length. The vigour index was derived from the formula14.

VI=Percent germination X Total seedling length (cm)

Vol17No4_Eff_Poo_fig3 Figure 3: In vitro germination of teak true seeds

Click here to view figure

Statistical analysis

The results were subjected to analysis of variance and tested (t-test) for significant difference (p=0.05) as suggested16. Percentage values were transformed into arc sine values prior to statistical analysis.

Results and Discussion

Size grading on seed filling

Effect of drupe size and germination of teak revealed that significant difference was found among the treatments. The large sized drupes with 15 mm diameter recorded highest 100 drupe weight of
105.19 g and drupe diameter of 14.16 mm followed by 13 – < 15 mm retained had 76.68 g
100 drupe weight and 12.67 mm drupe diameter, 11 – < 13 mm retained had 58.18 g
100 drupe weight and 11.28 mm drupe diameter, 9 – < 11 mm retained had 55.95 g
100 drupe weight and 10.28 mm drupe diameter and 9 mm passed drupes recorded lowest 100 drupe weight of 42.79 g and drupe diameter of 9.47 mm. When seed filling percent of 15 mm retained recorded highest seed filling of 68 % with a greater number of two seeded drupes, followed by 13 – < 15 mm retained drupes recorded 62 % seed filling, 9 – < 11 mm retained drupes recorded 60 % seed filling, 9 mm pass 58 % and 11- <13 mm retained 54 % seed filling with a greater number of single seeded drupes compared to 15 mm retained (Table 1 and Fig 4). These results indicated that the number of seeds per drupe was not found to decrease with decreasing drupe size.

Table 1: Effect of drupe size on frequency of seed development (%) in teak drupes

Treatments

(Size grade)

No. of seeds/drupe
Empty One Two Three Four Seed filling
T1

15 mm retained

(> 15 mm dia.)

32

(34.45)

22

(27.97)

40

(39.23)

6

(14.17)

0

(0.286)

68

(55.55)

T2

13 mm retained

(13 – < 15 mm dia.)

38

(38.05)

40

(39.23)

22

(27.97)

0

(0.286)

0

(0.286)

62

(51.94)

T3

11 mm retained

(11- < 13 mm dia.)

46

(42.70)

42

(40.39)

8

(16.43)

4

(11.53)

0

(0.286)

54

(47.29)

T4

9 mm retained

(9 – < 11 mm dia.)

40

(39.23)

50

(45.00)

10

(18.43)

0

(0.286)

0

(0.286)

60

(50.76)

T5

9 mm pass

(< 9 mm dia.)

42

(40.39)

54

(47.29)

4

(11.53)

0

(0.286)

0

(0.286)

58

(49.60)

Mean 39.6

(38.64)

41.6

(39.81)

16.8

(23.57)

5

(12.92)

0

(0.286)

60.4

(50.76)

SEd 0.617 0.523 0.083 0.033 0.583
CD (P= 0.01) 1.819 1.542 0.246 0.100 1.720

(Figures in parentheses indicate arc sine value)

Vol17No4_Eff_Poo_fig1 Figure 4:  Effect of drupe size on seed filling (%), drupe germination and true seed in vitro germination (%) of teak

Click here to view figure

Size grading on drupe in vivo germination

The results of drupe weight showed that 100 drupe weight decreases with decrease in drupe diameter. Variation in drupe seed germination per cent, root length, shoot length, number of leaves per seedling, seedling dry matter production and vigour index was observed among the different groups of size graded seeds. 13 – < 15 mm retained showed highest drupe germination of 10 % followed by 11- < 13 mm retained, 9 – < 11 mm retained, 9 mm pass had 3.3 % of germination and none of the drupes was germinated in 15 mm retained. In case of root length 9 – < 11 mm retained drupes showed highest root length of 2.5 cm followed by 2.4 cm of 13 – < 15 mm retained, 2.2 cm 11- < 13 mm retained, 2.0 cm of 9 mm pass drupes. 9 mm pass drupes had highest shoot length of 4 cm followed by 3.5 cm of 13 – < 15 mm retained, 3.4 cm of 11 – < 13 mm retained, 1.8 cm of 9 – < 11 mm retained drupes. 11 – < 13 mm retained showed highest total number leaves (6) followed by (4) 13 – < 15 mm retained; 9 – < 11 mm retained (2) of 9 mm pass drupes. 13 – < 15 mm retained drupes showed highest dry matter production on 0.068 g followed by 0.025 g of 9 – < 11 mm retained drupes, 0.019 g of 9 mm pass drupes and 0.017 g of 11- < 13 mm retained drupes had lowest dry matter. 13 – < 15 mm retained drupes recorded highest vigour index of 59 followed by 19.8 of 9 mm pass, 18.48 of 11- < 13 mm retained drupes and 9 – < 11 mm retained drupes recorded lowest vigour index of 14.19 (Table 2 and Fig 4). These results showed that the drupe size and filling per cent were found to be negatively correlated with drupe germination in teak.

Table 2: Effect of drupe size on 100 drupe weight, drupe diameter, germination and seedling vigour of teak.

Treatments 100 drupe weight

(g)

Drupe diameter

(mm)

Days taken for initial emergence 14 DAS

Germination

(%)

28 DAS
Germination (%) Root length (cm) Shoot length (cm) No. of leaves Dry matter production

(mg/10 seedlings)

Vigour index
T1

15 mm retained

(> 15 mm dia.)

105.19 14.16 0

(0.286)

0

(0.286)

0 0 0 0 0
T2

13 mm retained

(13 – < 15 mm dia.)

76.68 12.67 15 0

(0.286)

10

(18.43)

2.4 3.5 4 0.068 59.0
T3

11 mm retained

(11- < 13 mm dia.)

58.18 11.28 21 0

(0.286)

3.3

(9.97)

2.2 3.4 6 0.017 18.48
T4

9 mm retained

(9 – < 11 mm dia.)

55.95 10.28 22 0

(0.286)

3.3

(9.97)

2.5 1.8 4 0.025 14.19
T5

9 mm pass

(< 9 mm dia.)

42.79 9.47 17 0

(0.286)

3.3

(9.97)

2.0 4..0 2 0.019 19.8
Mean 67.7 11.8 15 0

(0.286)

3.98

(9.97)

1.82 2.54 3.2 0.025 22.29
SEd 0.890 0.121 0.306 0.089 0.026 0.016 0.069 0.0006 0.548
CD (P= 0.01) 2.623 0.358 0.901 0.264 0.078 0.047 0.204 0.0018 1.615

(Figures in parentheses indicate arc sine value) DAS Days after sowing

Size Grading on In Vitro True Seed Germination

The true seeds were extracted from five diameter groups of teak drupes based on their size grades. 15 mm retained had the highest 100 true seed weight of 1.78 g followed by
13 – < 15 mm retained (1.58 g), 11- < 13 mm retained (1.48 g), 9 – < 11 mm retained (1.34 g) and
9 mm pass (1.21 g). These results clearly indicated that decreases in drupe weight with decrease in true seed weight.

True seeds of different grades were germinated in half MS media under in vitro condition and observed for 14 and 28 days after sowing. Variation in true seed germination per cent, root length, shoot length, number of leaves per seedling, seedling dry matter production and vigour index was observed among the different groups of size graded seeds. 9 – < 11 mm retained showed highest in vitro germination per cent of 50.0 % at 14 days after sowing (DAS), and 54.1 % germination in 28 DAS. The 11- < 13 mm retained group recorded 41.6 % germination at 14 DAS and 45.8 % germination at 28 DAS, 13 – < 15 mm retained group showed 33.3 % germination in 14 DAS and 41.6 % germination in 28 DAS, 15 mm retained group had 33.3 % germination in 14 DAS and 33.3 % germination in 28 DAS. Very small seed group of 9 mm pass had lowest germination value of 25 % in in vitro conditions at 14 DAS and 29.1 % germination at 28 DAS.
11 – < 13 mm retained showed highest root length of 2.95 cm followed by 2.81 cm for 13 – < 15 mm retained, 2.68 cm for 9 mm pass, 2.1 cm for 15 mm retained and  9 – < 11 mm retained had lowest root length value of 2.0 cm. 15 mm retained recorded highest shoot length of 2.25 cm followed by 2.03 cm for 9 – < 11 mm retained, 2.02 cm for 9 mm pass, 1.77 cm for 11- < 13 mm retained and 13 – < 15 mm retained had lowest shoot length value of  1.56 cm. 15 mm retained showed highest number of leaves per plant (4.20) followed by  (3.91) for 9 mm pass, (3.62) for 9 – < 11 mm retained, (3.0) for 13 – < 15 mm retained and 11- < 13 mm retained had lowest number of leaves (2.75) compare to all treatments. 9 – < 11 mm retained had highest seedling vigour with a vigour index value of 218.02, followed by 216.17 for 11- < 13 mm retained, 181.79 for 13 – < 15 mm retained, 144.85 for 15 mm retained and 136.77 for 9 mm pass (Table 3 and Fig 4). These results showed that the drupe size and filling per cent were found to be negatively correlated with in vitro germination in teak.

Table 3: Effect of drupe size on 100 true seed weight and in vitro germination and seedling vigour of true seeds of teak

Treatments 100 true seed weight

(g)

Days taken for initial emergence 14 DAS

Germination

(%)

28 DAS
Germination (%) Root length (cm) Shoot length (cm) No. of leaves Dry matter production

(mg/10 seedlings)

Vigour index
T1

15 mm retained

(> 15 mm dia.)

1.78 4 33.3

(35.06)

33.3

(35.06)

2.1 2.25 4.20 86 144.85
T2

13 mm retained

(13 – < 15 mm dia.)

1.58 8 33.3

(35.06)

41.6

(39.81)

2.81 1.56 3.0 83 181.79
T3

11 mm retained

(11- < 13 mm dia.)

1.48 5 41.6

(39.81)

45.8

(42.13)

2.95 1.77 2.75 69 216.17
T4

9 mm retained

(9 – < 11 mm dia.)

1.34 5 50.0

(45.00)

54.1

(47.29)

2.0 2.03 3.62 78 218.02
T5

9 mm pass

(< 9 mm dia.)

1.21 4 25.0

(30.00)

29.1

(32.58)

2.68 2.02 3.91 52 136.77
Mean 1.47 5.2 36.64

(36.87)

40.78

(39.23)

2.50 1.92 3.49 73.6 179.52
SEd 0.023 0.06 0.44 0.59 0.03 0.02 0.06 0.663 1.94
CD (P= 0.01) 0.068 0.13 0.93 1.26 0.06 0.05 0.13 1.955 4.14

The present results were not agreed with earlier studies indicated that larger drupe size in teak have better germination17,18,19. Size of the drupe is primary factors for determining germination per cent20. The results confirm that the variability between different population within the species in seed characters and germination percentage is due to strong genetic influence21,22,23. In earlier studies showed that number of seeds per drupe was found to decrease with drupe size24,25,26. The drupe weight and endocarp weight that are positively correlated with filling per cent but not significantly correlated with germination per cent25. the higher endocarp ash may due to the presence of higher inorganic compounds like calcium which can help to increase cell wall rigidity and thickness and it may affect germination27. While, direct correlation of mesocarp weight on germination was found to be negatively correlated. High mesocarp proportion affects germination because of more phenolic content is present 28,29,30. Present studies also confirm that the larger drupe size has no relation with germination, confirm the results of31,32,33. There was strong interaction between survival rate and seedling growth under in vitro and in vivo condition. Better seedling growth and survival rate of 9 – < 11 mm retained drupes (true seeds) under in vitro compare to in vivo condition, it confirming the result of 26.

In the present study reveals that the average seed filling percentage was 60.4, irrespective of the size of the drupe were studied, where as in an average germination of drupe only 3.98 percent, when the drupe was placed for germination in sand method.  Whereas the true seeds were extracted from the drupe and placed for germination in in vitro condition in half MS medium recorded 40.78 percent, around 36.8 percent higher than the drupe germination.  Improved germination in MS medium is not well understood.  It is assumed that the nutrient composition of the media might be enhanced the germination of true seed.  Poor germination of whole drupe might be due to physical25, Physiological6 and morpho-physiological dormancy34. There is contradictory view regarding physical dormancy the report7, demonstrates that teak drupes generally have mechanical not physical dormancy.  The above findings supported with the present study, where the true seed extracted from the drupe enhanced the germination when compared to sowing the drupe as it is.  The endocarp of the drupe might be given the mechanical resistance to the germinating seed.  In the present study, true seed recorded only 40.78 present germination the remaining un-germinated true seed may have been affected by morphological embryo dormancy11,35,7. It need in-depth study regarding the germination behavior of true seed.

Conclusion

From this study it could be concluded that 15 mm retained drupes had highest 100 drupe weight, 100 true seed weight and seed filling but it has negatively correlated with germination. In in vitro condition 9 – < 11 mm retained drupes (true seeds) recorded highest germination compared to all other grades. It is clearly indicated that small size grades seeds also give highest germination compared to large grade drupes. This study useful for the precious genetically improved small size seed useful for establishing large scale teak plantations.

Acknowledgement

The authors are thankful to Anbil Dharmalingam Agricultural College and Research Institute, Tamil Nadu Agricultural University, Trichy, Tamil Nadu for the facilities provided.

Conflict of Interest

We confirm that we do not have any conflict of interest.

Funding Source

The study was funded by Tamil Nadu Agricultural University Core resources.

References

  1. Troup R. S., The Silviculture of Indian Trees. Oxford Press. 1921; 1184.
  2. FAO. Global teak trade in the aftermath of Myanmar’s log export ban by Kollert, W. & Walotek, P.J. Planted Forests and Trees Working Paper FP/49/E. Rome, Italy, 2015.
  3. Jha K. K. Teak (Tectona grandis) Farming International Book distributing company, Lucknow. 1999; 125.
  4. Masilamani P.,  Dharmalingam C. Influence of Seed Treatment with Potassium Nitrate on Germination and seedling vigour of Teak (Tectona grandis Linn.f). Indian Journal of Forestry. 1999; 22:1-6.
  5. Harper J. C., Obeid M. Influence of seed size and depth of sowing an establishment and growth of varieties of fiber and oil seed flax, Crops science. 1967; 7:527-532.
    CrossRef
  6. Masilamani P., Dharmalingam C., Annadurai K. Provenance variation in seed and seedling attributes of Teak (Tectona grandis linn.f). In “Proceedings of the International Workshop on Production and Marketing of Teak Woods: Future Scenarios” edited by K.Jayaraman, M.Balasundaran, K.V.Bhat and C.N. Krishnankutty. Workshop held during 23-25, November, 2009 at Kerala Forest Research Institute, Peechi, Kerala. India. 2009; 90-97.
  7. Slator J. N., Callister N. A., Doland Nichols J. Mechanical but not physical dormancy is a cause of poor germination in teak (Tectona grandis L. f), New forest. 2013; 44:39-44.
    CrossRef
  8. Hartmann, H. T., Kester D. E., Davies F. T., Geneve R. L. Plant propagation: principles land practices, prentice Hall, Upper Saddle River 1997.
  9. Agboola D. A. Studies on the germination inhibitors in the fruits of four tropical tree species. Glob J Pure App Sci. 2000; 6:27-30.
    CrossRef
  10. Joshi M. D., Kelkar S. P. Germination of seeds in dry teak (Tectona grandis L.) preliminary studies in fruit development and seed dormancy, Indian For. 1971; 97:210-216.
  11. Dabral S. L. Extraction of teak seed from fruit, their storage and germination. India Forester. 1976; 102: 650-658.
  12. Suangtho V. Factors controlling teak (Tectona grandis Linn. f.) seed germination and their importance to Thailand. Masters Thesis, Australian National University, Canberra. 1980.
  13. International Seed Testing Association.,. International rules for seed testing, Seed Science and Technology. 1985; 13:229-355.
  14. Abdul Baki A. A., Anderson J. D. Vigour determination in soybean seed by multiple criteria.  Crop Sci. 1973; 13:630-633.
    CrossRef
  15. Murashige T., Skoog F. A Revised medium for rapid growth and bio assays with tobacco tissue cultures, Physiological Plantarum. 1962; 15:473-497.
    CrossRef
  16. Panse V. G., Sukhatme P. V. Statistical methods for agricultural workers. Indian Council of Agricultural Research Publications, New Delhi. 1995; 330.
  17. Samapudhi K. A Country Report on Teak in Thailand. FAO Forestry Paper, Rome. 1967; 7.
  18. Kumar A. Effect of fruit size and source on germination of teak seeds, Sri Lanka forester. 1979; 14:58-63.
  19. Syam V. Investigations on production of healthy seedlings of teak in the nursery. M.Sc. thesis, College of Forestry, Kerala Agriculture University, Kerala, India. 1988; 136.
  20. Banik R. L. Studies on grading of teak fruits II. Combined effect of fruit weight and size on the production of seedling. Bano Bigyan Patrika. 1978; 7:20-29.
  21. Hellum A. K. Grading seed by weight in white spruce, Tree Planters’ Notes. 1976; 27:16-17.
  22. Bagchi S. K., Joshi D. N., Rawat D. S. Variation in seed size of Acacia spp. Silvae Genetica. 1990; 39:107–110.
  23. Vakshasya R. K., Rajora O. P., Rawat M. S. Seed and seedling traits of Dalbergia sissoo Roxb. seed source variation among ten sources in India, Forest Ecology and Management. 1992; 48:265-275.
    CrossRef
  24. Banik R. L. Studies on grading of teak fruits – I. Fruit size is a factor in germination of teak seeds. Bano-Biggyan-Patrika. 1997; 6(1):1-7.
  25. Sivakumar V., Parthiban K. T., Singh B. G., Gnanambal V. S., Anandalakshmi R., Geetha S. Variability in drupe characters and their relationship on seed germination in Teak (Tectona grandis L. f.), Silvae genetica. 2002; 5:232-236.
  26. Akram M., Aftab F. Fruit size and sampling sites effect on dormancy, viability and germination of teak (Tectona grandis L.) seeds. Pakistan Journal of Botany. 2016; 48:511-518.
  27. Schroeder C. A. Progress report on study of sclereid formation in Avocado fruit pericarp. California Avocado Society Yearbook. 1982; 66:161-165.
  28. Bhumibhamon S., Ponoy B., Chaisurisri K. Publicacion-Especial-Instituto-Nacional-de-Investigaciones-Forestales, Mexico. 1983; 35:253-264.
  29. Chacko K. C. Termite-aided mesocarp removal of teak (Tectona grandis L. f.) fruits for enhanced germination and cost- effective seed handling, Indian Forester. 1998; 124:134-140.
  30. Bapat A. R., Phulari M. M. Teak fruit treatment machine – A Prototype – II, Indian Forester. 1995; 121:545-549.
  31. Jayasankar S., Babu L. C., Sudhakara K., Unnithan V. K. G. Provenance variation in seed and germination characteristics of teak (Tectona grandis L. f.), Seed Science and Technology. 1999; 27:131-139.
  32. Indira E. P., Basha C. S., Chacko K. C. Effect of seed size grading on the germination and growth of teak (Tectona grandis L. f.) seedlings, Journal of Tropical Forest Science. 2000; 12:21-27.
  33. Jose S., Indira E. P. Variability of seed related characters in teak (Tectona grandis L f) from Western Ghat region, Gregor Mendel Foundation Journal. 2010; 1:39-44.
  34. Gupta B. N., Pathanath P. G. Factors affecting germination of teak seeds of eighteen Indian Orgins, Indian Forester. 1975; 101:584-587.
  35. Masilamani P. Seed technological studies in teak (Tectona grandis Linn.f) Ph.D. Thesis.  Tamil Nadu Agricultural University, Coimbatore, Tamil Nadu. 1996:187.

Economic Effectiveness and Agricultural Indicators of Combinations Grafting-Varieties of Apple Plants

$
0
0

Introduction

The main valuable agricultural indicators of the variety on a par with quality indicators of fruits, are important parametric indicators of the crown, the yield and productivity of trees, in accordance with the parameters of optimal landing schemes, agrecultural yield and economic efficiency of selected combinations variety-grafting.

Analysis of data, submitted by various researchers show that from the geographical conditions of cultivation, economic indicators are also change. In mountainous conditions, many indicators of the production economy, surpasses the indicators of production in the lowland zone. In their opinion, this is facilitated to relatively lower costs in the applied agrotechnical (combating of pests and diseases, lack of irrigation, etc.) activities. At the same time, trees, entering the fruiting period earlier, contribute to a rapid return on costs [1, 4, 8]. On the economy of fruit production also influence varietal features. Determined that cultivation of the variety of Renet Simirenko in the foothill zone, significantly exceed those in the mountainous and lowland zone, both in the quality of the fruit and on the profitability of production. This is facilitated to high relative humidity of air in the highlands, also low air humidity of air and high temperature in the lowland zone. And vice versa, in the varieties of  Leskensk  fruits is better quality and  the profitability is high both in the foothill and in the lowland zone [10]. It is necessary to proceed from a unique feature of the variety, strictly adhere to the agrotechnical requirements of the variety. Here, the height and other conditions of grafting is main factors [13,14,15,16]. Mulching, applying of herbicides, fertilizers and other factors is effecting to the agriculture and economic indicators at apple varieties [11,12,18,19]. The same, the results are obtained in other republics. In Belarus at the right agrotechnical care, in apple trees, the profitability of production  increases depending at the variety in the range of 218.0-480.7% and 218.7-264.1% [7,8]. As reportes by  Dogeyev  Kh. D, the main condition for the successful cultivation of fruit crops in Dagestan is selection of varieties for the specific environmental conditions of the area. In his experiments, the average profitability of apple varieties was 41.2%, of varietes Aidared is 77.3%;  in varieties of cherry-plum averaged 96.3%, in the variety of  Pearl 117.5%, in the variety of Abundant 180.8%;in the plum is average of 84.6%, in the variets of Hungarian 86.7%; in the varieties of cherry  of  Dagestanka and Riddle  average 141.9% [3]

In the literature, seen materials concerning influence of the grafting to the agricultural indicators of the variety – graft [2,5,6,10]. Proceeding from this, some researchers recommends during established gardens  use  low-growth grafting and high-harvest varieties for suppression of growth and increase harvest.  This increases the profitability of production [5].

Our research is aimed, to study the impact of combinations variety-grafting to the agricultural and economic indicators of the apple tree.

Results and Discussion

The analysis of the obtained data showed a significant difference between the orchards, depending on the grafting(table 1). Thus, the area of the projection of the crowns, the necessary indicator for determining the coefficient of productivity of the crowns, more in varieties grafted on the generative rootstock (11.3 m2) and relatively less in varieties grafted on clonal grafting M9 (2.43 m2) and MM106 (7.96 m2). Table1

Table 1: Morphometric and agricultural indicators of different combinations  varieties- grafting  of apple. 

grafting sort Area of crown projection, m2 Coefficient of crown productivity, kg / m crown 2 The average diameter of crown, м The area of plant nutrition, м2 Number of trees on ha, pieces Agricultural productivity, center / ha
Forest apple Khala 10,64 3,91 3,28 15,73 636,0 264,59
Jonaqored 10,99 3,15 3,34 16,23 616,0 213,25
Qrani Smit 12,51 3,42 3,55 18,04 554,0 237,03
Fuje 10,59 3,78 3,26 15,57 642,0 256,99
Renet Simirenko 12,33 3,55 3,52 17,77 563,0 246,43
Golden delishes x972 10,69 4,22 3,28 15,73 636,0 286,91
Jonagold 11,36 3,35 3,38 16,57 604,0 229,86
Average 11,3 3,63 3,37 16,52 607,0 247,87
M-9 Khala 2,19 12,9 1,53 4,34 2304,0 650,90
Jonaqored 2,74 7,83 1,71 5,23 1912,0 410,20
Golden reinders 2,44 13,26 1,62 4,78 2092,0 676,85
Qrani Smit 2,50 12,14 1,64 4,88 2049,0 621,87
Aydared 2,38 10,87 1,59 4,63 2160,0 558,81
Red Vinter 2,36 11,19 1,59 4,63 2160,0 570,42
Fuje 2,37 13,74 1,59 4,63 2160,0 703,38
Average 2,43 11,70 1,61 4,73 2120,0 598,92
MM-106 Khala 6,76 5,87 2,6 10,58 945,0 374,99
Jonaqored 7,64 4,74 2,77 11,78 849,0 307,45
Qrani Smit 8,52 5,32 2,92 12,89 776,0 351,73
Fuje 7,72 6,11 2,78 11,85 844,0 398,11
Renet Simirenko 8,28 5,01 2,88 12,59 794,0 329,37
Golden delishes x972 7,53 6,43 2,75 11,64 859,0 415,91
Jonagold 9,27 4,35 3,05 13,89 720,0 290,34
Average 7,96 5,4 2,82 12,17 827,0 352,56

Areas of   plant nutrition, depending at the grafting distinctive. Accordingly, the number of trees in varieties on clonal grafting more, than on the generative rootstocks.

This significantly affects to the agricultural harvest, where the varieties on the clone grafting M9 gives significantly more harvest (598.92 c / ha) than on the generative rootstock (247.87 c / ha) and on the other cloned grafting MM106 (352.56 kg/ ha).

High indicators of economic harvest contribute to increased economic efficiency of the agriculture(tаble 2).

Calculation of the economic efficiency of combinations various- grafting of apple tree, shown that the production expenses in apple orchards on generative rootstock are relatively lower (3019.69 AZN.) than on the varieties of MM106 (4493.83 AZN.) and M9 (5997.31 AZN.).

However, high and high quality harvest of varieties on clonal grafting helps to increase net income and, together with them, profitability of production. So, if the profitability of the agriculture in the gardens on the generative rootstock is 100.06%, this indicator in apple orchards on clonal grafting is much higher and is 147.54% on MM106 and 381.14% on M9.

Тable 2: Economic efficiency of combinations varieties –  grafting of apple.

grafting Sort The number of trees,pieces / ha Harvest, center / ha Production costs, man./ha Cost price of production, c / man. Realization price of 1 centner of a crop, man. Total income, man. Net income, man. Profitability,%
1 2 3 4 5 6 7 8 9 10
Forest  apples Khala 636,0 264,59 3061,5 11,57 22,2 5873,9 2812,4 91,86
Jonaqored 616,0 213,25 2933,1 13,75 25,2 5373,9 2440,8 83,22
Qrani Smit 554,0 237,03 2992,6 12,63 26,0 6162,78 3170,18 105,93
Fuje 642,0 256,99 3042,5 11,84 26,4 6784,54 3742,04 122,99
Renet Simirenko 563,0 246,43 3016,1 12,24 20,2 4977,89 1961,79 65,04
Golden delishes x972 636,0 286,91 3117,3 10,87 25,8 7402,28 4284,98 137,46
Jonagold 604,0 229,86 2974,7 12,94 25,1 5769,49 2794,79 93,95
average 607,0 247,87 3019,69 12,26 24,41 6049,25 3029,57 100,06
                1 2 3 4 5 6 7 8 9 10
M-9 Khala 2304,0 650,90 6127,3 9,41 41,5 27012,35 20885,05 340,85
Jona-qored 1912,0 410,20 5525,5 13,47 47,7 19566,54 14041,04 254,11
Golden reinders 2092,0 676,85 6192,1 9,15 48,2 32624,17 26432,07 426,87
Qrani Smit 2049,0 621,87 6054,7 9,74 49,7 30906,94 24852,24 410,46
Аydared 2160,0 558,81 5897,0 10,55 50,8 28387,55 22490,55 381,39
Red Vinter 2160,0 570,42 5926,1 10,39 49,4 28178,75 22252,65 375,5
Fuje 2160,0 703,38 6258,5 8,90 51,5 36224,07 29965,57 478,8
average 2120,0 598,92 5997,31 10,23 48,4 28985,77 22988,45 381,14
MM-106 Khala 945,0 374,99 4537,5 12,1 27,8 10462,22 5924,72 130,57
Jonaqored 849,0 307,45 4368,6 14,21 32,3 9930,64 5562,04 127,32
Qrani Smit 776,0 351,73 4479,3 12,74 33,7 11853,30 7374,00 164,62
Fuje 844,0 398,11 4595,3 11,54 34,3 13655,17 9059,87 197,16
Renet Simirenko 794,0 329,37 4423,4 13,43 30,0 9881,10 5457,70 123,38
Golden delishes x972 859,0 415,91 4639,8 11,16 33,1 12893,21 8253,41 177,88
Jonagold 720,0 290,34 4412,9 15,2 32,2 9348,95 4936,05 111,86
average 827,0 352,56 4493,83 12,91 31,91 11146,37 6652,54 147,54

Conclusions

Apple varieties grafted on clonal rootstocks, in comparison with strongly grown generative rootstocks, have a relatively smaller growth, but a higher coefficient of productivity.

Smaller morphometric indicators of varieties on clonal grafting, helps increase the number of trees in hectare and thereby increase the agricultural productivity. Respectively, increases  production expenses.

The highest productivity of the agricultural harvest  and profitability are different at the varieties of  clone grafting M9.

Reference

  1. David Granatstein and Enrique Sánchez. Research Knowledge and Needs for Orchard Floor Management in Organic Tree Fruit Systems. International Journal of Fruit Science, 9:257–281, 2009.
    CrossRef
  2. Dogeev Kh.D Increase the economic efficiency of fruit growing in market conditions: On the example of the Republic of Dagestan. Dis. … cand. Sciences, Маkhаchкаlа, 210.
  3. Fernández, D., L.I. Cichon, E.E. Sanchez, S.A. Garrido, and C. Gittins. 2008. Effect of different cover crops on the presence of arthropods in an organic apple (Malus domestica Borkh) orchard. J. Sustainable Agr. 32:197–211.
    CrossRef
  4. Huseyn Akgul., Emel Kachal., F.Pınar Ozturk., Sherif Ozongun., Adem Atasay.,Gokhan Ozturk. Apple culture, Konya, 510.
  5. IBGE – INSTITUTO BRASILEIRO DE GEOGRAFIA E ESTATÍSTICA. 2017. Survey of national passion fruit production in the year 2017. Available in: Access in: November 15, 2017.
  6. IKINCI A, BOLAT I, ERCISLI S AND KODAD O. 2014. Influence of rootstocks on growth yield fruit quality and leaf mineral element contents of pear cv ‘Santa Maria’ in semi-arid conditions. Biol Res 47: 1-8.
    CrossRef
  7. JESUS ON, OLIVEIRA EJ, FALEIRO FG, SOARES TL AND GIRARDI EA. 2017. Iustrated morpho-agronomic descriptors for Passiflora spp. Brasília: Embrapa Mandioca e Fruticultura 1: 122.
  8. KARLIDAG H, EREN G, KARAAT FE AND KAN T. 2016. Grafting height effects on lateral branching shoot angles and growth of some fruit species saplings. Int J Agric Innov Res 5: 1-5.
  9. Khurbanov İ.S., Aliyev V.M., Beyahmedov İ.A., Khankishiyeva E.M. 2014. Apple production in the world. Apple production in the world. Azerbaijan Agrarian Science. Baku, 4: 64-72.
  10. Кrasova Kh., Khalasheva А. М., Оjerelyeva Z. Е. 2015. The growth and fruiting of apple varieties in an intensive garden. Modern gardening. Electronic journal, 1:20-24.
  11. Кrisanov Y.V. Gardens on weakly grown rootstock. Selected works of V. I. Budagovsk. Michurinsk-naukograd of the Russian Federation, 499.
  12. Leonovich I.S., Коstyuchenko T.М. 2008. Economic evaluation constructions of plantations apple trees on the weakly grown stock, // RUE Institute of fruit growing. Ways to realize the potential of high-density fruit plantings. Samokhvalovich, 93-96.
  13. LUCAS K.S. LIMA , IDÁLIA S. DOS SANTOS , ZANON S. GONÇALVES , TALIANE L. SOARES, ONILDO N. DE JESUS and EDUARDO A. GIRARDI. Grafting height does not affect Fusarium wilt control or horticultural performance of Passiflora gibertii N.E.Br. rootstock. Manuscript received on January 23, 2018; accepted for publication on April 6, 2018. http://dx.doi.org/10.1590/0001-3765201820180072 www.scielo.br/aabc | www.fb.com/aabcjournal.
    CrossRef
  14. Luchkov P.Kh. and others. Some aspects of adaptive landscape soil protection technology cultivation of apple orchards on the slopes in the foothills of the central part of the North Caucasus/ Intern. Scientific-prak. Confer .: Mobilization of the adaptive potential of garden plants in dynamic. Conditions the external environment. UAAS, Мoskov, 166-170.
  15. Saveleva N.N. Productivity and economic-effectiveness to immune to scab of apple varieties. RUE Institute of fruit growing. Ways to realize the potential of high-density fruit plantings.Samokhvolovich, 89-92.
  16. Sadıkhov A.N. 2011. The economic efficiency of the new selection apple varieties/ Scientific-practical conference “Food safety problems on the basis of improving agricultural science” to the 100 years of Narimanov A.S., Baku: Teacher, 357-358.
  17. Stefanelli, D., R.J. Zoppolo, R.L. Perry, and F. Weibel. 2009. Organic orchard floor management systems for apple effect on rootstock performance in the midwestern United States. HortScience 44:263–267.
    CrossRef
  18. Zakirov N.Kh. and others. The economic potential of mountain and foothill areas as a basis for sustainable gardening in Dagestan. Makhachkala: The peoples of Dagestan, 28.
  19. Weibel, F. and A. Häseli. 2003. Organic apple production, p. 551–583. In: D.C. Ferree and I.J. Warrington (eds.). Apples: botany, production, and uses. CABI Publ., Cambridge.

Molecular Characterization of Thirteen Oilseed Brassica L. Variants from Bangladesh through Polyacrylamide Gel Electrophoresis (PAGE)

$
0
0

Introduction

The Brassicaceae (Cruciferae) family consists of 338 genera and about 3709 species1. Among these genera, economically Brassica is the most important genus with 37 different species2. The genus – Brassica is composed of six interlinked species with great morphological and genetic diversity of which three diploid species- Brassica rapa (A genome), B. nigra (B genome), and B. oleracea (C genome) of the genus Brassica were considered to be responsible for the origin of three amphidiploid species, B. carinata (n = 17, BC genome), B. juncea (n = 18, AB genome) and B. napus (n = 19, AC genome)3. Brassica was originated near the Himalayan region. Brassica offered with a large number of important vegetables, oilseed and condiment crops also a great source of bioactive compounds, minerals, phytochemical contents, vitamins and fibers4.

Generally, the genus Brassica L. has been classified into three groups particularly –rapeseed, mustard and cole. The mustard groups include species like B. juncea, B. nigra and B. carinata; whereas the rapeseed groups include B. rapa and B. napus5. Commercial production of Brassica has grown progressively as a vital source of oil and plant originated protein for human and animal nutrition. Currently, rapeseed categorizes as the third source of vegetable oil (after soy and palm) and for oil meal it ranks as the third notable source (after soy and cotton)6. Brassica L. generates Indole-3-carbinol that plays significant role in reducing the growth of human breast cancer cells and the occurrence of tumors in reproductive organs7-8.

Moreover, Brassica L. are not only a quality sources of potassium, dietary fiber, phenolics, vitamins A, C and E but also use as a renewable resource or biofuel in the petro-chemical industry9. Higher protein solubility is found in seeds of B. napus than B. rapa seeds. As a rich source of edible protein, B. rapa, B. juncea, B. carinata, and B. nigra have commercial values in food industry. In oil-extraction process, rapeseed and canola meal remain as by-product which contain up to 42.7% to 50.00% protein10.

Evaluation with molecular marker facilitates in determining parental forms for mapping of population, marker assisted alternatives, line drawings of back crosses and consequently various molecular markers are applied to execute different studies which offer assistance to the breeders to improve crop species11. Now-a-days storage proteins are widely used as biochemical markers to find genetic structure, genetic diversity and relationships within plant species. According to O’Farrell12, polyacrylamide gel electrophoresis (PAGE) has been a well-accepted proteomic analytic method since its initiation to access protein banding patterns among different plant varieties. Hence electrophoresis of protein is considered as a method for characterization and evaluation of germplasm as well as increase the utilization of various plant genetic resources13.

Nowadays, storage protein is one of the most significant implements used to appraise genetic assortment among wild and cultivated plant species. Reviewing a number of earlier works of Mukhlesur and Hirata14, Sadia et al.15, Turi et al.13, Zada et al.16, Ibrahim et al.17 and so on, it has been revealed that they conveyed abundant efforts to find out genetic diversity and relationship among various species of Brassica for improvement of crop through SDS-PAGE.

Consequently the present investigation is conducted based on leaf storage protein of thirteen different BARI (Bangladesh Agriculture Research Institution) variants of Brassica from Bangladesh by utilizing PAGE technique to evaluate accurate protein profile for discerning variants, extent of genetic divergence and relationship among the thirteen inquired variants of Brassica as well as selection of parental line for further breeding program and crop improvement.

Materials and Methods

Plant Materials

Thirteen variants of the genus Brassica have been chosen for the current study reflecting a wide array of variation for diverse physio-morphological attributes (Table 1). To conduct the present investigation, all the thirteen variants of Brassica were collected from Oilseeds Research Center (ORC) of Bangladesh Agricultural Research Institute (BARI), Gazipur, Bangladesh and maintained in the Botanical garden of Jagannath University, Dhaka, Bangladesh. Analyses of leaf protein profile of the supplied variants were conducted in the laboratory of department of Botany, Jagannath University, Dhaka, Bangladesh.

Table 1: Some physio-morphological and agronomic traits of 13 Brassica L. variants used in the study.

Species


Name of variants Days to maturity Siliquechamber Seed color Agronomic traits
B. juncea Daulot (RS-81) 90-105 2 chambered Reddish brown Comparatively long duration, low yielding variety. Tolerant to alternaria blight disease and environmental stresses like – drought and slightly tolerant salinity.
B. juncea BARI Sarisha-2 (Rai-5) 90-100 2 chambered Reddish brown Long duration, low yielding variety. Tolerant to drought, slightly tolerant to salinity.
B. juncea BARI Sarisha-10 (BS-10) 90-100 2 chambered Reddish brown Long duration, high yielding variety. Tolerant to drought, slightly tolerant to salinity.
B. juncea BARI Sarisha-11 (BS-11) 105-110 2 chambered Reddish brown Long duration, high yielding variety. Tolerant to drought and salinity.
B. napus BARI Sarisha-7 (Napus-3142) 90-95 2 chambered Black Long duration, high yielding variety, tolerant to alternaria blight disease and interim water logged condition.
B. rapa BARI Sarisha-1 (Tori-7) 70-80 2 chambered Black Short duration, low yielding variety. Susceptible to pest and diseases.
B. rapa Kollaynia (TS-72) 85-90 2 chambered Blackish brown Short duration, low yielding variety. Susceptible to pest and environmental stresses.
B. rapa Sonali Sarisha (SS-75) 90-100 4 chambered Golden yellow Long duration, high yielding variety. Susceptible to alternaria blight disease.
B. rapa BARI Sarisha-6 (Dholi) 90-100 2 chambered Yellow Long duration, high yielding variety.  Susceptible to environmental stresses.
B. rapa BARI Sarisha-9 (BS-9) 80-85 2 chambered Reddish brown Short duration, high yielding variety.
B. rapa BARI Sarisha-12 (BS-12) 85-90 2 chambered Reddish brown Short duration, high yielding variety.
B. rapa BARI Sarisha-14 (BS-14) 75-80 2 chambered Yellow Short duration, high yielding variety.
B. rapa BARI Sarisha-15 (BS-15) 80-85 2 chambered Yellow Short duration, high yielding variety.

Methods

Protein Isolation and Sample Preparation

Fresh and young leaves of one-month old seedlings of investigated thirteen variants of Brassica were collected to isolate the crude protein. Based on the methodology of Akbar et al.11 the collected leaves of Brassica variants were gently washed with distilled water and then with ethanol to clean the microspores and other dirt from the leaves surface and then kept on flitter papers for a while to soak up the excessive amount of distilled water and ethanol from the leaves. Afterwards, 1 gm fresh leaf of each sample was grinded and homogenized with cold deionised doubled distilled water in icy motor-pestle and later the crude homogenates were centrifuged at 4ºC with 13000 rpm for 15 min. After centrifugation, the crude protein remained as clear supernatant and stored in refrigerator at -20ºC as sample (isolated protein) for vertical polyacrylamide gel electrophoresis.

Estimation of Protein

According to Lowry et al.18, with little modification, the protein concentration of each investigated Brassica L. sample was estimated using 665 nm wave length via UV VIS spectrophotometer (UVN 15 Spectrophotometer).

Electrophoresis

Polyacrylamide gel electrophoresis of each inquired sample was conducted by following the strait of Akbar et al.11. The entire process of electrophoresis was performed by using omniPAGE mini vertical gel electrophoresis unit. The isolated protein sample was directly resolved with 10.0% polyacrylamide as separating gel and 4.0% as stacking gel during electrophoresis. Then, 200 μgm of each sample protein was loaded with 2X diluted Bromo Phenol Blue (BPB) loading dye (0.5 M Tris-HCl, pH 6.8; glycerol and deionised doubled distilled water in a volumetric ratio of 1: 1: 3 with a pinch of Bromo Phenol Blue) into the well of stacking gel. To run the electrophoresis, Cleaver nanoPAC– 300 constant power supply unit was employed and voltage was set at 90 V. The protein sample with BPB loading dye was mobilized in 10X diluted running buffer solution (Tris-glycine buffer, pH 8.3) until the dye front line arrived on 2mm above to the end of the gel. Afterwards, the gel was stained by 0.25% Coomassie Brilliant Blue (CBB) R-250 for 25 min and distained in acetic acid- methanol-distilled water (1: 4: 5 volume ratios) until the clear bands appeared on the gel. Lastly, the distained gel was gently washed with distilled water and the photographs of the gel were taken by a DSLR (18 mega pixels Canon EOS 700D model).

Data Analysis

Evaluations of the gels were done with bare eyes on a light box. The relative mobility (Rf values) of protein subunits were calculated by measuring the migration distance from the top of the separating gel to each band and to the dye front. For each band on the gel, the Rf value was calculated using the following equation:

Rf = migration distance of the protein / migration distance of the dye front

Determination of the discernible molecular weight of individual protein subunits was carried out using molecular weight marker proteins. Phosphorylase B, 97.2 KD; Bovine serum albumin, 66.4 KD; Ovalbumin, 44.3 KD; Carbonic anhydrase, 29.0 KD; Trypsin inhibitor, 20.1 KDa and Lysozyme, 14.3 KDa (Protein Molecular Weight Marker; TakaRa Bio USA) applied on the gel as marker protein. A standard curve of the log molecular weight (MW) on X axis versus relative mobility (Rf) of marker protein on Y axis was generated using computer based program Microsoft Excel. Molecular weight of individual unknown protein subunit from PAGE was determined by utilizing the equation:

y = mx + c, where y denotes for the molecular weight of unknown protein subunit.

The photographs of the gel were acutely reviewed on the basis of the presence (1) and absence (0) of protein bands. All the major and minor bands that were apparent to the eyes were considered in our current analysis and scoring of all the monomorphic and polymorphic bands were recorded. The scores acquired from PAGE analysis were then pooled for creating a single data matrix. Thereafter, the data was used to estimate proportion of polymorphic loci, Nei’s19 gene diversity (h), Shannon’s Information index20 and Nei’s21 genetic distance (D) employing a computer program, POPGENE (version 1.32)22. Based on genetic distance between all pairs of individual variants, a dendrogram was prepared applying Unweighted Pair Group Method with Arithmetic averages (UPGMA).

Results and Discussion

Proteins are thought about to be the forthright outcome of genes and might be used as  markers of these genes. For characterizing systematic classification, protein might be performed as a supplemental mean. Hence an ample electrophoretic protein banding profile was conducted after the extraction and separation of stored leaf protein from the studied thirteen variants of Brassica L. through PAGE technique and represented in Fig. 1.

Vol17No4_Mol_Far_fig1 Figure 1: Banding pattern of leaf storage protein of thirteen variants of Brassica through PAGE, (A) stained with Coomassie Brilliant Blue (CBB; R-250) and (B) diagrammatic representation of protein bands on polyacrylamide gel. Lane M- Molecular weight protein marker, KDa- Kilo Dalton (arrows indicate different loci produced during polyacrylamide gel electrophoresis).

Click here to view figure

The electrophoretic protein banding patterns of the thirteen studied variants of Brassica were detected which conveyed to the marking off a total of nineteen polypeptide bands. Nineteen polypeptide bands were found to be present at nineteen different loci designated as a – s with molecular weight ranging from 16.36 to 97.20 KDa (Table 2 and Figs. 1A–B). A close inquisition of the bands displayed that the different variants had slight differences in their protein banding patterns with respect to the presence and absence and staining intensities of the bands. Moreover in the current study, the entire protein banding pattern of the investigated variants were grouped into 3 different regions (I to III) based upon the manner of increasing Rf values and decreasing molecular weight of proteins (Table 2).

Vol17No4_Mol_Far_tab1 Table 2: Region, location, molecular weight, relative mobility, type of unique band and intensity values of different protein bands present in 13 Brassica L. variants.

Click here to View figure

As a consequence, region – I was found to consist of six bands having a range of molecular weight 55.72–97.20 KDa with Rf value ranging from 0.028–0.173. The six protein bands of region – I was characterized with bands of mostly low intensity at loci – a, b, d and f, whereas in locus – e, moderate and low level intensity protein bands were found, protein bands of high intensity in all the variants were observed at locus – c, except in Rai-5 (negative unique band). The only low intensity protein band with molecular weight and Rf value of 72.95 KDa and 0.081 respectively, was detected from BS-10 at locus – d, which can be considered as a unique band (positive unique band) and may be used as an implement for particular varietal characterization of Brassica L. (Table 2 and Figs. 1A–B). All the bands in region–I was found to be polymorphic. Region – II was observed with nine protein bands having molecular weight and Rf value ranging from 38.46­–52.76 KDa and 0.192–0.353, respectively. The protein bands revealed in this region were pre-eminently discerned with medium to high intensity of proteins at loci – m, n and o whose Rf value lie between 0.295–0.353. Two bands with low and high intensities of protein were present at loci – h and i. A single band with all low intensities of protein (at locus – j) and low and moderate intensities of protein were appeared at locus – l. At locus – g, a single band of low intensity protein with Rf value of 0.192 and molecular weight 52.76 KDa was apparent in Daulot whereas no bands of protein was observed in the rest of the twelve variants of Brassica at this locus, which made the band to be envisaged as an unique band (positive unique band) and assist in distinguishing the variant – Daulot from the other examined variants of Brassica (Table 2 and Figs. 1A–B). The region – III was characterized with very low intensities of protein bands found to be present at loci – p to s with molecular weight and Rf values ranging from 16.36–30.45 KDa and 0.501–0.854 (Table 2 and Figs. 1A–B). By taking into account the intensity of protein bands in different loci of the entire electrophoretic profile, it was observed that the region – II was more diverse with an average of 3 bands as compared to region – I and III, where the average numbers of bands were 2 and 1.33, respectively.

The change-over in the staining intensity and number of the polypeptide bands might be by virtue of differential extraction or disparity in solubility of protein or inadequacy of separation of varied sorts of proteins having identical migration rates23. They also suggested that the qualities of bands (i.e., the difference in the number, position and intensity of bands) in varieties even in accessions of the same species are governed through the quantitative gene system. Observations based on intensity of protein bands from different varieties of Brassica species were reported by many investigators13, 15, 24-25.Likewise, delineations on divergent plant species as regards to the intensities of protein bands was debriefed by Odeigah et al.26 from Nigerian varieties of pepper, Devi27 in sunflower, Varma et al.28 in maize genotypes, Vijayan29 in rice, Paul and Datta30 in celery and ajowan, Nisha31 in wheat, Sumathi32 in oats, Abdulrahaman et al.33 in lady’s finger and Begum and Alam34 in chick-pea.

Divergence within the loci concerning the position, staining intensity and values of molecular weight were observed in the electrophorogram (Table 2 and Figs. 1A–B). Two bands with molecular weight 55.72 and 49.25 KDa (one low and another one was high in intensity) were obtained at loci – f and i, respectively which were found to be present in all the inquired variants of B. rapa (Tori-7, TS-72, SS-75, BS-6, BS-9, BS-12, BS-14 and BS-15) whereas two consecutive bands of very low intensity with molecular weight of 30.45 and 27.89 KDa at loci – p and q were spotted out from the variants of B. juncea and B. napus (Daulot, Rai-5, BS-10, BS-11 and BS-7). The presence of bands with particular molecular weight at definite locus within particular species made us to imply that the species B. rapa exhibited species specific bands at loci f and I of molecular weight 55.72 and 49.25 KDa. Concurrently, B. juncea and B. napus displayed species specificity for molecular weight 30.45 and 27.89 KDa at p and q loci, discretely. Thereupon, in the light of diversity regarding to the position, intensity and values of molecular weight for each of the locus can be aided as feasible tool for proper distinguishing of species within the observed variants of Brassica by the electrophoresis of the total soluble protein from leaves.

In our present inquest, scrutiny of soluble protein banding pattern from leaves of thirteen tested variants of Brassica L. by PAGE technique presented three distinct different profiles and could be an excellent genre of biochemical fingerprint for discerning different variants of Brassica. The presence of a negative (-ve) unique band at locus – c in Rai-5 and a positive (+ve) unique band in each of the variety of BS-10 and Daulot at locus – d and g singly, could be esteemed as fingerprints for discerning these respective variants (Figs. 1A–B and Table 2).

Inter varietal locus variation can be deemed to be a mainspring for estimation of different degree of genetic divergence within diverse species, where non – appearances of a few protein polypeptides in few variants express variation and consequently taken into considered as polymorphic loci. Throughout the course of the prevailing analysis, inter varietal variation of loci among the thirteen variants of Brassica L. were also disclosed and presented in Table 3. Out of total nineteen loci; the loci – m and s are vitally monomorphic because of the prevalence of 100% protein bands. The remaining loci of the entire electrophorogram exhibited variation within themselves. The highest amount of variation was observed from loci – d and g with 92.31% of variability and 0.08 genetic disagreement, whereas the lowest amount of divergence was noticed from locus – c with 7.69% variability that exists of a high value of genetic disagreement (0.92) (Table 3).

Table 3: Inter varietal locus variation among the 13 variants of Brassica L.

Locus Present (%) Absent (%) Variation (%) Status Genetic disagreement
Locus a 11 (84.62%) 2 (15.38%) 15.38% Polymorphic 0.85
Locus b 4 (30.77%) 9 (69.23%) 69.23% Polymorphic 0.31
Locus c 12 (92.31%) 1 (7.69%) 7.69% Polymorphic 0.92
Locus d 1 (7.69%) 12 (92.31%) 92.31% Polymorphic 0.08
Locus e 10 (76.92%) 3 (23.08%) 23.08% Polymorphic 0.77
Locus f 9 (69.23%) 4 (30.77%) 30.77% Polymorphic 0.69
Locus g 1 (7.69%) 12 (92.31%) 92.31% Polymorphic 0.08
Locus h 6 (46.15%) 7 (53.85%) 53.85% Polymorphic 0.46
Locus i 11 (84.62%) 2 (15.38%) 15.38% Polymorphic 0.85
Locus j 6 (46.15%) 7 (53.85%) 53.85% Polymorphic 0.46
Locus k 8 (61.54%) 5 (38.46%) 38.46% Polymorphic 0.62
Locus l 4 (30.77%) 9 (69.23%) 69.23% Polymorphic 0.31
Locus m 13 (100.00%) 0 (0.00%) 00.00% Monomorphic 1.00
Locus n 9 (69.23%) 4 (30.77%) 30.77% Polymorphic 0.69
Locus o 7 (53.85%) 6 (46.15%) 46.15% Polymorphic 0.54
Locus p 5 (38.46%) 8 (61.54%) 61.54% Polymorphic 0.38
Locus q 5 (38.46%) 8 (61.54%) 61.54% Polymorphic 0.38
Locus r 7 (53.85%) 6 (46.15%) 46.15% Polymorphic 0.54
Locus s 13 (100.00%) 0 (0.00%) 00.00% Monomorphic 1.00
Total Polymorphism                                        89.47%

Besides, the showing up of different level of variableness in the loci of the studied variants  like 15.38% (at loci – a and i), 23.08% (at locus – e), 30.77% (at loci – f and n), 38.46% (at locus – k), 46.15% (at loci – o and r), 53.85% (at loci –  h and j), 61.54% (at loci – p and q) and 69.23% (at loci – b and l) along with respective genetic disagreement of 0.85, 0.77, 0.69, 0.62, 0.54, 0.46, 0.38 and 0.31 made it pondered to have worth mentionable genetic diversity among the quested varieties of Brassica L.

The proficiency of molecular marker approaches relies on the level of polymorphism within a group of inquired variants. During the study of PAGE, the nineteen bands of polypeptide were amplified of which seventeen (89.47%) were found to be polymorphic and the remaining two bands (10.53%) were monomorphic in nature (Fig. 2A). An average of 44.13% polymorphism was observed from the tested variants of Brassica L. (Table 4). The presence of high amount of polymorphism among the variants expressed by the proportion of polymorphic loci (89.47%), it can be suggested that a broad genetic variation may be present among the studied variants of Brassica L. From the outcome of the current study, the highest amount of polymorphism was documented from BS-10, which was 57.89%. As against BS-14 with 31.58% of polymorphism which was found as the lowest value of polymorphism among the examined variants of Brassica L. The studied variants of Brassica L. exhibited different degree of polymorphism displayed in Table 4 and Fig. 2B. Of the three investigated species of Brassica L., 42.11% and 42.76% of average polymorphism was revealed from B. napus and B. rapa, respectively whereas B. juncea was observed with 47.37% of average polymorphism (Table 4).

Vol17No4_Mol_Far_fig2 Figure 2: Percentage of polymorphism (A) total percentage of polymorphic and monomorphic protein bands, (B) percentage of polymorphism obtained from thirteen different variants of Brassica L.

Click here to View figure

Table 4:  Levels of polymorphism within 13 variants of Brassica L.

Variants of Brassica


No. of polymorphic bands % of polymorphism  in Brassica variants Average  % of polymorphism  in each Brassica species Average  % of polymorphism in 13 Brassica variants
Brassica juncea var. Daulot 8 42.11 47.37
B. junceavar. Rai-5 10 52.63
B. juncea var. BS-10 11 57.89
B. juncea var. BS-11 7 36.84
B. napus var. BS-7 8 42.11 42.11 44.13
B. rapa var. Tori-7 8 42.11 42.76
B. rapa var. TS-72 7 36.84
B. rapa var. SS-75 10 52.63
B. rapa var. BS-6 7 36.84
B. rapa var. BS-9 9 47.37
B. rapa var. BS-12 10 52.63
B. rapa var. BS-14 6 31.58
B. rapa var. BS-15 8 42.11

As stated through Majumder et al.35 assessment of genetic diversity aided with protein markers have been ascertained as a sterling tool in characterization of many crops species at gene level. The values of Nei’s19 gene diversity and Shannon’s information index20 for the inquired Brassica variants across all the loci are provided in Table 5 and Fig. 3. The estimation of Nei’s19 genetic diversity for all the variants was 0.3488 ± 0.1726 and Shannon’s information index was 0.5098 ± 0.2299. Estimation of Nei’s19 gene diversity (0.3488) and Shannon’s information index (0.5098) across all loci (Table 5) also assisted with the subsistence of high level of genetic variation in all studied materials of Brassica L.

Table 5: Estimation of genetic variability among 13 variants of Brassica L.

Locus

Nei’s (1973) gene diversity ( h )

Shannon’s information index ( i )

Locus a 0.3550 0.5402
Locus b 0.4260 0.6172
Locus c 0.1420 0.2712
Locus d 0.1420 0.2712
Locus e 0.3550 0.5402
Locus f 0.4260 0.6172
Locus g 0.1420 0.2712
Locus h 0.4970 0.6902
Locus i 0.4970 0.5402
Locus j 0.3550 0.6902
Locus k 0.4970 0.6902
Locus l 0.4260 0.6172
Locus m 0.0000 0.0000
Locus n 0.4260 0.6172
Locus o 0.4970 0.6902
Locus p 0.4794 0.6663
Locus q 0.4794 0.6663
Locus r 0.4970 0.6902
Locus s 0.0000 0.0000
Mean 0.3488 0.5098
St. Dev 0.1726 0.2299
Vol17No4_Mol_Far_fig3 Figure 3: Estimated genetic diversity (Nei’s genetic diversity, Shannon’s information index and proportion of polymorphic loci found at different loci) of studied Brassica variants.

Click here to View figure

The only disclosure on PAGE for leaf stored protein of Brassica L. was reported by Akbar et al.11, in which an average of 20.64% polymorphism was documented from three different varieties of the species – B. rapa, B. juncea and B. napus. Hence it can be suggested that more number of varieties and species are required to assess the degree of polymorphism of Brassica L. The determination of our existing perusal has been then assimilated with the findings of Mukhlesur and Hirata14, where the cultivars of B. rapa, B. juncea, B. napus, B. carinata, B. oleracea and hexaploid Brassica from various geographical origins were examined for leaf protein analysis by SDS-PAGE and the consequence of their analysis found incongruous with the outcome of the current study because they observed no significant difference within the examined cultivars even between different species of Brassica. The possible reasons for such type of inconsistency may be due to – (i) difference in morphology, ploidy level and constituents of genome, (ii) for different geographical distribution of the respective variants, (iii) difference in cultural practices, (iv) difference in methodological approaches.

Mentionable amount of studies have been performed early by many workers concerning the degree of polymorphism for total seed storage protein of Brassica as well as other species of cereal, pulses and oilseed crops with SDS-PAGE technique throughout the world. 21.20% of polymorphism was recorded within the varieties of B. campestris imitated by 6.30% in B. napus and 3.20% in B. juncea after evaluating varied varieties of distinctive Brassica species (Mukhlesur and Hirata)14. Ibrahim et al.17 apprised 58.00% of polymorphism from 53 genotypes of Indian mustard (B. juncea L.) germplasm. 94.44% polymorphism was reported from the diverse genotypes of Eruca sativa by Shinwari et al.36. From six cultivars of Egyptian soybean, a total of 30.43% polymorphism was assayed by Rayan and Osman37, 63.2% polymorphism was conveyed by Hlozáková et al.38 in four European cultivars of common wheat, in hundred-five accessions of Pakistani sesame 70.00% polymorphism was debriefed by Akbar et al.39, 82.00% of polymorphism have been evaluated by Vivodík et al.40 from fifty-six genotypes of Tunisian castor bean. Bhargav et al.41 assessed 91.00% of polymorphism from twenty Indian local genotype of common bean.

Knowledge on genetic similarity (distance) between germplasm and among individuals or populations is beneficial in an exceedingly breeding application since it lets incorporation of germplasm and offers greater effective sampling of germplasm to go for the improvement of populations. In the current research, the dendrogram constructed from the UPGMA analysis and coefficients of distance matrix unconcealed great connections between a numbers of variants (Fig. 4 and Table 6). By taking into account the banding pattern of leaf protein, genetic distance matrix for all the thirteen quested samples of Brassica variants were determined concurring to Nei’s21 genetic distance (Table 6).

Table 6: Summary of Nei’s genetic distances of 13 variants of Brassica L.

Brassica variants Daulot Rai-5 BS-10 BS-11 BS-7 Tori-7 TS-72 SS-75 BS-6 BS-9 BS-12 BS-14 BS-15
Daulot 0
Rai-5 0.3795 0
BS-10 0.4595 0.3054 0
BS-11 0.4595 0.1719 0.3795 0
BS-7 0.3795 0.2364 0.3054 0.0541 0
Tori-7 0.5465 0.5465 0.6419 0.3054 0.2364 0
TS-72 0.8650 0.8650 0.9985 0.5465 0.6419 0.3054 0
SS-75 0.7472 0.9985 0.8650 0.8650 0.9985 0.5465 0.1719 0
BS-6 0.8650 0.8650 1.3350 0.5465 0.6419 0.3054 0.2364 0.3054 0
BS-9 0.6419 0.6419 0.9985 0.5465 0.6419 0.4595 0.3795 0.3054 0.1112 0
BS-12 0.7472 0.7472 0.8650 0.6419 0.7472 0.5465 0.4595 0.2364 0.1719 0.0541 0
BS-14 0.7472 0.9985 1.5581 0.6419 0.7472 0.3795 0.1719 0.2364 0.0541 0.1719 0.2364 0
BS-15 0.7472 0.7472 1.1527 0.4595 0.5465 0.2364 0.1719 0.2364 0.0541 0.1719 0.2364 0.1112 0

Genetic variation among the variants typically screen via the way of means of genetic distance matrix. In our existing disclosure, the values of pair-wise comparison of Nei’s21 genetic distance among thirteen Brassica variants ranged from 0.0541 to 1.5581 (Table 6 and Fig. 4). The highest genetic distance was observed between BS-10 and BS-14 (1.5581) among the variants (Table 6) that indubitably demonstrated the presences of greater genetic distance between these two populations, notably the previous one representing the variant of B. juncea whilst the last mentioned one represented the variant of B. rapa. Likewise, pair wise genetic distance with relatively high values was detected between BS-10 and BS-6 (1.3350), BS-10 and BS-15 (1.1527), BS-10 and TS-72 (0.9985), BS-10 and BS-9 (0.9985), BS-7 and SS-75 (0.9985), Rai-5 and SS-75 (0.9985), Rai-5 and BS-14 (0.9985).  Contrastingly, the lowest genetic distance was found between BS-9 and BS-12 (0.0541), both were variants from B. rapa (Table 6). The difference between the highest (1.5581) and the lowest value of genetic distance (0.0541) revealed the wide range of genetic variability persisting among the thirteen rapeseed-mustard variants. High genetic distance values between variants pair may be found because of difference in hereditary constituents. Taking account the genetic distance values, the findings revealed that variants were genetically distinctive from each other and which may well be utilized in breeding program to achieve potential hereditary picks up.

Vol17No4_Mol_Far_fig4 Figure 4: Dendrogram of thirteen Brassica variants produced by UPGMA clustering method based on Nei’s (1972) genetic distance.

Click here to View figure

Based on Nei’s21 genetic distance obtained from protein banding pattern, a dendrogram was drawn up employing UPGMA in which the thirteen variants of Brassica were differentiated into two main clusters or groups C1 and C2 (Fig. 4). The first cluster C1 consisted of five variants of Brassica of which four variants from B. juncea (Daulot, Rai-5, BS-10 and BS-11) and one variant from B. napus, BS-7 were present. The explanation for two species (B. juncea and B. napus) had a place to same cluster is probable that the nearly introduced genotype might be shared some genes from the AA genomic base of the two variants which have been considered in this study. It might also possibly that the alleles of CC genome of the species (B. napus) may be near to that of the other elemental variants of the same cluster. The cluster or group C1 was divided into two sub-clusters. Daulot was found to be present in sub-cluster I (SC1) of cluster C1, and sub-cluster II (SC2) was further divided into two sub-sub cluster where sub-sub cluster II (SSC2) was found with only BS-10. Concurrently, sub-sub cluster I (SSC1) was consisted of three closely related variants of Rai-5 with BS-11 and BS-7. On the other hand, the major cluster C2 included eight variants of B. rapa (Tori-7, TS-72, SS-75, BS-6, BS-9, BS-12, BS-14 and BS-15) and divided into two sub-clusters (SC1) and (SC2). The sub-cluster (SC1) of cluster C2 was presented with Tori-7 alone; however the second sub-clusters (SC2) included the rest of the variants of B. rapa. The second sub-clusters (SC2) further segregated into two sub-sub clusters; SSC1 and SSC2. In sub-sub cluster I (SSC1), there was TS-72 and SS-75 whereas sub-sub cluster II (SSC2), was further divided in two sub-sub-sub clusters. Sub-sub-sub cluster I was present with three closely related variants of BS-6, BS-14 and BS-15 whereas, in sub-sub-sub cluster II there was BS-9 and BS-12 with minimal genetic distance of 0.0541. It was observed that the five variants of B. rapa found in sub-sub-sub cluster II showed low genetic distances among them ranging from 0.0541–0.2364. In this way, there was a limpid clustering pattern of geographically closer variants within the present ponder showing that the affiliation between genetic relatedness and geological distance has significance.

Presently, after the comparison between the come out of physio-morphological and agronomic traits and genetic distance matrix (Table 1 and Fig. 4) of the inquired variants of Brassica, it was revealed that in the first cluster C1, Daulot, Rai-5, BS-10, BS-11 and BS-7 had almost the similar seed color (reddish brown to black seed) and other agronomic characteristics (such as – tolerance to biotic and aboitic stresses of environment). Similarly, in the major cluster C2 – the morphological traits which include seed coloring were alike in BS-6, BS-14 and BS-15 (yellow seeded variants), whereas in BS-9 and BS-12 (reddish brown seeded variants). It was also observed that SS-75 and TS-72 grouped in a distant pair based on agronomic aspects (susceptibility to pest and environmental factors) and deviated from black seeded variety Tori-7 via cluster analysis (Fig. 4 and Table 1). The report of Saha et al.42 on genetic assessment of four Brassica species through RAPD marker found more or less congruent with our current disclosure that yellow seeded Brassica variants could be separated from the brown seeded variants by cluster analysis. Therefore, it looks through that cluster analysis would play a noteworthy implement in ascertaining genetic diversity regarding the diverse physio-morphological characters and other agronomic traits of plant species.

Conclusion

Genetic variation alludes to the differences within the constitutions of heredity in an individual of a species and it is imperative in keeping up the developmental steadiness and biological latent of plant species. More genetic variability within variants and noteworthy differentiation between variants states plenty of genetic resources of a species. The outcome of our existing quest exhibited differences in the position, number and staining intensity of protein bands among the studied variants which manifests the application of PAGE for differentiation of inquired variants of Brassica. High level of polymorphisms (89.47%) along with wide range of genetic distance (0.0541–1.5581) was viewed from the thirteen variants of Brassica. Broad range of polymorphism and genetic distance brought to light the presence of wide variability within Brassica spp. The variants of BS-10 and BS-14 contain the highest genetic variation, whereas BS-9 and BS-12 contain the lowest genetic variation among the variants employed in this analysis. Variants having near vicinity in their origin, morphological traits and stratagem of breeding are possibly to have less genetic distance from each other. Hence, the results of this inquisition put forward for consideration that the variants of BS-10, BS-9, BS-12 and BS-14 could furnished the amenities for selection as parental source in coming breeding program to ameliorate Brassica variants in Bangladesh. However, it is  recommended that exceeding molecular information is required to own better evaluation of genetic variability of Brassica germplasm in Bangladesh as well as currently launched varieties/ lines and therefore more efficacious utilization of existing variability for advancement of Brassica crop in Bangladesh.

Acknowledgement

The authors expressed their gratitude to the Oilseed Research Center of Bangladesh Agricultural Research Institute (BARI) for providing the seeds of thirteen variants of Brassica L.

Conflict of Interest

The authors pertaining to this research work declared no conflict of interest.

Funding Source

Ministry of Science and Technology, Government of the People’s Republic of Bangladesh granted the financial support for conducting this research work.

References

  1. Kasem W. T., Ghareeb A., Marwa E. Seed morphology and seed coat sculpturing of 32 taxa of family Brassicaceae. Am. Sci. 2011; 7(2): 166–178.
  2. Gomez – Campo C. Studies on Cruciferae V. Chromosome numbers for twenty-five taxa. Anales del Instituto Botanica A. J. Cavanilles. 1980; 35: 177–182.
  3. Nagahara U. Genome analysis in Brassica with special reference to the experimental formation of napus and peculiar mode of fertilization. Jpn. J. Bot. 1935; 7: 389–452.
  4. Hedge I. C.: A systematic and geographical survey of old world Cruciferae. In: The biology and chemistry of the Cruciferae (Vaughan JG, MacLeod AJ, Jones BMG, eds). New York: Academic Press. 1976; pp 1–46.
  5. Yarnell S. H. Cytogenetics of the vegetable crops. II. Crucifers. Rev. 1956; 22: 81–166.
    CrossRef
  6. Thiyam U., Kuhlmann A., Stockmann H., Schwarz K. Prospects of rapeseed oil by-products with respect to antioxidative potential. R. Chim. 2004; 7(6): 611–616.
    CrossRef
  7. Cover C. M., Hsieh S. J., Tran S. H., Hallden G., Kim G. S., Bjeldanes L. F., Firestone G. L. Indole-3-carbonyl inhibits the expression of cyclin-dependent kinase-6 and induces a G1-cell cycle arrest of human breast cancer cells independent of estrogen receptor signaling. J. Biol. Chem. 1998; 273(7): 3838–3847.
    CrossRef
  8. Staub R. E., Feng C., Onisko B., Bailey G. S., Firestone G. L., Bjeldanes, L. F. Fate of indole-3-carbinol in cultured human breast tumor cells. Res. Toxicol. 2002; 15(2): 101–109.
    CrossRef
  9. Zhang J., Yuan Q., Meng Y., Li X., Nan Z., Wang Y., Zhang W. A genetic diversity analysis of wild Lespedeza populations based on morphological characters, allozyme and RAPD methods. Plant Breed. 2007; 126: 89–94.
    CrossRef
  10. Ghodsvali A., Khodaparast M. H. H., Vosoughi M., Diosady L. L. Preparation of canola protein materials using membrane technology and evaluation of meals functional properties. Food Res. Int. 2005; 38(2): 223–231.
    CrossRef
  11. Akbar F., Paul M., Begum K. N. Karyological and genetic diversity study using molecular marker among three species of oilseed Brassica Ind. J. Pure App. Biosci. 2020; 8(4): 267–281.
    CrossRef
  12. O’Farrell P. H. High resolution two-dimensional electrophoresis of proteins. Biol. Chem. 1975; 250(10): 4007–4021.
    CrossRef
  13. Turi N. A., Farhatullah, Rabbani M. A., Khan N. U., Akmal M., Pervaiz Z. H., Aslam, M. U. Study of total seed storage protein in indigenous Brassica species based on sodium dodecyl sulfate polyacrylamide gel electrophoresis (SDS-PAGE). J. Biotechnol. 2010; 9(45): 7595–7602.
  14. Mukhlesur R. Md., Hirata Y. Genetic diversity in Brassica species using SDS-PAGE analysis. Biol. Sci. 2004; 4(2): 234–238.
    CrossRef
  15. Sadia M., Malik S. A., Rabbani M. A., Pearce S. R. Electrophoretic characterization and the relationship between some Brassica Electron. J. Biol. 2009; 5(1): 1–4.
  16. Zada M., Zakir N., Rabbani Z., Shinwari Z. K. Assessment of genetic variation in Ethopian mustard (Brassica carinata Braun) germplasm using multivariate techniques. Pak. J. Bot. 2013; 45: 583–593.
  17. Ibrahim M. I., Abbasi F. M., Rabbani M. A., Inamullah, Jan S. A., Ilyas M., Khurshid H. Evaluation of genetic variation among Indian Mustard (Brassica juncea) genotypes by SDS-PAGE method. Proc. Pakistan Acad. Sci. (B. Life and Environmental Sciences) 2017; 54(4): 333–339.
  18. Lowry O. H., Rosebrough N. J., Farr A. L., Randall R. J. Protein measurement with the Folin phenol reagent. Biol. Chem. 1951; 193(1): 265–275.
    CrossRef
  19. Nei M. Analysis of gene diversity in subdivided populations. Natl. Acad. Sci. 1973; 70(12): 3321–3323.
    CrossRef
  20. Lewontin, R. C.: The apportionment of human diversity. In: Evolutionary Biology (Dobzhansky T, Hecht MK, Steere WC, eds). Heidelberg: Springer. 1972; pp 381–398.
    CrossRef
  21. Nei M. Genetic distance between populations. Nat. 1972; 106(949): 283–292.
    CrossRef
  22. Yeh F. C., Yang R. C., Boyle T. B. J., Ye Z. H., Mao J. X. POPGENE, the user-friendly software for population genetic analysis. Biol. Biotechnol. Cent. 1999; University of Alberta, Canada.
  23. Ladizinsky G., Hymowitz D. Seed protein electrophoresis in taxonomic and evolutionary studies. Appl. Genet. 1976; 54: 145–151.
    CrossRef
  24. Geetha V. V., Balamurugan P. SDS PAGE electrophoresis in mustard cultivars. J. Agric. Res. 2011; 6(5): 437–443.
    CrossRef
  25. Kakaei M., Kahrizi D. Study of seed proteins pattern of Brassica napus varieties via sodium dodecyl sulfate polyacrylamid gel electrophoresis. Res. J. Biotechnol. 2011; 2(1): 26–28.
  26. Odeigah P. G. C., Oboh B., Aghalokpe I. O. The characterization of Nigerian varieties of pepper, Capsicum annuum and Capsicum frutescens by SDS-polyacrylamide gel electrophoresis of seed proteins. Resour. Crop Evol. 1999; 46: 127–131.
    CrossRef
  27. Devi S. G. Varietal identification through electrophoresis in sunflower (Helianthus annus) 2000; Master’s thesis, Tamil Nadu Agricultural University, Coimbatore.
  28. Varma V. L. K., Reddy N. M., Keshavulu K., Ankaiah R. Characterization of maize (Zea mays) genotypes through seed protein electrophoresis (SDS-PAGE). Crop. Res. 2005; 30: 124–127.
  29. Vijayan R. Organic seed production in rice cv. ADT 43. 2005; Doctoral dissertation, Tamil Nadu Agricultural University, Coimbatore.
  30. Paul R., Datta A. K. Seed protein profiles in celery (Apium graveolens) and Ajowan (Trachyospermum amni L.) plant types. Int. J. Plant. Sci. 2006; 1(1): 36–38.
  31. Nisha C. Assessment of seed quality in wheat (Triticum aestivum L.) varieties as influenced by different alien rust resistant genes under varying production conditions. 2007; Doctoral dissertation, Tamil Nadu Agricultural University, Coimbatore.
  32. Sumathi S. Varietal identification in oats (Avena sativa ). 2007; Master’s thesis, Tamil Nadu Agricultural University, Coimbatore.
  33. Abdulrahaman A. A, Kolawole O. S., Onile O. G., Oladele F. Seed electrophorentic characterization and taxonomic implications of some accessions of Abelmoschus esculentus (Moench) in Nigeria. Jewel J. Sci. Res. 2015; 3(1): 136–145.
  34. Begum K. N., Alam Sk. S. Genetic diversity in nine chick-pea (Cicer arietinum) varieties based on different molecular markers. Bangladesh J. Bot. 2019; 48(1): 195–203.
    CrossRef
  35. Majumder D. A. N., Hassan L., Rahim M. A., Kabir M. A. Analysis of genetic diversity in mango (Mangifera indica) using isozymetic polymorphism. Afr. J. Biotechnol. 2012; 11(87): 15310–15323.
  36. Shinwari S., Akbar F., Rabbani M. A., Mumtaz A. S., Shinwari Z. K. Evaluation of genetic diversity in different genotypes of Eruca sativa from Pakistan by SDS-PGE analysis. J. Bot. 2013; 45(4): 1235–1240.
  37. Rayan W. A., Osman S. A. (2019). Phylogenetic relationships of some Egyptian soybean cultivars (Glycine max) using SCoT marker and protein pattern. Bull. Natl. Res. Cent. 2019; 43(161).
    CrossRef
  38. Hlozáková T. K., Gregová E., Vivodík M., Gálová, Z. Genetic diversity of European cultivars of common wheat (Triticum aestivum) based on RAPD and protein markers. J. Cent. Eur. Agric. 2016; 17(4): 957–969.
    CrossRef
  39. Akbar F., Yousaf N., Rabbani M. A., Shinwari Z. K., Masood M. S. Study of total seed proteins pattern of sesame (Sesamum indicum) Landraces via sodium dodecyl sulfate polyacrylamide gel elecrophoresis (SDS-PAGE). Pak. J. Bot. 2008; 44(6): 2009–2014.
  40. Vivodík M., Saadaoui E., Balážová Ž., Gálová Z., Petrovičová L. Characterization of Tunisian castor bean genotypes using SDS-PAGE of total seed storage proteins. S. J. F. Sci. 2018; 12(1): 701–706.
    CrossRef
  41. Bhargav S., Rai G. K., Mallick S. A., Rai S. K., Kumar R. R., Singh M., Parveen A., Jamwal D., Saikia S. L., Bagati S. Assessment of genetic diversity in local genotypes of common bean (Phaseolus vulgaris) using biochemical markers. The Bioscan 2016; 11(3): 1955–1961
  42. Saha S., Molla Md. R., Chandra D., Rahman, L. Assessment of genetic variation and relationships within the varieties of four Brassica species by RAPD markers. J. Crop Sci. 2008; 2(3): 105–114.

Prevalence and Risk Factors of Hepatitis B among Blood Donors in Al-Najaf Governorate

$
0
0

Introduction

Hepatitis B virus (HBV) infection is a global problem. Two billion people were infected by hepatitis B virus and more than 360 million individuals suffer from chronic HBV infection. About 600,000 people die from hepatitis infection or the virus associated liver tumors called Hepatocellular Carcinoma (HCC). [1].

In Africa, more than fifty million people are chronically infected with hepatitis B, with about 25% risk of mortality. The rate of hepatitis B carriers in Africa (Sub-Sahara) is about 9%-20% [2]. The prevalence rate of the disease is about 4.8% to 21% in Ghana [3]. The causative agent of hepatitis B is an enveloped virus with Single Strand DNA (ssDNA) genome [4, 5]. When the virus replicates in the hepatocytes, the liver functions will be impaired and the infection will spread throughout the liver [6, 7]. Liver and hepatitis harm have increased as a consequence of the immune response against the virus in the liver cells [8].

Blood, blood products and body fluids such as vaginal secretions contain hepatitis B virus, and also the saliva of active carriers contains low concentrations of the virus [9]. The average incubation period of HBV is 90 days from the time of exposure to the onset of the symptoms but may vary from six weeks to six months [10].

The HBV transmission through blood and its products is a major health concern, especially in developing countries, where preparing the safe blood is still a primary challenge [11, 12]. The rate of viral hepatitis B infection is proportional to the rate of blood Transfusion Transmitted Hepatitis B Virus (TTHBV). The screening of the blood and its products prevents the transmission of infectious diseases that sometimes may not be cured. The only way to prevent the transmission of such diseases is to use more sensitive methods to examine the blood before transfusion [11, 12].

Materials and Methods

The diagnostic and research kits are listed in table 1 below.

Table 1: Kits that used by current study.

No. Kits Manufacture Origin
1 HBsAg Bio kit Spanish
2 Anti-HBc total Bio kit Spanish
3 HBsAg Ultra Vidas  kit Bio Merieux France
4 GOT/AST-P III Fujifilm Japan
5 GPT/ALT-P III Fujifilm Japan

Equipment and Materials

Table 2: The Equipment used by current study

 No. Equipment and Instruments Manufacturer Origin
1 ELISA washer ELx50 Bio Tek USA
2 ELISA reader ELx 800 Bio Tek USA
3 ELISA printer  Epson  LQ 300+II Bio Tek USA
4 Incubator Memmert Germany
5 Refrigerator DAIREI USA
6 Centrifuge Hettich Germany
7 Timer with alarm Rhythm China
8 Micropipette 10-100 Eppendorf Germany
9 Hematology Analyzer Diagon D-Cell 60 Hungary
10 Vidas and Mini vidas Biomerieux France
11 FUJIFILM-Dry chemo FUJIFILM Japan

Study Design

In brief, samples were collected from all the donors in addition to 20 apparently healthy controls. All the samples were typed for blood groups and tested by ELISA for HBsAg and anti-HBc antibody. Those who were diagnosed as infected by ELIZA as well as 10% of randomly selected samples with negative results were confirmed by ELFA. Then blood and liver factors were tested on patients and 20 healthy controls. After examining ELISA and VIDS, all samples were examined with tests for GOT, GPT enzymes, complete blood counts, and lymphocytes, as shown in Figure (1). Samples were collected from 16273 voluntary donors from (20/5/2016) to (12/12/2016). The presence of HBV was tested by enzyme-linked immunosorbent assay (ELISA) for HBsAg and anti-HBc antibody.

Methods

Diagnosis of HBsAg and Anti- HBc by ELISA–III

The detection of HBsAg anti-HBc was done by the use of the third generation of ELISA, technique using HBsAg and anti-HBc ELISA from BIO KIT (Spanish) and the assay was performed according to manufacturer ′s instructions.

Confirmatory of HBsAg by VIDAS (Mini VIDAS)

The confirmation of HBsAg was done by using VIDAS the assay was performed according to manufacturer ′s instructions. VIDAS HBsAg Ultra (HBs) is an automated qualitative test, the kit HBsAg Ultra from Biomerieux.

Results   

Clinical Samples Distribution

A total of 16273 blood were collected in the main blood bank of AL-Najaf governorate. The mean age of the donors is 38.5 ±5.09 years (range: 18–59). All the samples were examined for the presence of HBsAg and anti-HBc antibody. The results are shown in the Table (3).

Table (3) Numbers of HBV positive according to the markers of HBV.

No. of  Donors No. of HBsAg+ anti-HBc  positive No. of only HBsAg  positive No. of  only anti-HBc positive Total
16273 42 (0.26 %) 8 (0.05 %) 278 (1.7 %) 328 (2.01%)

Our results showed that 42 people were HBsAg and anti-HBc positive (0.26%) and 41 out of them (97.6%) was male and the remaining one (2.4%) was female. It was also found that 278 individuals (1.7%) were only positive for anti-HBc antibody and eight individuals (0.05%) were positive for just HBsAg. All the donors were volunteers.

The prevalence of HBV exposure in Al-Najaf governorate was 2.01%, which 0.26% of them had an active infection. Eight individuals were only HBsAg positive means that they were at the beginning of HBV infection. Therefore, the incidence rate of HBV is 0.05%. The only anti-HBc antibody positivity indicating previous exposure that might be improved was seen in 278 people. Studies in the Middle East showed that the prevalence of HBsAg ranges from 4% to 5% in Iraq [13]. The present study shows the lower rate of this infection in Najaf city.

Gender of Donors

The classification of the data based gender in each age range group is shown in Table (4). The only notable fact of these tables is that the infection is less prevalent in women. But this could be a misinterpretation because the number of female participants are too small.

Table 4: The classification of samples by age and gender

Age of Groups No. of donors of males No. of donors of females Percent
18-27 yr. 3178 (19.5%) 21 (0.13%) 19.63 %
28-37 yr. 7623 (46.9%) 26 (0.16%) 47.06 %
38-47 yr. 1595 (9.8%) 15 (0.09%) 9.89 %
48-57 yr. 3426 (21.05%) 9 (0.06%) 21.11 %
58 and more 378 (2.3%) 2 (0.01%) 2.31 %
TOTAL 16200 (99.55%) 73 (0.45%) 16273 (100%)

Table 5: The classification of HBsAg and anti-HBc positive patients based on gender

Gender No. of  Patients Percent  %
 ⃰ Males 41 97.62 %
Females 1 2.38 %
Total 42 100 %
Test 4.25  Sign Males   *P < 0.05

*Statistically significant P value < 0.05

Profession of Patients

The results in chart (1) indicate the drivers can be infected by the virus more than the other professions significantly.

 Chart 1: Distribution of HBsAg and anti-HBc positive patients based on profession. Chart 1: Distribution of HBsAg and anti-HBc positive patients based on profession.

Click here to view Chart

 Chart 2: Distribution of HBsAg and anti-HBc positive patients according to residency Chart 2: Distribution of HBsAg and anti-HBc positive patients according to residency

Click here to view Chart

Complete Blood Counts (CBC) of Patients

The blood factors collectively called CBC were analyzed for the patients and controls Tables (6).

Table 6: The classification of HBV patients and healthy control according to CBC

RESULT N. of Control Percent % N. of Patients Percent% T test P< 0.05
WBC   Normal 11 55 19 45.2 3.2
Low 1 5 0 0 2.3
High 8 40 23 54.2 4.3
HB  Normal 10 50 39 92.9 6.6
Low 0 0 0 0 NON
High 10 50 3 7.1 8.1
 RBC  Normal 6 30 31 73.8 7.8
Low 0 0 0 0 NON
High 14 70 11 26.2 7.6
 PLT  Normal 17 85 32 76.2 3.3
Low 0 0 2 4.8 2.5
High 3 15 8 19 2.2
 MCHC  Normal 2 10 4 9.5 NON
Low 18 90 37 88.1 NON
High 0 0 1 2.4 NON
TOATL   20 100 42 100  

*Statistically significant P value < 0.05.

Statistical Analysis

This study was a kind of Cross-sectional study. Statistical analysis was done by using statistical package for social sciences (SPSS) version 17. The ANOVA test was used for the purpose of testing the differences between the means of the different variables, and the T-test was used to evaluate the differences between two groups. The LSD (Least Significant Differences) was used to detected significant differences between parameters, and Z-test was also used. P values less than the 0.05 was considered as statistically significant [14]. 

Discussion

To do this, 16273 volunteers were enrolled and blood samples were collected and analyzed. It was found that 42 people (0.26%) were infected as indicated by positivity for HBsAg and anti-HBc Antibody. This is lower than the report from Sulaimania governorate (0.67 [14], and it was also lower when compared to the neighboring Arab countries Lebanese blood donors (0.6%) [15], and much lower than Abuja (Nigeria) 17.5% [16]. It was much lower compared to Omani blood donors where HBsAg was present in 2.8% of the donors. [17]. Also, it was lower in AL-Anbar governorate, (west of Iraq) that the prevalence of HBsAg among screened total blood donors 16125 was 1.25%. [18].

The prevalence of chronic HBV infection is higher in men than women and this may be because of the rarity of volunteer female participants in this study.

In the current study, the prevalence of HBV result (2.01%) was similar to that in Sulaimania, Kurdistan Region-Iraq in 2006, which showed that the prevalence of HBV was 2.3% [19]. Our results showed the frequency of 0.31 for HBsAg which is lower than the prevalence reported for adults in New Zealand which showed that the prevalence of HBsAg was 0.5% [20]. The prevalence of HBsAg in our samples was lower than the result of Shahrekord (a city located in the west of Iran). Results showed HBsAg positivity in 1.78%; It is also lower than Shiraz (South-west Iran) where HBsAg was detected in 1.07% of samples; and Ghazvin (west-central) with HBsAg positivity of 1.08%; and also lower than HBsAg positivity reported from Kashan (center) which was 0.5%; and much lower than Tehran (North-central) with HBsAg positivity 3.4% [21]. Also, it was much lower than the prevalence of HBV among blood donors in Kosovo is 4.2%. [22].

However, my result was lower than that of a study which was done in the western Brazilian Amazon, which included 2656 samples; 3.3% were positive for HBsAg [23]. In the current study, there was no significant relation of HBsAg positivity with all ages but only in age (28-37) P-value < 0.05, while in gender showed a relative significance P-value < 0.05; a result which is similar to that of Blakely T. et al study [24].

Based on profession the current study revealed a significant relation of HBsAg positivity with the drivers 14 (33.3%) where the X2 calculation reached to (13.6) which is greater than the value of X2 (11.07) at a level of significance (P < 0.05) table (6). While for the other jobs it was not significant. This result was compatible with results of a study (Hepatitis B Prevalence and Risk Factors in Blood donors in Ghazvin which revealed that unemployed people, drivers, and barbers in Iran are at high risk [21], the barbers are also a high-risk group for HBV infection in Turkey [25], and drivers are a high-risk group as shown in another study in Iran [21].

In the current study, the driving was proposed as a risk factor for HBV infection. This may be because the drivers may deal with sharp tools during repairing cars or may have a low level of education and therefore have risky behaviors or may have extramarital sexual contact.

Conclusions

The prevalence of HBV among blood donors in Najaf is 2.01%.

The ratio of infected male to infected female blood donors was approximately 97.62%: 2.38%.

The prevalence of HBV among blood donors in the urban area (88.1%) is higher than the rural (11.9) area.

The driving profession has the higher risk for HBV infection among other professions.

The age group with the highest frequency of viral hepatitis B in Najaf governorate is 28-37 years old.

The study showed significant differences between patient’s hepatitis B and control in SGOT and SGPT.

The study showed a linear relationship between SGOT and SGPT.

The current study showed a P-probability of less than 0.05 in lymphocytes among patients with hepatitis B and control.

References

  1. Colin W.; Edgar S., P.; Lyn S., F.; Anthony E., F., and Beth P. B. (2006): Hepatitis B Virus Infection: Epidemiology and Vaccination. Epidemiologic Reviews. 28(1): 112-125.
    CrossRef
  2. Kiire C.F. (1996) The Epidemiology and Prophylaxis of Hepatitis B in Sub-Saharan Africa: A View from Tropical and Subtropical Africa. Journal of Gastroenterology and Hepatology. 38(2): 5-12.
    CrossRef
  3. Ghana Immunization Programme (2010). Comprehensive Multiyear Plan (2010-2014) in line with Global Immunization Vision and Strategies: 10-45.
  4. Taylor M., Purcell R.H., and Farci P. (2013) Hepatitis D (Delta) Virus. In: Knipe, D.M. and Howley, P.M., Eds., Fields Virology, 6th Edition, Lippincott Williams & Wilkins, Philadelphia. Open Journal of Medical Microbiology:4 (1) (2014).
  5. Tong M.J., Hsu, Chang P.W., and Blatt L.M., (2011). Evaluation of Current Treatment Recommendations for Chronic Hepatitis B: A 2011 Update. Journal of Gastroenterology and Hepatology. 26: 829-835.
    CrossRef
  6. Adams D.H., and Hubscher S.G. (2006). Systemic Viral Infections and Collateral Damage in the Liver. American Journal of Pathology.168: 1057-1059.
    CrossRef
  7. Vinciguerra M., Mazzoccoli G., Piccol C., Tataranni T., Andriel A., and Pazienza V. (2013). Exploitation of Host Clock Gene Machinery by Hepatitis Viruses B and C. World Journal of Gastroenterology.19: 8902-8909.
    CrossRef
  8. Rehermann B., and Nascimbeni M., (2005). Immunology of Hepatitis B Virus and Hepatitis C Virus Infection. Nature Review. Immunology: (5) 215-229.
    CrossRef
  9. CDC (2010) Sexually Transmitted Diseases Treatment Guidline. A. Kimberly, Workowski, Berman Stuart. (2010): 59(12):1-110.
  10. Mast , E., Weinbaum C., M., Fiore A., E., Alter M., J., Bell B., P., Finelli B.P., Rodewald L., Douglas E.L., Janssen M., R.S. and Ward, J. (2005). A Comprehensive Immunization Strategy to Eliminate Transmission of Hepatitis B Virus Infection in the United States: Recommendations of the Advisory Committee on Immunization Practices Part 1: Immunization of Infants, Children, and Adolescents. Morbidity and Mortality Weekly Report. Recommendations and Reports. 54: 1-31.
  11. MOH-Ghana (2006). National Blood Policy for the Health Sector: 5-25.
  12. World Health Organization (2006). Blood Transfusion Safety, Geneva: Page 2.
  13. Qirbi N., and Hall AJ., (2001). Epidemiology of hepatitis B virus infection in the Middle East. Eastern Mediterranean Health Journal. 7:1034-1045.
  14. The Iraqi Postgraduate Medical Journal 11, supplement. (2012).
  15. Ramia S., Ramlawi F., Kanaan M., Klayme S., and Naman R. (2005): Frequency and significance of antibodies against hepatitis B core (anti-HBc) antigen as the only serological marker for hepatitis B infection in Lebanese blood donors. Epidemiology and Infection. 133: 695–699.
    CrossRef
  16. Agbesor N., Innocent 1; E.2., Amala Smart; Zaccheaus A. (2013): Jeremiah 3 International Journal of Science and Research (IJSR) ISSN (Online): 2319-7064. Index Copernicus Value 6.14. Impact Factor (2015): 6.3917.
  17. Geraldine K., Adel, Intesar A., Jameel N., and Said H. (2006): Evidence of Occult Hepatitis B Virus Infection among Omani Blood Donors: A Preliminary Study. Medical Principles and Practice. 15:368–372.
    CrossRef
  18. Yassin H., Majid. (2016). Hepatitis B Surface Antigen Prevalence Among Screened Populations and Certain Risk Groups in AL-Anbar governorate, AL- Anbar Medical Journal. 13 (1): 14-19.
    CrossRef
  19. Mohammed O. Mohammed. (2006): Prevalence of Hepatitis-B and Hepatitis-C among Blood Donors in Sulaimania City. Journal of Zankoy Sulaimania, 9: Part A 115-24.
    CrossRef
  20. Blakely T1.; Salmond C., and Tobias M. (1998): Hepatitis B virus carrier prevalence in New Zealand: population estimates using the (1987) police and customs personnel survey. New Zealand Medical Journal. 111(1064):142-4.
  21. Doosti A., Amini- Bavil- Olyaee S., Tajbakhsh E., Adeli A., Mahboudi F. (2009): Prevalence of viral hepatitis and molecular analysis of HBV among voluntary blood donors in west Iran. New microbiological. 32: 193-198.
  22. HajrullahFejza and SkenderTelaku. (2009): Prevalence of HBV and HCV among blood donors in Kosovo. Virology Journal. 6:21.
    CrossRef
  23. Sebasteao V., Raymundo P. (2005): High prevalence of hepatitis B virus and hepatitis D virus in the Western Brazilian Amazon. Tropical Medicine and Hygiene. 73:808-814.
    CrossRef
  24. Bandaranayake, Salmond CE., Tobias MI. (1991): Occupational risk of hepatitis B for police and customs personnel. 134:1447-53.
    CrossRef
  25. Candan , Alagozlu H., Poyraz O., and Sumer H. (2002): Prevalence of hepatitis B and C virus infection in barbers in the Sivas region of Turkey. Occupational Medicine Journal (London). 52:31-4.
    CrossRef


Viewing all 1376 articles
Browse latest View live