Quantcast
Channel: Biosciences Biotechnology Research Asia
Viewing all 1376 articles
Browse latest View live

Augmentation of Non Specific Immunity in Rats by Aqueous Extract of Tribulus terrestris used in Traditional Systems of Medicines

$
0
0

Introduction

Macrophages play a critical role in the primary host defense against infection and also play a central role in inflammatory and host defense mechanism1 (Steller et al., 1995). Macrophages are ubiquitous mononuclear phagocytes in mammalian tissues and peritoneal macrophages are representative of other macrophage populations.² They are also readily available in large amounts in rats. Under physiological conditions, the peritoneal macrophages play an important role in the clearance of endotoxin.3 The sequence of functions carried out by macrophages in the course of their Phagocytic process (adherence to tissue, destruction of these agents by ROS production such as superoxide anion), represent the start of other biological activities that comprise the whole spectrum of immune response.4

Tribulus terrestris, commonly known as gokhru or puncture vine (F: Zygophyllaceae), is commonly used as a medicinal plant. It has been reported that Tribulus terrestris possess anti-inflammatory Fruits affects the liver, kidney, and cardiovascular system5 and are effective in urolithiasis, aging, antiseptic, inflammation and non-specific impotence.The fruits contain 5% of semidrying oil, peroxidase, traces of glycoside resin, proteins and inorganic matter,7 furastanol glycosides,8 Saponins isolated from the fruits are reported to have antihypertensive activity and inhibitory effect on breast cancer.9

Materials and Methods

Plant Material and Extract Preparation

Fruits of Tribulus terrestris was grounded to powder and extracted with Soxhlet apparatus using double distilled water for 48 hrs The extract was then concentrated on a rotatory evaporator below 400 C.The test extract was not soluble in water. Suspension in 0.1% sodium carboxy methylcellulose was used for administration to animals.

Test Animals

The experiments were performed on either sex of Swiss albino rats weighing 150-200g. The animals were household in standard conditions of temperature, humidity and light. Animals were provided with standard animal feed and tap water ad libitum.

Group Treatment

Group I Control

Received 0.1% carboxyl methyl cellulose (i.p.) for 7 days

Group II

Received 500 µg/kg b.w. of TE extract (i.p.) for 7 days.

Group III

Received 1 mg /kg b.w. of TE, (i.p.) for 7 days.

Group IV

Received and 2mg /kg b.w. of TE, i.p. for 7 days.

The animals were sacrificed by giving anesthesia by petroleum ether 24 hrs after the last dose for the study of various parameters.

Body Weight and Organ Weight

The body weight of the animals was recorded on day 1 (start of the treatment) and day 8th (before sacrifice). The weight of liver, kidney spleen and thymus was also recorded on day 8th after sacrificing the animals. The body weight gain (%) and relative organ weight (organ weight/100g of body weight) were calculated foe each animals.

Collection of Peritoneal Exudate Cells (PECs) and Cellularity Counts

After 24 hrs of last injection, peritoneal macrophage were obtained by a procedure described briefly, 15 ml of normal saline was injected intraperitoneally to the rats, the abdomen was messaged for 5 minutes and the peritoneal exudate cells (PECs), consisting of 60% lymphocytes and 40%macrophages were collected by syringe (5ml), were collected allowing recovery of 90-95 of the injected volume ‘Resting macrophages identified by morphology and neutral red staining, were counted and adjusted in RPMI-1640 with 10% FCS to 5 x 10⁵ macrophage\ml. cellular disability was routinely measured before and after each experiment by the trypan blue exclusion test10. In all cases disability was higher that 95%. All incubations were performed at 370C in a humidified atmosphere of 5% CO2.

Macrophage Activation

The phagocytic activity of PEC was evaluated using the suspension assay method of Fujiki and Yan9 with some modifications as described by Ahmad et al.,11. Briefly, 0.1 ml aliquot of 10 x106 cells/ml density in RPMI-1640 medium was mixed with 0.1 ml medium containing 20 percent FCS and 100 x 10 6 cells /ml of heat treated (at 1000C for 1 hr) yeast (Saccharomyces cereviceae) cells. The mixture was incubated at 370C for 1 hr with occasional shaking. After incubation, 50 µl of this mixture was smeared on the glass slide, air dried and stained with Wright Giemsa stain. The slides were observed under a light microscope (Olympus BX 50, Japan) using oil immersion. At least 500 cells were counted. The phagocytic activity was expressed as phagocytic Index (PI). The PI was calculated using the following formula:

PI = AxB,

where A: the percentage of yeast ingesting phagocytes; and B: the number of yeast cells engulfed per phagocyte.

Statistical Analysis

The statistical analysis of data was carried out using one way ANOVA.

Results

Relative Organ and Body Weight

The aqueous extract of the Tribulus terrestris at doses (0.5mg, 1mg and 2mg/kg b.w.) for 7 days showed no significant changes in relative organ and body weights in experimental animals compared to control group.

Cellularity of Peritoneal Exudate Cells

The results of PEC counts are shown in Table -1. The extract elicited a significant (p<0.001) and dose dependent increase in macrophage counts as compared to control group.

Table 1: Effect of aqueous extract of Tribulus terrestris on the peritoneal exudate cells population in rats

Treatment group (dose mg/kg) PEC x 106
Control 13.01 ± 1.96
Aqueous extract of Tribulus terrestris (0.5 mg/kg) 45.09 ± 3.85*
Aqueous extract of Tribulus terrestris (1 mg/kg) 147.65 ± 9.91*

Datas were expressed as Mean ± SE of 6 animals per group, *p<0.001 compared to control group

Phagocytic Activity

The extract at doses (0.5mg, 1mg and 2 mg/kg) caused stimulation of phagocytes as evidenced by a significant (P<0.001) increase in phagocytic index (Fig. -1).

Figure 1: Effect of aqueous extract of Tribulus terrestris on Phagocytic Index (PI) of PEC in rat. Figure 1: Effect of aqueous extract of Tribulus terrestris on Phagocytic Index (PI) of PEC in rat.

Click here to View Figure

Discussion

The aqueous extract of Tribulus terrestris showed stimulatory effect on macrophage function. The immune system, cells and effector molecules work in a close coordination and macrophages constitute an important cell type involved in the initiation of various immune reactions including neutralization of infectious agents or tumor cells.12-13 Activation of such reaction may help host to effectively neutralize the infection challenge. Peritoneal macrophages, as representative of macrophage population and other Phagocytic cells, play an essential role in the immune response of the host to inflammatory and infectious process such as endotoxic shock. Since the macrophages are involved in the pathogenesis, the study of the toxic effect of the reactive oxygen species produced by these cells is important for understanding the mechanism of toxins induced injury, as well as the possible therapeutics that can reduce this injury. Thus, the above study indicates its role as immunomodulator via macrophage activation.

Acknowledgements

This work was partially supported by grants from M.P. Council of Science and Technology, Bhopal, India.

References

  1. Steller, H. Science 267: 1445 (1995)
  2. Fernandez-Botran R, vetvicka V. CRC press: 244 (1995).
  3. Fujiki, K, Yano T. Fish Shellfish Immunol, 7: 417-27 (1997).
  4. Pramodkumar et al., J Sci Res Plants Med. 1: 9 (1980).
  5. Selected medicinal plants of India, CHEMEXCIL, Mumbai.
  6. Chopra, RN.: Indigenous drug in India. Academic publishers, Culcutta (1982).
  7. Tmova, M. et al., 1st Chem Biotechnology, Biol.Act. Nat. Prod., 3, 299 (1981), Chem, Abstr. 97: 156678v (1982).
  8. Jayaram S.; et al., Indian Drugs, 30(10): 498-500 (1993).
  9. Raisuddin S, Zaidi SIA , Singh KP, Ray PK, Drug chem. Toxicol, 15: 409-17 (1991).
  10. Mills G, Monticone V, Paetkau V., J Immunol., 117: 1325-30 (1976).
  11. Rosenstreich DL, Farrar JJ, Doughery S., 116: 131-9 (1976).
  12. Tagliabue A., Mantovani A, Kilgallen M, Herberman PB, Mc Coy JL, 122: 2363-70 (1979).

Constituents of Zizyphus Species: A Review

$
0
0

Introduction

The Zizyphus species of family Rhamnaceae are evergreen trees and shrubs distributed in wild states1. Around 50 species are growing in tropical and sub-tropical regions of the worlds of which 17 species are found in India1,2.

The freshly drupes of several species are eaten, Z. mauritiana is a source of one of the common fruits (Ber) in India and is found in both wild and cultivated states. The fruits has a high nutritional value and a great commercial potential. Z. jujuba Mill. Is the Chinese plant and the correct name of the Indian plant mentioned in most Indian floras as Z. jujuba Lam., a later homonym is Z.mauritiana. Lam. The fruits have been in cultivation for the last 400 years in both China and India1.

There are two main groups of Jujubes found in India: (i) The Chinese jujube (Z. jujuba Mill.) and (ii) the Indian of jujubes of which Z. mauritiana, with its several cultivated varieties, is important as a source of the fruits which are said to excel even apples in their content of protein, carotene and vitamin C, while another species, Z. nummularia is a prized for its leaves which provide fodder for livestock in summer moths, particularly in the folder-deficient areas of Punjab, Haryana and Rajasthan1.

Most of the Zizyphus species available in India finds use in Indian System of Medicine for the treatment of scabies, throat troubles, skin diseases, abdominal pain, diarrhoea, dysentery, healing of wounds, colds, coughs, bilious affections and also as tonic3,4. The seed of the Zizyphus species were evaluated pharmacologically, which revealed the central nervous system depressant activity, tranquilising and sedative activities5. The flavonoids and saponins isolated from Zizyphus species have shown neuroleptic activity by neurol deficit but do not have anticonvulsant or muscle relaxant activity6. The seeds of Zizyphus jujuba have exhibited sedative activity, which has been used since ancient times in medicine as a remedy for insomnia, and sleepiness must derive mainly to totally from the jujubogenin glycoside7.

It is reported that Zizyphus species contains considerable amount of cyclopeptide alkaloids and these alkaloids have antibiotic and antifungal properties. The use of Zizyphus species in the treatment of diarrhoea, dysentery, skin diseases and healing of wounds are well supported by the presence of these alkaloids270.

A review of literature revealed the presence of a number of cylcopeptide alkaloids, isoquinoline alkaloids, flavonoids, steroids, terpenoids and many other chemical constituents from different Zizyphus species. The chemical investigation of as many as 22 species of Zizyphus genus as mentioned below in Table -1 has been reported so far.

Zizyphus species are found to be a rich source of cyclopeptide alkaloids. A list of cyclopeptide alkaloids that have so far been isolated from different Zizyphus species are thus listed in Table -2 and other chemical constituents are listed in Table -3.

Table 1:

1 Zizyphus abyssinica Hoechst. Ex A. Rich
2 Z. amphibia A. Cheval
3 Z. hysodrica
4 Z hutchinsonii.
5 Z. joazeiro Mart.
6 Z. jujuba Mill.
7 Z. lotus
8 Z. mauritiana Lam.
9 Z. murcronata Willd.
10 Z. nummularia Wight and Arn.
11 Z. oenoplea Mill.
12 Z. rugosa Lam.
13 Z sativa Gaerrn.
14 Z. spina-christi.
15 Z. spinosus Semen
16 Z. trinervia  Roxb.
17 Z. vulgaris Lam.
18 Z. xylopyra Willd.
19 Z. rotundifolia
20 Z. obstusfolia
21 Z. mistol
22 Z. acidojujuba


Table 2: Cyclopeptide alkaloids reported from Zizyphus species

Name of the Plant source Name of the cyclopeptide alkaloids Plant source (References)
Zizyphine-A Z. oenoplia20,22,40 Mucronine-D Z. mucronata38,116,125
Z. jujuba129 Z. mummularia50
Z. jujuba57,132
Z. sativa69,93
Zizphine-B Z. enoplia20,31,40,44 Amphibine-F Z. spina-christi53
(Zizphinine) Z. mauritiaan47
Z. amphibia41
Amphibine-A Z. amphibia34 Amphibine – G Z. amphibia41
Z.spina-christi52
Amphibine-H Z. amphibia41
Z. mummularia50
Z. jujuba57
Amphibine-B Z.amphibia35 Z. xlopyra100
Z.mauritiana47 Z. spina-christi110,133
Z.oneoplia123
Amphibine-I Z. amphibia43,134
Amphibine-C Z.amphibia35
Murcronine-E Z. mucronata44
Amphibine-D Z.amphibia35 Murcronine-F Z. mucronata44
Z.mauritiana36,47 Murcronine-G mucronata44
Z.rugosa75
Z.vulgaris var. spinous109   
Amphibine-E Z. amphibia35,36 Zizyphine-C Z. oenoplia50
Z. mauritiana47
Z. spina-christi52 Zizyphine-D Z. oenoplia50
Mauritine-A Z. mauritiana36 Zizyphine-E Z. spina-christi110
Z. spina-christi52
Z. jujuba57 Zizyphine-F Z. oenoplia51
Z. spina-christi110
Mauritine-B Z. mauritiana36
Zizyphine-G Z. oenoplia51
Frangulanine Z. mauritiana36 Nummularine-D Z. nummularia55
Z. sativa93
Z. vurgaris Nummularine-E Z. nummularia55,105
var. spinousus99,101,109 Z. hysodrica75
Z. spinosus semen99
Z. jujuba100,102,132 Nummularine-F Z. nummularia55
Z. nummularia100
Z. lotus 122 Jubanine-A Z. jujba57
Z. oenoplia123,136 Z. spira-christi110
Z. nummularia91
Frangulanine Z. jujuba45,132 Abyssenine-C Z. abyssinica44
Z. sativa69 Z. mucronata48
Maruitine-D Z. mauritiana47 Sativanine-F Z. sativa90,93
Z. xylopyra95
Z. nummularia97 N-desmethyl- Z. nummularia91
Z. oenoplia123 jubanine-B
Marutine-E Z. mauritinana47 Nummularine-O Z. nummularia92
Marutine-F Z. mauritiana47 Sativanine-H Z. sativa94
Z. rugosa108
Nummularine-A Z. nummularia49
Z. jujuba57 Nummularine-P Z. nummularia97
Z. rugosa108
Nummularine-B Z. nummulaira49,86
Z. jujuba57,132 Rugosanine-A Z. rugosa103
Z. sativa69,93
Z. xylopyra95 Daechunie-S3 Z. jujuba107,132
Nummularine-C Z. nummularia49,132 Daechuine-S8-1 Z. jujuba107,132
Nummularine-G Z. nummularia61 Numularine-T Z. nummularia118
Nummularine-H Z. nummularia61 Sativanine-G Z. sativa87,93
Nummularine-K Z. nummularia61 Tscheschamine Z. sativa106
Z. xylopyra100
Daechuine-S6 Z. jujuba107,132
Five known Z. jujuba67
cylclopetide alkaloids Daechuine-S7 Z. jujuba 107,132
Daechuine-S10 Z. jujuba107,132
Sativanine-A Z. sativa69,93 Sajoinine-B Z. vulgaris var. spinosus99,109
Z. spina-christi96 Z. spinsosus Semen99
Sativanine-B Z. sativa69,93,137
Known 13- Z. jujuba76 Sanjoinine-F Z. vulgaris var, spinosus99,109
Membered Z. lotus122
cyclopeptide alkaloids
Daechunine-S5 Z. jujuba107,132
Daechuine-S15 Z. jujuba132
Lotusanine-A Z. lotus122
Sativanine-C Z. sativa85,93
Scutianine-C Z. jujuba129
Nummularine-N Z. nummularia86 Sanjoinenine Z. vulgaris var. spinosus99,109
Z. spinsosus Semen99
Sativanine-E Z. sativa88,93 Z. lotus122
Sativanine-D Z. sativa88,93
Sativanine-K Z. sativa98 Spinanine Z. spina-christi110
Nummularine-R Z. nummularia100 Nummularine-S Z. nummularia104
Two new Z. mucronata116 Hysodricanine-B Z. hysodrica112
cyclopetide alkaloids Hysodricanine-C Z. hysodrica128
Nummularine-M Z. nummularia86 Sanjoinine-Ah Z. jujuba113
1 Z. vulgaris var. spinosus113
(epimer of
Sanjoinine-A)
Franganine Z. spina-christi96
Z. jujuba132 Jubanine-C Z. jujuba115
Lotusine-A Z. lotus114,130
New cyclopeptide Z. jujuba115
Lotusine-D Z. lotus114,130 alkaloid
Mucronine-J Z.mucronata125 New 13-membered Z. oenoplia121
cyclopetide alkaloid
Lotusine-G Z. lotus130
Lotusein-B Z. lotus117,130 Lotusine-F Z. lotus117
Lotusien-C Z. lotus117,130 Sanjoinine-D Z. vulgaris var, spinosus99,109
Z. spinosus Semen99,111
Mauritine-J Z. mauritiana124
Daechuine-S24 Z. jujuba132 Sanjoinine-G Z. vulgaris var, spinosus99,109
Z. spinosus Semen99
Lotusine-E Z. lotus117,130
Jlubanine-D Z. jujuba120 Sanjonine-G2 Z. vulgaris var, spinosus99,109
Z. spinosus Semen99
Z. lotus122
Zizyphin-I Z. oenoplia119 Sanjoinine-A Z. vulgaris var, spinosus101,107
Jubanine-C Z. jujuba129 Z. jujuba127Z. spinosus Semen99
Lotusanine-B Z. louts122 Jubanine-B Z. jujuba57
Z. nummularia91,92
Deachucyclopeptide-1 Z. jujuba102,107,132
(Daechuine-S26)
Mucronine-A Z. muconata37 Hysodricanine-A Z. hysodrica58
Z. abyssininca44 Z. hutchinsonii75
Mucronine-B Z. mucronata37
Z. abyssinica44 Mauritine-H Z. mauritiana58
Mucronine-C Z. mucronata37 Sanjoinine-G1 Z. vulgaris var, spinosus126
Rugosanine-B Z. rugosa108 Abyssenine-A Z. abyssinica44
Z. mucronata48,125
Mauritine-C Z. mauritiana47 Z. oenoplia50
Z. spina-christi52,96
Z. nummularia91 Abyssenine-B Z. abyssinica44
Z. mucronata48
Aduetine Z. jujuba45,132 Z. oenoplia50
Table - 3: Chemical constituents, other than Cyclopeptide alkaloids reported from Zizyphus species Table 3: Chemical constituents, other than Cyclopeptide alkaloids reported from Zizyphus species
Click here to View Table

References

  1. “The Wealth of India” Raw Materials, XI, 111. Publication and Information Directorate. CSIR, New Delhi (1976).
  2. Hooker, J.D., “The Flora of British India”, 1, 632, Published by Reeve. L. and Co. 5, Henrietta Street, Covent Garden, London (1875).
  3. Kirtikar, K.R. and Basu, B.D., “Indian Medicinal Plants”, 1, 592, Ed. Blatter, E., Caisus, J.F. and Mhaskar, K.S. (1975).
  4. “Glossary of Indian Medicinal Plants” CSIR, New Delhi, 261 (1956).
  5. Watanabe, I., Japan J.Pharm.,23,563 (1973).
  6. Hyun, K., Sick, W.W. and Kyu, L.C., Saengyak Hakhoe Chi, 12,203 (1981).
  7. Shibata, S., Saito, H., Lee, Y.M., Takagi, K., Shoji, J. and Konod N., Japan J. Pharm., 27 (1977).
  8. Clifford, S.C., Arndt, S.K., Popp., M. and Jones, H.H., J. Expt.Botany, 53 (366), 131 (2002).
  9. Bisko, J. and Zellner, J., Montasch, 64, 12 (1935).
  10. Caserio, E., Z. Vitamin Forsch., 4,173 (1935).
  11. Chakraborty, R.K., Ind. J. Med. Research, 23, 347(1935).
  12. Kawoguti, R. and Kim, K.W., J. Pharm. Soc. Japan, 60, 343 (1940).
  13. Idem. Ibid, 60,235 (1940).
  14. Ren, H.T., Tang, T.H. and Chao, Y-H., J. Chinese Chem. Soc., 4, 278 (1936).
  15. Rosa, J.S. and Iachan, A., Anais. Assoc. Quim., Brazil, 10,236 (1951).
  16. Mehta, T.N., Rao, C.V.N. and Laximkantan, V., Ind. Soap Journal, 19, 94 (1953).
  17. Liebero, D., Autonaccio. Rev. Quim. Ind., 26,129 (1957).
  18. Majumdar, B., Sarkar, S.N. and Dutta, P.C., J. Ind. Chem. Soc., 33, 351 (1956).
  19. Singh, H., Seshadri, T.R. and Subramanian, G.B.V., Current Science, 34, 344 (1965).
  20. Menara, E.L., Mueller, J.M., Thomas, A.F., Bhatnagar, S.S. and Dastoor, N.J., Helv. Chim. Acta, 46, 1801 (1963).
  21. Rajadurai, S. and Margaret-Theresa, Y., Leather Science, 10, 222 (1963).
  22. Zbiral, E., Menard, E.L. and Mueller, J.M., Helv. Chim. Acta, 48, 404 (1965).
  23. Back, K.W., Lee, S.Y., Han, D.S., Kim, J.J. and Yorigu, N., Chunpon Nongkwa Taehak, 3, 21 (1969).
  24. Blouch, A.K. and Hujjatullah, S. Science Research (Dacca Pak.)6, 1 (1969).
  25. Kruglyakov, G.N. and Korobkine, Z.V., Vop, Pitn., 30, 84 (1971).
  26. Gutia, L. and Forsber, S., Farmacia (Bucharest), 18, 167 (1970).
  27. Masashi, T., Hatsue, A. and Akiko, I., Shoyakugakuzasshi, 23, 45 (1969).
  28. Akhmedov, U.A. and Khalmatov, Kh. Kh., Rast. Resur., 5, 578 (1969).
  29. Akhmedov, U.A. and Khalmatov, Kh. Kh., Polez Dikorastuschichie. Rast. Uzb Lkh. Ispot’s 154 (1968)
  30. Akhmedov, U.A. and Khalmatov, Kh. Kh., Farmalsiya, 16, 34 (1967).
  31. Pailor, M., Haslinger, E. and Zbiral, E., Montash, 100, 1608 (1969).
  32. Rao, V.S.S., Reddy. K.K., Sastry, K.N.S. and Nayudamma, Y., Leather Science, 15, 189 (1968).
  33. Shoyi, S., Yumiko, N., Osamu, T. and Osamu, D., Phytochemistry, 9, 677 (1970).
  34. Tschesche, R., Kaubmann, E.U. and Fehalhaber, H.-W., Tetrahedron Lett., 865 (1972).
  35. Tschesche, R., Kaubmann, E.U. and Fehalhaber, H.-W., Chem. Ber., 105, 3094 (1972).
  36. Tschesche, R., Wilhelm, H. and Fehalhaber, H.-W., Tetrahedron Lett., 2609 (1972).
  37. Fehlhaber, H.-W., Uhlendorf, J., David, S.T. and Tschesche, R., Liebigs Ann. Chem., 759, 195 (1972).
  38. Tschesche, R., David , S.T., Uhlendorf, J. and Fehlhaber, H.-W., Chem. Ber., 105, 3106 (1972).
  39. Kulshrestha, M. and Rastogi, R.P., Ind. J. Chem., 10, 152 (1972).
  40. Tschesche, R., Kaubmann, E.U. and Eckhardt, G., Tetrahedron Lett., 28, 2577 1973).
  41. Tschesche, R., Spilles, Ch. and Eckhardt, G., Chem. Ber., 107, 686 (1974).
  42. Aynehchi, Y. and Mahoodian, M., Acta Pharm. Suec.,10, 515 (1973).
  43. Tschesche, R., Spilles, Ch. and Eckhardt, G. Chem. Ber., 107, 1329 (1974).
  44. Tschesche, R., David, S.T. Zerbes, R., Von Radloff, M., Kaubmann, E.U. and Eckhardt, G., Liebigs Ann. Chem., 1915 (1974).
  45. Otsuka, H., Ogihara, Y. and Shibata, S., Phytochemistry, 13, 2016 (1974).
  46. Kawai, K., Akiyama, T., Ogihara, Y. and Shibata S., Phytochemistry, 13, 2829 (1974).
  47. Tschesche, R., Wihelm, H.M. Kaubmann, E.U. and Eckhardt, G., Liebigs Ann. Chem., 1964 (1974).
  48. Tschesche, R., Elgamal, M., Eckhardt, G. and Von Radloff, M., Phytochemistry, 13, 2328 (1974).
  49. Tschesche, R., Miana, G.A. and Eckhardt, G., Chem. Ber., 107, 3180 (1974).
  50. Cassels, B.K., Eckhardt, G., Kaubmann, E.U. and Tschesche, R., Tetrahedron, 30, 2461 (1974).
  51. Tschesche, Re., Khokhar, I, Spilles, Ch., Eckhardt, G. and Cassels, B.K., Tetradron Lett., 34, 2941 (1974).
  52. Tschesche, Re., Khokhar, I, Spilles, Ch., Phytochemistry, 13, 1633 (1974).
  53. Inoue, O., Yokoi, M. and Ogihara, Y., Nagoya Shiritusa Daigaku Yakugakubu Kenyu Nempo, 22, 36 (1974).
  54. Thakur R.S., Jain, M.P., Hruban, L. and Santray, F., Planta Med., 28, 172 (1975).
  55. Tschesche, R. Elgamal, M., Miana, G.A. and Eckhardt, G., Tetrahedron, 31, 2944 (1975).
  56. Ikram, M. and Tomlison, H., Planta Med., 28, 289 (1976).
  57. Tschesche R., Khokhar, I., Wilhelm, H. and Eckhardt, G., Phytochemistry, 15,541 (1976).
  58. Tscjescje, R., Hillebrand, D., Wilhalm, H., Ammermann, E. and Eckhardf, G., Phytochecistry, 16, 1025 (1977).
  59. Ziyaev, R., Iragashev, T., Isarailov, I.A., Yumusov, N.D. and Yumusov, S. Vu., Khim. Prir. Soedin, 2, 237 (1977).
  60. Srivastava, S.K. and Chauchan, J.S., Planta Med., 32, 384 (1977).
  61. Tschesche, R., Elgamal, M., Eckhardt, G., Chem. Ber., 110, 2649 (1977).
  62. Yagi, A., Okamura, N., Haraguchi, Y., Noda, K. and Nishioka, I., Chem. Pharm. Bull., 26, 1798 (1978).
  63. Otuska, H., Akiyama, T., Kawai, K., Shibata, S., Inoue, O. and Ogihara, Y., Phytochemistry, 17, 1349 (1978).
  64. Yagi, A., Okamura, N., Haraguchi, Y., Noda, K. and Nishioka, I., Chem. Pharm. Bull., 26, 3075 (1978).
  65. Chauhan, J.S. and Srivastava, S.K., Proc. Natl. Acad. Sci. India, 48, 1 (1978).
  66. Kokhar, I., Pak. J. Sci. Res., 30,81 (1978).
  67. Chughtai, M.I.D., Khokhar, I. And Tahira, F., Ibid, 18, 702 (1979).
  68. Srivastava., S.K. and Srivastava, S.D., Phytochemistry, 18, 1758 (1978).
  69. Tschesche, R., Shah, A.H., and Eckhardt, G., ibix, 18, 702 (1979).
  70. Woo, W.S., Kang, S.S., Shim, S.H., Wagner, H., Chari, V.M., Seligmann, O. and Obermeier, G., ibid,18, 353 (1979).
  71. Cyong, J.C. and Hanabusa, K., ibid, 19, 2747(1980).
  72. Woo, W.S., Kang, S.S., Shim, S.H., Wagner, H., Chari, V.M., ibid, 19, 2791 (1980).
  73. Ikram, M., Ogikara, Y, and Yamasaki, K., J. Nat. Prod., 44, 91 (1981).
  74. Nobuyuki, O., Toshihiro, N., Akira, Y. and Itsuo, N., Chem. Pharm. Bull., 29,676 (1981).
  75. Tschesche, R., Shah, A.H., Pandey, V.B., Singh, J.P., Von Radloff, M. and Eckhardt, G., Pharmazie, 36, 511 (1981).
  76. Chughtai, M.I.D., Khokhar, I. And Ahmad, A., Pak. J. Sci. Res., 32, 248 (1980).
  77. Hanabusa, K., Cyong, J. and Takahashi, M., Planta Med., 42, 380 (1980).
  78. Cyong, J.C., Adv. Pharmacol. Ther. Proc. Int. Congr., 6, 251 (1981).
  79. Nobuyuki. O., Akira, Y. and Itsuo, N., Chem. Pharm. Bull., 29, 3507 (1981).
  80. Shim, K.H., Kim, H.Y. and Woo, W.S., Planta Med. 44, (2), 94 (1982).
  81. Triguerio, J.A., Barbosa-Filho, J.M. and Cheriyan, U.O., Cienc. Cult., 33, 44 (1981).
  82. Pandey, V., Singh, J.P. and Shah, A.H., Ind. J. Pharm. Sci., 44, 34 (1982).
  83. Sharma, S.C. and Kumar,R., Pharmazie, 38, 65 (1983).
  84. Sharma, S.C. and Kumar,R., Phytochemistry, 22, 1469 (1983).
  85. Shah, A.H., Pandey, V.B., Eckhardt, G. and Tschesche, R., Phytochemistry, 23, 931 (1984).
  86. Pandey, V.B., Singh J.P., Seth. K.K., Shah, A.H. and Eckhardt, G., Phytochemistry, 23, (9), 2118 (1984).
  87. Shah, A.H., Pandey, V.B., Singh J.P., Singh, K.N. and Eckhardt, G., Phytochemistry, 23, (9), 2120 (1984).
  88. Shah, A.H., Pandey, V.B., Eckhardt, G. and Tschesche R., J. Nat. Prod., 48 (4), 555 (1985).
  89. Shah, A.H., Pandey, V.B., Eckhardt, G. and Tschesche R., Phytochemistry, 24, (11), 2765 (1985).
  90. Shah, A.H., Pandey, V.B., Eckhardt, G. and Tschesche R., Phytochemistry, 24, (11), 2768 (1985).
  91. Miana, G.A. and Shah, A.H., Fitoterapia, 56 (6), 363-4 (1984); Chem. Abstr., 105, 75886 (1986).
  92. Pandey, V.B., Dwivedi, S.P.D., Shah, A.H. and Eckhardt, G., Phytochemistry, 25(11), 2690 (1986).
  93. Shah, A.H., Miana, G.A. and Tschesche, R., Nat. Prod. Chem., Proc. Int. Symp. Pak-U.S. Binatl. Workshop, Edited by Rahman, Ata Ur. Springer: Berlin, fed. Rep. Ger. Ist, 404 (1984).
  94. Shas, A.M., Miana, G.A., Devi, S. and Pandey, V.B., Planta Med., 6, 500 (1986).
  95. Pandey, V.B., Devi, S., Singh, J.P. and Shah, A.H., J. Nat. Prod., 49(5), 938(1986).
  96. Shah, A.H., Ageel, A.M., Tariq, M., Mossa, J.S. and A1-Yahya, M.A., Fitoterapia, 57 (6), 452 (1986).
  97. Dwivedi, S.P.D., Pandey, V.B., Shah, A.H. and Eckhardt, G., J. Nat. Prod., 50, 235 (1987).
  98. Shah, A.H., A1-Yaha, M.A., Devi, S. and Pandey, V.B., Phytochemistry, 26(4), 1230 (1987).
  99. Han, B.H., Park, M.H., and Park, H.J., Saenzyak Hakloechi, 16(4), 233 (1986); Chem. Abstr., 107, 102502 (1987).
  100. Devi. S., Pandey, V.B., Singh, J.P. and Shah, A.H.,Phytochemistry, 26(12), 3374 (1987).
  101. Han, B.H., and Park, M.H., Arch. Pharmacol., Res., 10(4), 203 (1987).
  102. Han, B.H., and Park, M.H., Arch. Pharmacol., Res., 10(4), 208(1987).
  103. Pandey, V.B., Tripathi, YC., Devi, S., Singh, J.P. and Shah, A.H., Phytochemistry, 27 (6), 1915 (1988).
  104. Shah, A.H., Khan, R.M.A., Maurya, S.K. and Singh, V.P., Phytochemistry 28,305 (1989). Corrigendum, Phyrochemistry, 28, 1563 (1989).
  105. Kauf, A., Ahmad, H., Sudozai, S.K., Shah, A.H., Khan, A. and Rat A., J. Pure Appl. Sci., 7 (1), 31 (1988).
  106. Shah, A.H., Pandey, V.B. Eckhardt, G. and Mianona, G.A., Hetrocycles, 27, (12), 2777 (1988).
  107. Han, B.H., Park,M.H. and Park, J.H., Pure Appl. Chem. 61(3) 443-8 (1989). Chem. Abstr., 111, 167135 (1989).
  108. Tripathi, Y.C., Maurya, S.K., Singh, V.P. and Pandey, V.B., Phytochemistry, 28 (5), 1563 (1989).
  109. Han, B.H., Park, M.H. and Han, Y.N., Phytochemistry, 29(10), 3315 (1990).
  110. Abdel-Galil, F.M. and E1-Jissry, M.A., Phytochemistry, 30 (4), 1348 (1991).
  111. Han, B.H., Han, Y.N., Park, M.H., Park, J.I. and Park, M.K., Saenghwahak Nyusu, 10(4), 239 (1990).
  112. Khokhar. I. And Ahmed, A., Sci. Int. (Lahore) 5 (1), 37(1993).
  113. Han. B.H., Park, M.H. and Han. Y.N., Yakhak Hoechi, 37 (2), 143 (1993).
  114. Ghedira, K., Chemli, R., Richard, B., Nuzillard, J.M., Zeches, M. and Le Men-Oliver, L/. Phytochemistry, 32, (6), 1591 (1993).
  115. Khokhar. I. And Ahmed, A., Pak., J. Sci., 44,37 (1992).
  116. Barboni, L., Garibodli, P., Torregiani, E. and Verotta, L., Phytochemistry, 35 (6), 1579 (1997).
  117. Ghedira, K., Cheml., R., Caron, C., Nuzillard, J.M., Zeches, M. and Le. Men-Oliver, L., Phytrochemistry, 38(3), 767 (1995).
  118. Singh, B. and Pandey, V.B., Phytochemistry, 38 (1), 271 (1995).
  119. Khokhar, I. and Ahmed, A., Pak. J.Sci., 45,54 (1993).
  120. Khokhar, I. Ahmed, A. and Kashmiri, M.A., J. Nat. Sci. Math., 34 (1), 159 (1994).
  121. Khokhar, I and Ahmed, A., J. Nat. Sci. Math., 34 (1), 171 (1974).
  122. Abu-Zagra, M., Sabri, S., A1-Aboudi, A., Zjaz. M.S., Sultana, N., Atta-Ur-Rahaman, J.Nat. Prod., 28(4), 504 (1995).
  123. Maurya, S.K., Pandey, D.P., Singh J.P. and Pandey, V.B., Pharmazie 50 (5), 372 (1995).
  124. Jossang, A., Zahir, A. and Diakite, D., Phytochemistry, 42 (2), 565 (1996).
  125. Auvin, C., Lezenven, F., Blond, A., Augeven-Bour. I., Pousset, Jean-Louis, Bodo, B. and Camara, J., J. Nat. Prod., 59(7), 676 (1996).
  126. Park, M.H., Suh, Dae-Yao and Han B.H., Phytochemistry, 43 (3), 701 (1996).
  127. Sheu, Kwang-Gyou and Lee, Chi-Ho, Yakche Hakhoechi, 26(4), 257 (1996).
  128. Khokhar. I., Ahmed, A. and Kashmiri M.A., J. Nat. Sci. Math., 36(2), 149(Eng.).
  129. Tripathi, M., Pandey, M.B., Jha, R.N., Pandey, V.B., Tripathi. P.N. and Singh, J.P., Fitoterapia, 72 (5), 507 (2001).
  130. Le, C.G., Thepenier, P., Richard, B., Petermann, C., Ghedira, K. and Zeches-Hanrot, M., 73 (1), 63 (2002).
  131. Park, Chan-Woong, Kim, Yong-Sik, Han, B.H., Park, Jong-Wan, Jang, In-Jin, Choi, Jeong-Yuin, Cheng, Dong-Bok, Lee, Yun-Song and Kim, Myung-Suk, Korean J. Toxicol. 12(2), 181 (1996).
  132. Annual Report of Natural Products Research Institute, Seoul National University, Published by Natural Products Research Institute, Seoul University, Seoul, (Korea). Vol. XXIII, pp. 126-128, 151-152, 156-157, 175 (1984).
  133. Shah, A.H. and Pandey, V.B., J.Chem. Soc. Pak., 7,363 (1985); Chem. Abstr., 105, 170627 (1986).
  134. Tschesche, R., Moch, J. and Spilles, C., Chem. Ber., 108, 2247 (1975).
  135. Davies, J.S., Amino Acids and Peptides, Chapman and Hall, London, New York, 73 (1985).
  136. Tsechesche, R. and Last, H., Tetrahedron Lett. 2993 (1968)
  137. Tschesche, R., Shah, A.H. and Eckhardt, G., Phytochemistry, 18, 702 (1979).
  138. Cyong, J.C. and Takahashi, M., Chem. Pharm. Bull., 30 (3), 1081 (1982).
  139. Woo, W.S., Shin, K.H. and kang S.K., Teahakyo Saengyak Yonguso Opjukip, 19, 115 (1980).
  140. Zhang, J., Nishimura, N., Okubo, A. and Yamazaki, S., Phytochemial Anal. 13(4), 189 (2002).
  141. Sharma, S.C. and Kumar, R., Pharmazie, 37(11), 809 (1982).
  142. Cyong. J.C., Acupunct. Electo-Ther. Res., 6(4), 285 (1981).
  143. Shin, K.H., Yahkhok Hoechi, 26(3), 133, (1982).
  144. Shin. K.H., Woo, W.S. and Lee, C.K., Taehakkyo Saengyak Yonguso Opjukjip, 20, 82 (1981).
  145. Yagi, A., Koda, A., Inagaki, N., Haraguchi, Y. Nodam K., Okamura, N. and Nishioka, I., Yakugaku Zasshi, 101 (8), 700 (1981).
  146. Shimizu, N. and Tomoda, M., Chem. Pharm. Bull., 31(2), 499 (1983).
  147. Khosa, R.L., Pandey, V.B. and Singh, J.P. Indian Drugs, 20(6), 241 (1983).
  148. Ishii, Y.., Nippon Eiyo Shokuryo Gakkaishi, 36(1), 53 (1983).
  149. Nawwar, M.A.K., Ishok, M.S., Michael, H.N. and Buddrus, J., Phytochemistry, 23(9), 2110 (1984).
  150. Ichimaru, F. K.K., Jpn Kokai Tokkyo Koho J P 5993, 011 [8498, 001](C1. A61 K7/00), 29 May 1984, Appl. 82-199, 970, 16 Nov. 1982; 5pp.
  151. Ikramova, M.M., Trofimova, E.P. and Shub, S.S., Deposited Doc., VINITI, 128-84, 554pp. (1984). Avail VINITI.
  152. Barbosa Filho, J.M., Trigueiro, J.A., Cheriyan, U.O. and Bhattacharya, J., J. Nat. Prod., 48(1), 152 (1985).
  153. Higuchi, R., Kubota, S., Komori, T., Kawasaki, T., Pandey, V.B., Singh, J.P. and Shah, A.H., Phytochemistry, 23(11), 2597 (1984).
  154. Srivastava, S.K., J.Nat. Prod., 47, (5) 781 (1984).
  155. Car, M.E., Phillips, B.S., and Bagby, M.O., Am. Oil Chem. Soc., 62(9), 1367 (1985).
  156. Ghosh, A.K., Nagar, P.K. and Sircar, P.K. J.Plant Physiol. 120 (5), 381 (1985).
  157. Pandey, V.B., Singh, J.P., Khosa, R.L. and Shah, A.H., J. Chem. Soc. Pak., 7(1), 33 (1985).
  158. Tomoda, M., Shimizu, N. and Gonda, R., Chem. Pharm. Bull., 33(9), 4017 (1985).
  159. Ali, A.A., E1-Shanawany, M.A. and Meshboh, M.K., Bull. Pharm. Sci., Assiut Univ., 8(1), 1 (1985).
  160. Yamada, H., Nagai, T., Cyong, J.C., Otsuka, Y., Tomoda, M., Shimizu, N. and Shimada, K.,
  161. Carbohydr. Res., 144 (1), 101 (1985).
  162. Kohda, H., Kozai, K., Nagasaka, N., Miyake, Y., Suginaka, H., Hidaka, K. and Yamassaki, K., Planta Med., 2, 119 (1986).
  163. Zeng, L., Zhang, R. and Wang, X., Zhiwu Xuebao, 28(5), 517 (1986).
  164. Fukuyama, Y., Mizuta, K., Nakagawa, K., Qin, W and Wa, X., Planta Med.,6, 501 (1986)
  165. Li, S. and Zhang,R. Zhongyao Tongbao, 11 (11), 683 (1986).
  166. Li, S. and Zhang,R. Zhongyao18 (6), 255 (1987).
  167. Khosa, R.L., Meena, P. and Pandey, V.B., Indian Drugs, 24 (6), 323 (1987).
  168. Devi, S., Pandey, V.B. and Shah, A.H., Fitoterapia, 58(1), 58 (1987).
  169. Han, B.H., Park, M.H. and Wah, S.T., Tetrahedron Lett., 28 (34), 3957 (1978).
  170. Nour, A., Azim, A.M., Ali, A.O., Ahmed A. And Halim, R., Trop. Sci., 27(4), 271 (1987).
  171. Al-Khatib, Izaldin, M.H., Moursi, S.A., Hanifa, Mehdi, A.W.R. and A1-Shabibi, M.M., J.Food Compos. Anal., 59 (1987).
  172. Yuan, C., Wang, Z., Jiao, Y., Cao, A., Huo, Y,. and Cui, Zhongyao Tongbao, 12(9) 546 (1987).
  173. Wang, H., Zhang. H., and Sun. Y., Jilin Daxue Kexue Xuebao, 2,, 89 (1988).
  174. Souleles, C. and Shammas, G., Fitoterapia, 29 (2), 154 (1988).
  175. Fukuyamam, Y., Japan Kokai Tokkyo Koho JP 62, 209, 070 [ 87, 209, 070]. (C1. C07D307/80)] 14 Sep. 1987, Appl. 86/40, 622, 26 Feb. (1986). 13pp.
  176. Tripathi, Y.C., Devi, S., Pandey, V.B. and Shah,l A.H., Fitoterapia, 60 (5), 158 (1988).,
  177. Semochkina, L.G., Subtop. Kul’t, 6, 12 (1988). 177. Maurya, S.K., Devi, S., Pandey, V.B. and Khosa, R.L., Fiterapia, 60(5), 468 (1989).
  178. Lee, H.B. and Kim, S.Y., Nongop Kisul Yongu Pogo (Chungnam Taehakkyo), 15(1), 95 (1988).
  179. Kundu, A.B., Barik, B.R., Mondal, D.N., Dey., A.K. and Banerji, A., Phytochemistry, 28(11), 3155 (1989).
  180. Nose, M., Miyagoshi, M., Amagaya, S. and Ogihara, Y., Shoyakugaku Zasshi, 43(4), 348 (1989).
  181. Yamamoto, K., Shibohara, A., Sakuma, A., Nakayama, T. and Kajimoto, G., Lipids, 25(10), 602 (1990).
  182. Acharya, S.B., Tripathi, S.K., Tripathi, Y.C. and Pandey, VB., Indian J. Pharmacol., 20(2-4), 200 (1988).
  183. Han, B.H., Park,M.H. and Han, Y.N., Arch. Pharmacol. Res., 12(4), 263 (1989).
  184. Yamatota, K., Shibahara, A., Nakayama, T. and Kajimoto, G., Yakagaku, 40(2), 121 (1991).
  185. Tanaka, Y. and Sanada S., Shoyakugaku Zasshi, 45(2), 148 (1991).
  186. Li, L., Zhao, S., Wu, S., Gao, Z. and Li, X., Zhongguo Zhongyao Zazhi,17(2), 81 (1992).
  187. Wang, H., Sun., S. and Cui, H., Tianran Chanwn Yanjiu Yu Kaifa, 4(2), 63 (1989).
  188. Yoshikawa, K., Shimono, N. and Arihara, S., Tetrahedron Lett., 32(48), 7059 (1991).
  189. Yoshikawa, K., Shimono, N. and Arihara, S., Chem. Pharm. Bull., 40(9), 275 (1992).
  190. Bail,G., Ren., Y., Zhang, B. and Zhang, H., Chem. Res. Chin. Univ., 8(2), 177 (1992).
  191. Ando, Y. and Takagi, T., J. Am. Oil Chem. Soc., 70(10), 1047 (1993).
  192. Zygadlo, J.A. and Guzman, C.A., An. Asoc. Quim Argent, 80 (5), 381 (1992).
  193. Pelotto, J.P., Del, P.M., Maria, A., Biochem, Syst. Ecol., 21(5), 645 (1993).
  194. Zhan, X., Zhongocaoyao, 24 (10), 525 (1993).
  195. Pandey, V.B. and Tripathi, Y.C., Fitoterapia, 64 (4), 341 (1993).
  196. Glombitz, K.W., Mahran, G.H., Mirhom, Y.W., Michel, K.G. and Motawi, T.K., Planta Med., 60(3), 244 (1994).
  197. Wang, L., Liu, Y., Yuan, S. and Tang J., Wuxi Quiggongye Xuegyuan Xuebao, 14(1), 49 (1955).
  198. Moharir, A.M., Khotpal,R.R. and Kulkarni, A.S., Acta Cience. Indian Chem. 19 (2), 45 (1993).
  199. Lee, C., Wang, Jeng-Shu, Chen, K. Chung-Sheue J. Chin. Chem. Soc. (Taipei)42(1), 77 (1995).
  200. Eromosele, I.C., Eromosele, C.O., Akintoye, A.O. and Komolafe, T.O., Plant Foods Hum, Nutro (Dordrecht, Neth.)46 (4), 361 1994).
  201. Gao, B. and Wei, S., Hebeisheng Kexueyuan Xuebao, 4, 61 (1992).
  202. Weingses, K. and Schick, H., Phytochemistry, 38(2), 505 (1995).
  203. Choi, C., Chun, Sung-Sook, Cho, Young-Je, Ahn, Bong-Jeion, Kim, Young-Hwal and Lee, Seon-Ho, Han’guk Nonghwa Hakhoechi 37(5), 356 (1994).
  204. Choi, C., Chun, Sung-Sook, Cho, Young-Je, Woo, Heui-Soeb,Kim, Tae-Wanj and Heo, Young-Hoon, Han’guk Nonghwa Hakhoechi 37(4), 243 (1994).
  205. Zhou, B. andXin, Y., Zhongguo Youzhi, 19(6), 38 (1994).
  206. Munoz, S.E., Silva, R.A., Lamarque, A., Guzman,C.A. and Eynard, A.R., Prostaglandins, Leukotrienes Essent. Fatty Acides, 53(2), 135 (1995).
  207. Lee, Shoei-Sheng, Lin, Buh-Fang and Chen, Karin Chiung-Sheue, Chin Pharm. J. (Taipei),47 (6), 511 (1995).
  208. Younes, M.E., Amer, M.S. and E1-Messallami, A.D.E., Bull. Natl. Res. Cent. (Egypt),21(1), 35 (1996).
  209. Wang, K.C., Chee, S.G. and Tan, C.H., J.Essent. Oil Res. 8(3), 323 (1996).
  210. Lee, Shoei-Sheng, Lin, Buh-Fang and Lku, K.C., Phytochemistry, 43(4), 847 (1996).
  211. Wang, J. and Lin, Xiao, Zhongcaoyao, 27(3), 154 (1996).
  212. Mahran, G., E1-Din, Glombitza, K.W., Mirhom., Y.W., Hartmann, R. and Michel, C.G., Planta Med., 62(2), 163 (1996).
  213. Medic-Saric, M., Malesm Z., Stanic, G., Saric, S., Croat. Chem. Acta. 69(3), 1265 (1996).
  214. Bae, K.H., Lee, S.M., Lee, E.S., Lee, J.S. and Kang, J.C., Yakhak Hoechi, 40(5), 558 (1996).
  215. Kurihara, Y., Ookubo, K., Tasaki, H., Kodama, H.,Akiyama, Y., Yagi, A. and Halpern, B., Tetrahedron, 44(1), 61 (1998).
  216. Renault, J., Ghedira, K., Thepenier, P., Lavaud, C.Zeches-Hanrot, M., and Men-Oliver, L.L., Phytochemistry, 44(7), 1321 (1997).
  217. Myiakekatio, E.T. and Alvarenga, M.A., Rev, Farm. Bioquim. Univ. Sao Paulo, 33(1), 47 (1997).
  218. Yoshikawa, M., Murakami, T., Ikebata, A., Wakao, S., Murakami, N., Matsuda, Hisashi, Y.J., Chem. Pharm. Bull., 45(7), 1186 (1997).
  219. Yoshikawa, K., Izumi, M. and Arihara, S., Nat. Med. (Tokkyo), 51(3), 282 (1997).
  220. Malik, A., kuliev, Z.A., Akhomedov, Y.A., Vdovin, A.D. and Abdullaev, N.D., Chem. Nat. Compd. (Transl. Of Kim. Prir. Soedin). 33(2), 165 (1997).
  221. Yin, S., Jin, B., and Hong, S., Zhongguo Zhongyao Zazhi, 22(5), 296 (1997).
  222. Ono, S., Jpn. Kokai Tokkyo Koho JP 09, 328, 496 [97, 328, 496]. (C1. CO7H15/256), 22 Dec. 1997, Appl. 96/145, 726, 7 Jun 1996; 3pp.
  223. Gupta, N., and Srivastava P.S., Plant Cell Rep., 17(6-7), 552 (1998).
  224. Nahar, N., Das, R.N., Shoeb, M., Marma, M.S., Aziz, M.A. and Mosihuzzamam, M., J. Bangladesh Acad. Sci., 21 (2), 151 (1997).
  225. A1-Jassabi, S., Dirasat : Nat. Eng. Sci., 24(2), 236 (1997).
  226. Kawashima, K., Saito, K., Yamada, A., Obara, S., Ozaki, T. and Kano, Y., Biol. Pharm. Bull., 20(11), 1171 (1997).
  227. Yoshino, M., Ito, M., Okajima, H., Haneda, M. and Murakami, K., Biomed. Res., 18(5), 649 (1997).
  228. Soares, F.P., Ronconi, C.A.V., Da, Cunhan, E.V.L., Barbosa-Filho, J.M., Da Silva, M.S. and Braz0Filho, R., Magb. Reson. Chem., 36 (8), 608 (1998).
  229. Monal, D.N., and Kundu, A.B., J. Indian Chem. Soc., 75(6), 384 (1998).
  230. Jagadeesh, S.G., Krupadanam, G.L., David, Srimannarayana, G., Murthy, S. Samba; Kaur, A. and Raja, S.S., J. Agric. Food. Chem., 46(7), 2797 (1998).
  231. Lin, Q., Gao, D., Yu, S. and Fu, X., Shipin Gongyne Keji, 4,20 (1998).
  232. Okumura, N., Miki, H., Harada, T., Yamashita, S., Masaoka, Y., Nakamoto, Y., Tsuguma, M., Yoshitomi, H. and Yagi, A., J. Pharm. Biomed. Anal., 20(1-2), 363 (1999).
  233. Schuhly, W., Heilmann, J., Calis, I. Sticher, O., Planta Pandey, VB., Indian J. Pharmacol., 20(2-4), 200 (1988).
  234. Quin, J., Park, J., Kim. and Cha, M., Han’Guk Sikp’um Yongyang Kwahak Hoechi, 28 (3), 505 (1999).
  235. Li, H. and Li. P., Yaowu Fenxi Zazhi, 20(2), 82 (2000).
  236. Jiang, H. and Fan, Y., Huaxi Yaoxue Zazhi, 14(5-6), 401 (1999).
  237. Schuhly, W., Heilman, J., Calis, I. and Sticher, O., Helv. Chim. Achta, 83(7), 1509 (2000).
  238. Gusakova, S.D., Sagdullaev, Sh. Sh., Aripov, K.N., Basher, K.H.C., Kurkcuoglu, M. and Demirci, B.,Chem. Nat. Compd., 35(4), 401 (1999). (Pub. 2000).
  239. Che, Z., Shipin Gongye Keji, 21(2), 27 (2000).
  240. Chng, G., Bai, Y.,Zhao, Y.,Tao, J., Liu, Y., Tu., G., Ma, L., Liao, N. and Xu, X., Tetrahedron, 56(45), 8915 (2000).
  241. Agrawal, S.K., Singh. S.S., Verma, S. and Kumar, S., Indian J. Chem., Sect. B: Org. Chem. Incl. Med. Chem., 39B(11), 872 (2000).
  242. Jagadeesh, S.G., Krupadanam, G.L. David and Srimannarayana, G., Indian J. Chem., Sect. B: Org. Chem. Incl. Med. Chem., 39B (5), 396 (2000).
  243. Zhu, X., Shi, L., Liu, B., Gao, Y., Zhang, L., Chen, J. and Gong, M., Fenxi Yiqi, 4, 41 (2000).
  244. Liu, Yun-Hui, Sepu, 18(6), 556 (2000).
  245. Peng, Jian-Ying, Shu, Hui-rui and Peng, S., Hebei Nongye Daxue Xuebao, 23(4), 46 (2000).
  246. Ramadoss, S., Siddiqui, M. and Jamsheed, A., PCT Inst. App. WO 01 64, 709, (CI. C07 J63/00), 7 Sep., 2001, Appl. 2000/IN 19, 29 Feb. 2000; 22 pp.
  247. Agarwal, S.K., Verma, S., Singh, S.S., and Kumar, S., J. Med. Aromat Plant Sci., 224A-23/1A, (2001).
  248. Li, Y., Che, Z., Bi, K., Xu, Z. and Ki, M., Zhongguo Zhongyao Zazhi 26(5), 309 (2001).
  249. Kadam, V.B., Geobios (Jodhpu, India), 27(2-3), 119 (2000).
  250. Shou, C., Feng, Z., Wang, J. and Zheny, X., Planta Med, 68(9), 799 (2002).
  251. Su, Bao-Ning, Cruendet, M., Farnsworth N.R., Fong, H.H.S., Pezzuto, J.M., and Kinghorn, A.D., Planta Med., 68(12), 1125 (2002).
  252. Bhadauria, K.K.S., Pailanbhadauri, G.H., Das, M.M. Kundu, S.S., Singh J.P. and Lodhibhandauri, G.N., Ind. J. of Animal Sciences, 72(1), 87 (2002).
  253. Agarwal, S.K., Verma, S.,Singh S.S., Sammal, S.S. and Kumar, S. Indian J. Chem. Sect. B: Organic Chem. Incl. Med. Chem., 41B (4), 878 (2002).
  254. A1-Mamary, M., A1-Meeri, A. and A1-Habori, M., Nutrition Research (New York, NY, US), 22(9), 1041 (2002).
  255. Abbas, M.F. and Fandi, B.S., J. Sci. Food and Agric., 82(13), 1472 (2002).
  256. Malik, A., Kauliev, Z.A., Akhmedov, U.A., Vdovin, A.D. and Abdullaev, N.D., Chemistry of Natural Compounds (Translation of Khimiya Priprodnykh Soedinenii), 38,(1), 40 (2002).
  257. Pradeep, T. and Jambhale, N.D., Indian Phytopathology, 55(2), 195(2002).
  258. Feng, Zhou-Yan, and Zeng, Xiao-Xiang, J. of Zhejiang Univ., Science 3 (5), 591 (2002).
  259. Kachave, C.B., Patil, H.B. and Kadam, S.S., J.Food Sci. and Technology 39(5), 542 (2002).
  260. Yu-Juan, L., Kai-Shun, B., Xin-Miao, L. and Hong-Bin, X., J. of Chromatographic Science, 41(1), 41 (2003).
  261. Maciuk, A., Ghedira, K., Thepenier, P., Lavaud, C. and Zeches-Hanrot, M., Pharmazie, 58(2), 158 (2003).
  262. Adzu, B., Amos, S., Amizan, M.B. and Gamoniel, K., Acta topica. 87(2), 245 (2003).
  263. Heo, Ho-jin, Park, Young-June, Suh, Young-Min, Choi, Soo-Jung, Kim, Mi-Jeong, Cho, Hong-Yon, Chang, Yun-Jeong, Hong, B., Kim, Hye-Kyung, Kim, E., Kim Chang-Ju, Kim, Byung-Gee and Shin, Dong-Hoon, Bioscience. Biotechnology and Biochemistry, 67(6), 1284 (2003).
  264. Li, Yu-juan, Liang, Xin-Miao, Hong-bin and Bi, Kai-Shun., Yao Xue Xue Bao, (Acta Pharmaceutica Sinica) 38(6), 448 (2003).
  265. Orhan, I. and Sener, B., J. Herb. Pharmacother., 2(3), 29(2003).
  266. Chen, G., Huo, Y., Tan, Dun-Xian, Liang, Z., Zhang, W. and Zhang, Y., Life Sciences, 73(1), 19 (2003).
  267. Sharma, R., Mahla, H., Mahapatra, T., Bhargava, S.C. and Sharma, M.M., Plant Molecular Biology Reporter, 21(1), 43 (2003).
  268. Commetto, P.M., Faye, P.F., Di, P.N., Romina, D., Rubia, M.A. and Aldao, Mario, A.J., J. of Agriculture and Food Chemistry, 51(17), 5079 (2003).
  269. A1-Easa, H.S., Int. J. of Chemistry, 13(2), 99 (2003).

Algal Sulfated Polysaccharides: Potent Immunomodulators against COVID-19 in Pandemic 2020

$
0
0

Introduction

The global scenario has changed, as the novel coronavirus has become a pandemic for human civilization. The World Health Organization (WHO) has reported 216 countries, areas or territories around the world, which are infected by SARS-CoV-2. By the time this report was made (June 2020), the virus had already infected 88,60,331 people, caused more than 4,50,000 deaths and the figures are continually increasing.1 As of now, no vaccines are available that can lead the fight against this virus by boosting the immune system. Research is going on in various countries for development of vaccine against the virus. Sulfated polysaccharides (SPs), extracted from algae may serve as a potential agent against such novel viruses to solve the global problem at present and in future.

Emerging and re-emerging viral infections continue to pose a key threat to global public health. From the very beginning, the “Spanish flu” or “1918 flu pandemic” was recognized deadly influenza pandemic caused by human influenza A (HIN1) virus. At that time more than 500 million people were affected and 50 million people were estimated to be dead, largest in human history caused by a virus. In 1957 to 1958, the flu pandemic returned as HIN1 subtype (H2N2) and also known as “Asian flu”, which originated in Guizhou, China and sacrificed more than 1 million people worldwide. Following this, in 1968 the H2N2 virus genetically modified into H3N2 subtype of HIN1 through antigenic shift and was designated as “Hong Kong flu” which killed about 3 million people around the world. The H3N2 virus returned in 1969-1970 resulting in another deadly wave of deaths and circulated as seasonal flu. In 1997, a deadly pathogenic avian influenza A (H5N1) virus launched and spread its wings over humans through the poultry birds and later it modified into various subtypes including H7N9, H9N2 and H7N3. Similarly in 1999 and 2018, a novel paramyxovirus, termed as “Nipah virus (NiV)” was identified as the cause of severe encephalitis outbreak in Malaysia, Singapore and India that took 400-500 lives. In the pandemic flow during 2002-2003, major outbreak happened among the Chinese people, which causing severe acute respiratory syndrome (SARS) by a novel corona virus (CoV). Designated as SARS-CoV, it spread over 37 countries. The SARS-CoV virus infected more than 8000 people and took 774 lives with 9.6% mortality rate.2 The Middle East respiratory syndrome (MERS) in 2012, again caused by a deadly corona virus, MERS-CoV had a mortality rate of more than 30%. The outbreak continues and several emerging and re-emerging viral pathogens including “Severe fever with thrombocytopenia syndrome (SFTS) bunyavirus” (2010), “Ebola virus” (2014-2016), “Zika virus” (2015) constantly pose a threat to human health.2

The most recent outbreak of novel COVID-19 originated in the city of Wuhan, China in December 2019. The virus causes severe pneumonia with acute respiratory infections (ARIs), which gets transmitted by air and person-to-person contact, making it very contagious. Reports state that the ARIs causes high mortality rate due to childhood morbidity.3 Several viruses associated to respiratory infections including respiratory syncytial virus (RSV), influenza virus, parainfluenza virus (PIV), adenovirus (AdV), rhinovirus (RV), human metapneumovirus (HMPV), human bocavirus (HBoV), human papilloma viruses (KIPyV, WUPyV) and emerging human coronaviruses (HCoV) are reported.3 More than 6 million people have been infected with novel COVID-19, which is newly identified as 2019-nCoV, classified under Coronaviridae family and recognized as modified clone of SARS-CoV (SARS-CoV-2).4

In ancient times, traditional medicines were used to cure respiratory diseases including cold, cough, chronic coughs and bronchitis. It has been found that an unknown mixture of carrageenan obtained from two red algal species, Chondrus crispus and Mastocarpus stellatus to cure cough of Irish people in 1830s and fought against viral infections.5 By tradition Japanese people regularly consume seaweeds and iodine in their diet to enhance the immune system. A report has suggested that Hokkaido populations of Japan reduced the infection of COVID-19 at the initial stage by consuming seaweed regularly but to make it 100% curable, people should follow the additional measures like social distancing and isolation.3 It has been observed that carrageenan nasal spray is an effective treatment that reduces the duration of the viral infection and increased viral clearance during common cold in children and adults.6 Another study showed that nasal spray containing iota-carrageenan or the combination of “zanamivir” and iota-carrageenan is effective against HIN1 virus by the treatment of upper respiratory tract infections.7 Interestingly, carrageenan not only fights against respiratory diseases, it reduces the risk of other infections and boost up immunity in children and adults as well.

Some microalgae, cyanobacteria, diatoms and a major group of seaweed contain large amount of uniquely structured long chain sugars polymerized as polysaccharides with many health benefits. Polysaccharides obtained from algae have beneficial acitivities or healing capacities. In the last few decades, algal polysaccharides especially SPs have been studied effectively due to its antiviral8,9,10 anti-inflammatory11, antitumor12, anticoagulant11, antithrombotic11, antinociceptive13 and antioxidant14 properties.

In the last few decades, with emergence of technology and fast placed lifestyle human immune system is considerably affected. Though development of antiviral drug is a complex process, currently the pharmacological companies and research laboratories have approved the clinical use of around 50 drugs for human use against various viruses including herpes simplex virus (HSV), human immunodeficiency virus (HIV), human cytomegalovirus (HCMV), influenza virus, hepatitis B virus (HBV) and hepatitis C viruses (HCV).15 First report on antiviral activity of algal SPs was found in 1958 against influenza B or mumps virus16 and over the years many researchers have worked on it. Most useful SPs obtained from algae are grouped into carrageenan, fucoidans, galactans, laminarans, alginate derivatives, naviculan, calcium spirulans, p-KG03, nostoflans and sea algae extracts (SAE).

Fucans are group of complex SPs, which occur in mucilaginous matrix of brown algae and grouped into fucoidans, glycuronogalactofucans and xylofucoglycuronans.  From the very beginning, fucoidans had potential applications in antiviral activity of many enveloped viruses such as influenza A virus17, HSV-118, HIV19, Newcastle disease virus (NDV)20, and canine distemper virus (CDV)21. It has been reported that in vitro and in vivo activity of fucoidans showed various biological activities against DNA and RNA viruses including dengue virus (DENV), HIV, human cytomegalovirus (HCMV), measles virus, HSV-1 and HSV-2.10 Fucoidans showed their antiviral activities by inhibiting viral-induced syncytium formation.

Galactans are major extracellular polysaccharides, widely distributed in red algal groups including Gracilaria, Gelidium, Callophyllis, Agardhiella, Cryptonemia, Schizymenia etc. and have shown their antiviral activity against numerous viruses like DENV, HSV-1, HSV-2, HIV-1, HIV-2 and hepatitis A virus (HAV).10

Carrageenans are group of anionic SPs obtained from the matrix of red algae such as Gracilaria, Chondrus, Hypnea, Eucheuma and Gigartina and classified into lambda, kappa and iota carrageenans. Several reports have suggested that carrageenan are potential inhibitor of human papilloma viruses (HPVs) and prevents initial infection by inhibiting the binding of virus into the host cells.22 Despite this, lambda-type carrageenan is found to be active against HSV-virion.23 Replication of human rhinovirus (HRV) can be prevented by iota-carrageenan with suppression of the allosteric activity of virus particles during infection.24

Laminaran, is another group of SPs predominantly found in brown seaweed such as Fucus, Ascophyllum, Saccharina and classified into two groups, viz., G-series with glucose units and M-series with D-mannitol units in chain. Laminaran inhibits the reverse transcriptase activity of HIV, which prevents viral replication and proliferation.10

Alginates, another group of acidic SPs widely occurred in brown algae like Laminaria, Sargassum, Ascophyllum and Macrocystis showed their potential against HBV by suppressing the activity of DNA polymerase. Alginates are also found to be active against HIV infection mainly through the vigorous attachment of gp120 protein with CD4 molecules on the surface of T cells.10

Naviculan, is another group of heteropolysaccharides obtained from a diatom called Navicula directa, mainly composed of various group of sugars including fucose, mannose, galactose, rhamnose, xylose in addition to sulfate with high molecular weight. Naviculan mainly inhibits the initial stages of viral replication in HSV-1, HSV-2 and influenza virus by blocking viral internalization in the host cells.25

The A1 and A2 SPs, found in a marine microalga, Cochlodinium polykrikoides are well known for inhibition of the cytotopathogenic effects of influenza virus type A and B in MDCK cells, HIV-1 in MT-4 cells and respiratory syncytial virus (RSV) A and B in Hep-2 cells.10

Another group of SPs, p-KG03 obtained from Gyrodinium impudicum, was investigated as potent inhibitor for in vitro tumor cell growth and encephalomyocarditis (EMCV) virus infection.10

Calcium spirulan (Ca-SP), isolated from Arthrospira platensis is a novel heteropolysaccharide composed of nine sugars including glucuronic acid, galacturonic acid, glucose, galactose, ribose, mannose, xylose, fructose and rhamnose in association with calcium and sulphate. The antiviral activity of Ca-SP are subjected to inhibition of various viruses including HSV-1, HCMV, influenza A, Coxsackie virus, HIV-1, measles, mumps and polio virus through anticoagulant activity and preventing the entry of virus into the host cell.10

Nostoflan (NSF), another novel SPs obtained from Nostoc flagelliforme is identified as effective against various enveloped viruses like HCMV, influenza A virus, HSV-1 and HSV-2. Sea algae extract or SAE isolated from a red alga, Schizymenia pacifica is a potent inhibitor of reverse transcriptase activity of HIV.10

In relation to the above studies, some SPs extracted from algae including ulvans and fucoidans could be potential antiviral agents against SARS-CoV-2. Hence, more research is needed on algal SPs including carrageenans, galactans, laminaran, naviculan, alginates, Ca-SPs, p-KG03, nostoflan, SAE, A1 and A2 SPs for antiviral therapeutic activities against SARS-CoV-2 and COVID-19. All the scientific and pharmaceutical communities should be concerned about these algal SPs as substitute to antiviral drugs to overcome the pandemic situation of COVID-19 in these desperate times.

Acknowledgement

Mrs. Mousumi Panda is thankfully acknowledged for English editing of this article.

Conflict of Interest

The author declares that there is no conflict of interest.

Funding Source

There is no funding source

References

  1. WHO. Corona disease (COVID-19) pandemic 2020; https://www.who.int/emergencies/diseases/novel-coronavirus-2019 (Accessed on 22.06.2020).
  2. Luo G., Gao S. J. Global health concerns stirred by emerging viral infections. J. Med. Virol. 2020;92:399-400.
  3. Pereira L., Critchley A. T. The COVID-19 novel coronavirus pandemic 2020: seaweeds to the rescue? Why does substantial, supporting research about the antiviral properties of seaweed polysaccharides seem to go unrecognized by the pharmaceutical community in these desperate times? J. Appl. Phycol. 2020; https://doi.org/10.1007/s10811-020-02143-y.
  4. Gorbalenya A. E., Baker S. C., Baric R. S., de Groo R. J., Drosten C., Gulyaeva A. A., Haagmans B. L. et al. The species severe acute respiratory syndrome-related coronavirus: classifying 2019-nCoV and naming it SARS-CoV-2. Nat. Microbiol. 2020;5:536-544.
  5. Pereira L. Biological and therapeutic properties of the seaweed polysaccharides. Int. Biol. Rev. 2018a;2:1-50.
  6. Koenighofer M., Lion T., Bodenteich A., Prieschl-Grassauer E., Grassauer A., Unger H., Mueller C. A., Fazekas T. Carrageenan nasal spray in virus confirmed common cold: individual patient data analysis of two randomized controlled trials. Multidiscip. Respir. Med. 2014;9:57.
  7. Leibbrandt A., Meier C., Konig-Schuster M., Weinmullner R., Kalthoff D., Pflugfelder B. et al. Iota–carrageenan is a potent inhibitor of Influenza A virus infection. PLoS One 2010;5:e14320.
  8. Pujol C. A., Ray S., Ray B., Damonte E. B. Antiviral activity against dengue virus of diverse classes of algal sulfated polysaccharides. Int. J. Biol. Macromol. 2012;51(4):412-416.
  9. Gomaa H. H. A., Elshoubaky G. A. Antiviral activity of sulfated polysaccharides carrageenan from some marine seaweeds. Int. J. Curr. Pharm. Rev. Res. 2016;7(1):34-42.
  10. Moran-Santibanez K., Cruz-Suarez L. E., Ricque-Marie D., Robledo D., Freile-Pelegrin Y., Pena-Hernandez M. A., Rodriguez-Padilla C., Trejo-Avila L. M. Synergistic Effects of Sulfated Polysaccharides from Mexican Seaweeds against Measles Virus. BioMed Res. Int. 2016;1-11.
  11. Guerra Dore C. M. P., Faustino Alves M. G. D. C., Pofirio Will L. S. E., Costa T. G., Sabry D. A., de Souza Rego L. A. R., Accardo C. M. et al. A sulfated polysaccharide, fucans, isolated from brown algae Sargassum vulgare with anticoagulant, antithrombotic, antioxidant and anti-inflammatory effects. Carbohydr. Polym. 2013;91(1):467-475.
  12. Shao P., Chen X., Sun P. Chemical characterization, antioxidant and antitumor activity of sulfated polysaccharide from Sargassum horneri. Carbohydr. Polym. 2014;105(1):260-269.
  13. Coura C. O., de Araujo I. W. F., Vanderlei E. S. O., Rodrigues J. A. G., Quindere A. L. G., Fontes B. P., de Queiroz I. N. L. et al. Antinociceptive and anti-inflammatory activities of sulfated polysaccharides from the red seaweed Gracilaria cornea. Basic Clin. Pharmacol. Toxicol. 2012;110(4):335-341.
  14. Souza B. W. S., Cerqueira M. A., Bourbon A. I., Pinheiro A. C., Martins J. T., Teixeira J. A., Coimbra M. A., Vicente A. A. Chemical characterization and antioxidant activity of sulfated polysaccharide from the red seaweed Gracilaria birdiae. Food Hydrocoll. 2012;27:287-292.
  15. Bryan-Marrugo O. L., Ramos-Jimenez J., Barrera-Saldana H., Rojas-Martinez A., Vidaltamayo R., Rivas-Estilla A. M. History and progress of antiviral drugs: From acyclovir to direct-acting antiviral agents (DAAs) for Hepatitis C. Med. Univ. 2015;17(68):165-174.
  16. Gerber P., Dutcher J. D., Adams E. V., Sherman J. H. Protective effect of seaweed extracts for chicken embryos infected with influenza B or mumps virus. Exp. Biol. Med. 1958;99(3):590-593.
  17. Kim M., Yim J. H., Kim S. Y., Kim H. S., Lee W. G., Kim S. J., Kang P. S., Lee C. K. In vitro inhibition of influenza A virus infection by marine microlaga- derived sulfated polysaccharide p-KG03. Antivir. Res. 2012;93:253-259.
  18. Mohamed S. F., Agili F. A. Antiviral sulfated polysaccharide from brown algae Padina pavonia characterization and structure elucidation. Int. J. ChemTech Res. 2013;5(4):1469-1476.
  19. Thuy T. T. T., Ly B. M., Van T. T. T., Quang N. V., Tu H. C., Zheng Y., Seguin-Devaux C., Mi B., Ai U. Anti-HIV activity of fucoidans from three brown seaweed species. Carbohydr. Polym. 2015;115:122-128.
  20. Elizondo-Gonzalez R., Cruz-Suarez L. E., Ricque-Marie D., Mendoza-Gamboa E., Rodriguez-Padilla C., Trejo-Avila L. M. In vitro characterization of the antiviral activity of fucoidan from Cladosiphon okamuranus against Newcastle Disease Virus. Virol. J. 2012;9(1):307.
  21. Trejo-Avila L. M., Morales-Martinez M. E., Ricque-Marie D., Cruz-Suarez L. E., Zapata-Benavides P., Moran-Santibanez K., Rodriguez-Padilla C. In vitro anti-canine distemper virus activity of fucoidan extracted from the brown alga Cladosiphon okamuranus. Virus Dis. 2014;25(4):474-480.
  22. Buck C. B., Thompson C. D., Roberts J. N., Muller M., Lowy D. R., Schiller J. T. Carrageenan is a potent inhibitor of papillomavirus infection. PLoS Pathog. 2006;2(7):e69.
  23. Carlucci M. J., Scolaro L. A., Damonte E. B. Herpes simplex virus type1 variants arising after selection with an antiviral carrageenan: lack of correlation between drug susceptibility and syn phenotype. J. Med. Virol. 2002;68(1):92-98.
  24. Grassauer A., Weinmuellner R., Meier C., Pretsch A., Prieschl-Grassauer E., Unger H. Iota-carrageenan is potent inhibitor of rhinovirus infection. Virol. J. 2008;5:107.
  25. Lee J. B., Hayashi K., Hirata M., Kuroda E., Suzuki E., Kubo Y., Hayashi T. Antiviral sulfated polysaccharide from Navicula directa, a diatom collected from deep-sea water in Toyama Bay. Biol. Pharm. Bull. 2006;29(10):2135-2139.

Escherichia coli in Saudi Arabia: An Overview of Antibiotic-Resistant Strains

$
0
0

Introduction

Escherichia coli (E. coli) is a coliform rod-shaped, Gram-negative, facultative, non-spore forming bacterium of the genus Escherichia and family Enterobacteriaceae, which includes over 53 genera and 210 species (Jenkins et al., 2017; Tenaillon et al., 2010). According to a study on drug resistances it is predicted that ten million people may die from antibiotic-resistant diseases each year by 2050 if no precautions are taken to tackle the issue, among that more than three million will lose their lives to one bacterial infection by antibiotic resistant E. coli ( O’Neill J., 2016). The E. coli strains are considered as one of the few microbes that have the skill to be adapted to numerous biofunctions. These bacteria can colonize the healthy intestinal tract of several mammals including humans. They are used as an important bio-tool in several biotechnological applications. Furthermore, they have virulence factors which cause numerous diseases in humans and animals, and affect a wide range of bio-cellular processes (Kaper et al., 2004). Although E. coli strains inhabit the gastrointestinal tract of healthy humans, it is considered as one of the most pathogenic microorganisms isolated from humans. E. coli is a very versatile bacterium that can modify easily from one bio-activity to another. Highly variable mutation rates have been reported in commensal and pathogenic E. coli strains (Matic et al., 1997).

Some strains of E. coli cause infections in the urinary, intestinal, and respiratory tracts along with other diseases. The sources of pathogenic E. coli strains include contaminated water and food, and it may be transmitted through direct contact with infected people and animals or non-direct contact. Pathogenic E. coli strains may cause enteric/diarrheal illness, urinary tract diseases (UTDs) or sepsis/meningitis (Kaper et al., 2004). According to the Centers for Disease Control and Prevention (CDC) (https://www.cdc.gov/ecoli/general/index.html, December 1, 2014), pathogenic E. coli strains can be classified into six pathotypic strains as follows: Shiga toxin-producing E. coli (STEC), enterotoxigenic E. coli (ETEC), enteropathogenic E. coli (EPEC), enteroaggregative E. coli (EAEC), enter invasive E. coli (EIEC), and diffusely adherent E. coli (DAEC). Illnesses resulting from bacterial infections caused by pathogenic E. coli strains involve diarrhea, inflammation of the kidney (pyelonephritis), inflammation of the colon (dysentery), and hemolytic-uremic syndrome. Extreme response to such infections may lead to tissue damage, organ failure, and death (Donnenberg, 2013). These bacterial strains may develop resistance mechanisms to inhibit the effects of antibiotics and there are confirmed scientific evidences reporting that these bacterial strains can also disseminate the resistance genes to other bacteria (Morris et al., 1998).

The treatment for infectious diseases caused by E. coli strains must not include antibiotics that can replicate the risk of severe complications such as hemolytic uremia. The misdiagnosis of E. coli infection and misuse of antibiotics for treatment, may lead to the emergence of antibiotic resistant E. coli strains. A number of pathogenic and non-pathogenic E. coli strains have developed the ability to resist the standard antibiotics through numerous mechanisms, which we have discussed in this study. In Saudi Arabia, antimicrobial drug resistance genes, including β-lactam (blaSHV), gentamicin (aac(3)-IV), streptomycin ( aadA1), tetracyclines (tet(A), tet(B)), chloramphenicol (catA1,cmlA), erythromycin (ere(A)), and sulfonamide (sul1) resistance genes, have been detected among E. coli isolates (Abo-Amer et al., 2018). The present review aimed to update several scientific concepts related to antibiotic resistant E. coli strains.

Antibiotic Resistant E. coli Strains

In general, the pure bacterial isolates are considered resistant to a specific antibiotic if the minimum inhibitory concentration (MIC) (mg/L) of the antibiotics is greater than the breakpoint (mg/L). The standard assays define MIC as the lowest concentration of the antibiotic, which has the ability to inhibit the bacterial growth, using the standard methods such as two-fold macro-dilution serials, two-fold micro-dilution serials, or E-test protocol.

Figure 1: Biological microbial sites affected by several standard antibiotics. Figure 1: Biological microbial sites affected by several standard antibiotics.

Click here to View Figure

The MIC breakpoints are determined by several health organizations, such as the European Committee on Antimicrobial Susceptibility Test (EUCAST) and Clinical Laboratory and Standards Institute (CLSI), based on clinical and pharmacokinetic studies (Kuper et al., 2009; Reller et al., 2009). The bacterial strains, which show resistance to most standard antibiotics, are often known as superbugs. The MIC breakpoints (mg/L) and zone diameter breakpoints (mm) for most pathogenic microorganisms, including E. coli, are available in breakpoint tables for interpretation of MICs and zone diameters, Version 9.0, valid from 2019-01-01, http://www.eucast.org/clinical_breakpoints/). The breakpoints are also updated regularly by CLSI (https://clsi.org/media/2270/clsi_astnewsupdate_june2018_final.pdf). The methods used to determine MICs and MIC breakpoints must adhere to the procedures approved by the international committees on antimicrobial susceptibility testing, such as performance standards for antimicrobial susceptibility testing. 28th ed. CLSI supplement M100.

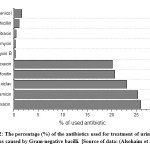
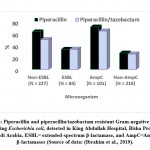
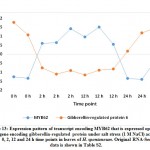
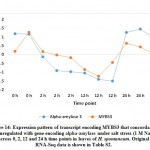
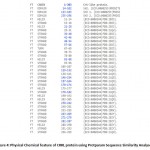
Antibiotic resistance pattern among E. coli isolates in Saudi Arabia has been evaluated using a group of standard antibiotics listed in Table 1. Figure 1 shows the percentage of antibiotics used for the treatment of urinary tract infections caused by Gram-negative bacilli, including E. coli isolates, in Buraidah Central Hospital from 1/8/2016 to 1/1/2017.

β-lactam Antibiotic Resistant E. coli Strains

Chemically, the presence of a β-lactam ring is sufficient to distinguish between the molecular structures of β-lactam antibiotics and those of the others. The β-lactam antibiotics are considered as the most widely prescribed group among all antibiotics, and include a large group of antibiotics such as penicillins (penicillin G and penicillin V, ampicillin, carbenicillin, oxacillin,  piperacillin, ticarcillin , dicloxacillin, nafcillin, amoxicillin, and ampicillin), cephalosporins (cephalothin, cefoxitin, cefuroxime, ceftriaxone, cefotaxime, cefepime, ceftaroline, fosamil, and ceftolozane), monobactams (aztreonam, tigemonam, nocardicin A, and tabtoxin), carbapenems (imipenem, ertapenem, doripenem, and meropenem), and carbacephems. The β-lactam antibiotics perform a specific biological activity to inhibit bacterial cell wall biosynthesis (Demain and Elander, 1999; Elander, 2003).

Table 1: Grouping of standard antibiotics used to study antibiotic resistance patterns among E. Table 1: Grouping of standard antibiotics used to study antibiotic resistance patterns among E.

Click here to View Table

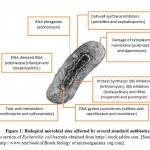
The β-lactam antibiotics act by penetrating the bacterial outer membrane through protein membrane channels called porins, to bind with penicillin-binding proteins (PBPs). Modifications in porins may reduce the permeability of bacterial cell membrane and β-lactam antibiotic resistance. The primary strategy followed by β-lactam antibiotic-resistant bacterial strains is the production of β-lactamase enzymes that biochemically disrupt the β-lactam ring, leading to the inactivation of the antibiotic (Bush and Bradford, 2016; Féria et al., 2002).

Figure 2: The percentage (%) of the antibiotics used for treatment of urinary tract infections caused by Gram-negative bacilli. Figure 2: The percentage (%) of the antibiotics used for treatment of urinary tract infections caused by Gram-negative bacilli.

Click here to View Figure

Ampicillin Resistant E. coli Strains

Ampicillin (aminobenzylpenicillin) is a β-lactam and broad-spectrum antibacterial agent that can be produced from penicillin using semi-synthetic methods. Ampicillin inhibits the cell wall biosynthesis of Gram-negative and Gram–positive bacteria as well as aerobic and anaerobic bacteria. The biochemical functions of specific proteins, called PBPs, located inside the bacterial cell wall are hampered by ampicillin. Ampicillin is considered as a bacteriolytic agent, which can interfere with autolytic enzyme inhibitors such as the autolysin inhibitor. The amino group present in the chemical structure of ampicillin facilitates the passage of ampicillin through the outer membrane of pathogenic Gram-negative bacteria causing irreversible inhibition of transpeptidase enzyme, leading to bacterial lysis during the binary fission stage.

The major mechanism of resistance to β-lactam antibiotics depends on the disruption of these compounds by the β-lactamases, which destroy the amide bond of the lactam ring (Munita and Arias, 2016). Although TEM, SHV, and OXA-type β-lactamases have been detected in E. coli strains resistant to ampicillin, TEM is considered as a major β-lactamase enzyme responsible for resistance to ampicillin (Briñas et al., 2002).

Ampicillin resistant E. coli strains have been isolated and identified from patients and several environmental sources over the last 20 years in Saudi Arabia. The following table summarizes the most important findings.

Oxacillin-Resistant E. coli

Oxacillin is a β-lactam antibiotic with a narrow-spectrum activity against penicillin- and methicillin-resistant bacterial strains. It generally is described as β-lactam antibiotic resistance to penicillinase enzyme. Oxacillin may obstruct chemical transpeptidation reaction in bacterial cell walls, leading to the inhibition of peptidoglycan synthesis, which in turn causes bacterial cell autolysis (Nadarajah et al., 2006). One of the studies carried out in Saudi Arabia has reported that E. coli isolates are the most predominant among uropathogenic bacteria (N=632) and concluded that all E. coli strains have no ability to resist oxacillin (Ali, 2018).

These findings were confirmed in a study (Alharbi et al., 2018), which showed that E. coli strains (N=227) isolated from wounds did not resist oxacillin. In 2004, Shobrak and Abo-Amer reported that all E. coli strains (N=82) isolated from migratory and non-migratory wild birds were resistant strains to oxacillin (Shobrak and Abo-Amer, 2014).

Piperacillin-Resistant E. coli

Piperacillin is β-lactam antibiotic with broad-spectrum activity, classified as ureidopenicillin antibiotics, which are a class of penicillins used to treat Pseudomonas aeruginosa. Piperacillin prohibits the 3ed and final phase of the synthesis of the microbial cell wall, and is believed to inhibit autolysin inhibitors in microbial cell lysis stages. The E. coli strains can hydrolyze piperacillin via ampC  and TEM-1 β-lactamase mediated in the chromosome or plasmid (Kadima and Weiner, 1997; Schechter et al., 2018). Combinations of piperacillin-tazobactam are often used to avoid these problems; nevertheless,  piperacillin-tazobactam resistant E. coli strains have also been isolated and detected (Schechter et al., 2018). In Saudi Arabia, piperacillin-resistant E. coli strains have been diagnosed in clinical and non-clinical samples. Approximately 70-80% of the clinical E. coli isolates have been found to be resistant to piperacillin (Alharbi et al., 2018; Ali, 2018; Shobrak and Abo-Amer, 2014). Piperacillin-tazobactam resistant E. coli strains have been isolated from a referral hospital in Saudi Arabia, among extended-spectrum β-lactamase- and ampC β-lactamase-producing Gram-negative bacteria (Ibrahim et al., 2019).

Table 2: Percentage (%) of ampicillin resistant E. coli strains isolated from several sources in Saudi Arabia.

Number of isolates (N) Percentage (%) of ampicillin resistant E. coli strains. Source of samples Reference
115 88.7% Chicken (Al‐Ghamdi et al., 1999)
99 70.7% Patients (Al‐Ghamdi et al., 1999)
117 53.8% poultry industry workers (Al‐Ghamdi et al., 1999)
392 In 2004 (75%)

In 2005 (80%)

In 2006 (60%)

In 2007 (70%)

In 2008 (>80%)

In 2009 (>80%)

Patients (Al Johani et al., 2010)
50%

63%

Outpatients

Inpatients

(Al-Tawfiq, 2006)
37 78.4% Chicken meat (Altalhi et al., 2010)
202 75.7% Patients  (urinary tract infection ) (Alghoribi et al., 2015)
227 84.8% Patients (wound infections) (Alharbi et al., 2018)
240 9.1% Raw milk (Alharbi et al., 2018)
182 44% (Camel, Beef, Lamb, Poultry) (Greeson et al., 2013)
150 51% Chickens (Abo-Amer et al., 2018)
683 85% Patients (Ali, 2018)
157 83 Outpatient (Al Wutayd et al., 2018)
82 70% (migratory birds)

40% (non- migratory birds)

Birds (Shobrak and Abo-Amer, 2014)

Imipenem-Resistant E. coli

Imipenem (C12H17N3O4S) is one of the β-lactam carbapenem antibiotics with the ability to resist β-lactamase. It has wide spectrum activity against aerobic, anaerobic, Gram-positive, and Gram-negative pathogenic bacteria. It can be used as a combination (imipenem-cilastatin) or triple-antibiotic (imipenem-cilastatin-relebactam) product. It is reported that bacterial resistance to carbapenem antimicrobial agents (imipenem and meropenem) leads to limiting therapeutic choices.

Figure 3: Piperacillin and piperacillin/tazobactam resistant Gram-negative bacteria Figure 3: Piperacillin and piperacillin/tazobactam resistant Gram-negative bacteria

Click here to View Figure

There are generally two methods employed by E. coli strains to resist carbapenem antibiotics; producing β-lactamase enzyme or reducing the permeability of bacterial cells, and strains may sometimes use both these ways.

Resistance of E. coli strains to imipenem has been not detected in clinical and nonclinical samples in Saudi Araba (Alam et al., 2017; Alqasim et al., 2018; Saeed et al., 2018). Conversely, imipenem-resistant E. coli strains have been isolated and detected from patients (N=72) (Ali, 2018) with UTIs (N=189) (Ali, 2018) and wound infections (N=161) (Alharbi et al., 2018).

Cephalosporin-resistant E. coli

Cephalosporins are antibacterial agents classified as bactericidal β-lactam drugs. They show biological activity to inhibit the bacterial cell synthesis by blocking cell wall enzymes. Currently, there are five generations of cephalosporins, which have been produced and marketed worldwide (Shahid et al., 2009). Previous studies have reported that E. coli strains isolated  from Saudi Arabia resist the first, second, third, and fourth generation of cephalosporins (i.e., cephalothin, cefoxitin, cefuroxime, ceftazidime, ceftriaxone, cefotaxime, and cefepime) (Alharbi et al., 2018; Ali, 2018). Ceftobiprole (fifth generation of cephalosporins) has been approved to treat pneumonia infections in several countries including Saudi Arabia (Pfaller et al., 2019). No evidence could be traced regarding isolation of E. coli strains resistant to ceftaroline and ceftobiprole, according to the information obtained by searching Google Scholar(https://scholar.google.com/) and (https://sdl.edu.sa/).

Tetracycline Resistant E. coli Strains

Tetracycline (C22H24N2O8), also known as anhydrotetracycline or deschlorobiomycin, is a bacteriostatic broad spectrum antibiotic that can act against an extensive range of pathogenic microbes including Gram-positive and Gram negative bacteria, chlamydiae, mycoplasmas, rickettsiae, and protozoan parasites (Chopra and Roberts, 2001).  It is secondary metabolic products follows the polyketide antibiotics produced by some of the actinomycetes bacteria “Streptomyces spp.”. In general, the tetracyclines can inhibit the biosynthesis of bacterial proteins by preventing the combination of aminoacyl-tRNA with the acceptor site, in the bacterial ribosome. The biological activity of tetracycline may include the 30S, 50S bacterial ribosomal subunit, and the cytoplasmic membrane.

Table 3: Percentage (%) of Cephalosporin-resistant E. coli strains isolated from several sources in Saudi Arabia.

Year Cephalothin Cefoxitin Cefuroxime Ceftazidime Ceftriaxone Cefotaxime Cefepime Sources  Reference
2013 4 3 13 3 6 Healthy neonates (Elkersh et al., 2015)
2015 15.25 81.36 76.27 75.58 Patients (Alyamani et al., 2017)
2015 0 32.2 92.2 50 Patients (Al-Mijalli, 2016)
2016 91 15 0 36 0 0 20 Patients (Ali, 2018)
2017 69 24 52 33 43 100 27 Patients (Ali, 2018)
2017 0 19 51.7 10.1 9 47.8 Patients (Alharbi et al., 2018)
2017 0 0 8.4 0 0 0 Raw milk (Alharbi et al., 2018)
2018 2 1 1 1 1 0 1 Farm chicken (Abo-Amer et al., 2018)
2018 85.7 92.9 100 92.9 78.57 85.71 Patients (Ineta et al., 2018)

The outer membrane of Gram-negative bacteria is traversed by the  tetracyclines through the OmpF and OmpC porin pathways (Chopra et al., 1992). The bacteria can resist the tetracyclines by exporting tetracycline from the bacterial cell by efflux proteins, which are encoded by the tet efflux genes, protection of bacterial ribosomes by cytoplasmic proteins, or inactivation of tetracycline through enzymatic modification (Ref.). The misuse of tetracycline compounds has been confirmed in Saudi Arabia. Several poultry products have been screened to detect the residues of tetracycline agents, the results indicate that the level of the tetracycline residues has reached over the maximum residue limit in some tested samples (Al-Ghamdi et al., 2000).

Table 4: Percentage (%) of tetracycline-resistant E. coli strains isolated from several sources in Saudi Arabia.

Number of isolates (N) Percentage (%) of ampicillin resistant E. coli strains. Source of samples Reference
116 99% Chicken (Al‐Ghamdi et al., 1999)
99 64.7% Patients (Al‐Ghamdi et al., 1999)
10 30 Pigeons (Abulreesh, 2011)
150 97% Chicken (Abo-Amer et al., 2018)
100 49% inpatients (urine samples) (Alqasim et al., 2018)
683 85% Patients (Ali, 2018)
161 68% Patients (wound infection) (Alharbi et al., 2018)
32 100% (migratory birds)

84% (non- migratory birds)

Birds (Shobrak and Abo-Amer, 2014)

Aminoglycosides Resistant E. coli

The aminoglycosides are natural (gentamicin and tobramycin) or semisynthetic (derivatives of natural antibiotics such as amikacin), broad-spectrum, bactericidal antimicrobial agents which are generally introduced for the treatment of Gram-negative infections in humans (Germovsek et al., 2017; Krause et al., 2016). Aminoglycoside antibiotic-resistant bacterial strains can fight the antibiotics derived from aminoglycosides, using various strategies including modification of target sites by biosynthesis of specific enzymes, as well as mutation in bacterial chromosome and efflux pump (Krause et al., 2016; Rosenberg et al., 2000). Aminoglycoside antibiotic-resistant E. coli strains have been detected in patients, individuals, and food products in Saudi Arabia (Al‐Ghamdi et al., 1999; Alharbi et al., 2018; Ali, 2018).

Gentamicin

Gentamicin (C21H43N5O7) is a secondary metabolite produced by Micromonospora purpurea (a saprophytic, filamentous, aerobic, spore-forming, and Gram-positive bacterium, which can be isolated from the soil). In general, it is used for the treatment of bacterial infections caused by bacterial strains susceptible to antibiotics, including E. coli strains. Gentamicin is classified as an aminoglycoside antimicrobial agent with broad-spectrum activity against Gram-positive and Gram-negative bacteria. It can obstruct the synthesis of bacterial proteins through interaction with the prokaryotic 30S ribosomal subunit, leading to misinterpretation of transfer ribonucleic acid (t-RNA) (Yoshizawa et al., 1998). In general, the bacteria acquire aminoglycoside resistance via three potential mechanisms: 1) alteration in bacterial cell permeability (reducing uptake), 2) modification at sites in the ribosomal subunit, and 3) synthesis of specific enzymes having the ability to modify the chemical structure of aminoglycosides (Yoshizawa et al., 1998). Aminoglycoside N(3)-acetyltransferase (aac(3)-IV) gene has been detected in numerous aminoglycoside-resistant E. coli isolates (Costa et al., 2008; Domínguez et al., 2002; Zhang et al., 2009).

Streptomycin

Streptomycin (C21H39N7O12) is chemically classified as an aminoglycoside antimicrobial agent that can be produced by Streptomyces griseus, which is frequently isolated from the soil. Streptomycin has the ability to irreversibly bind to the 30S ribosomal subunit proteins and 16S rRNA. The interaction between streptomycin and decoding area in 16S rRNA of the 30S ribosomal subunit (site near nucleotide 1400). The principle of interaction is the capacity of streptomycin to bind with a single amino acid of the 30S ribosomal protein S12 and four nucleotides of 16S rRNA, which lead to mRNA misreading. In bacteria, genetically acquired streptomycin resistance is frequently due to genetic alteration in rpsL gene, which encodes the ribosomal protein S12 (Springer et al., 2001).

In Saudi Arabia, E. coli strains resistant to gentamicin have been identified and isolated from inpatients, outpatients, animals, and foods. Spontaneous streptomycin‐resistant E coli strains have a genetic alteration in several sites in 30S ribosomal protein S12 including Lys42, Lys87, Pro90, and Gly9 (Chumpolkulwong et al., 2004). In Saudi Arabia, the E coli strains resistant to streptomycin have been characterized and streptomycin-resistance genes have been detected (Abo-Amer et al., 2018). Streptomycin-resistant E. coli strains have been isolated from numerous sources including raw chicken meat, wastewater, as well as in patient samples (skin, blood, urine, stool, and respiratory tract) (Alam et al., 2017; Altalhi et al., 2010; Mantilla-Calderon et al., 2016). In a prior study performed in Taif, Saudi Arabia, more than 48% of the streptomycin-resistant E. coli strains (N=119) were isolated from retail raw chicken meat (Al Johani et al., 2010).

Table 5: Percentage (%) of gentamicin-resistant E. coli strains isolated from several sources in Saudi Arabia.

Number of isolates (N) Percentage (%) of gentamicin resistant E. coli strains. Source of samples Reference
116 89.7 Chicken (Al‐Ghamdi et al., 1999)
96 21.9 Patient (Al‐Ghamdi et al., 1999)
768 47%

(from 2006 to 2010)

Hospitalized patient and outpatient (Somily et al., 2014)
683 27% Patients (Ali, 2018)
157 14 Outpatient (Al Wutayd et al., 2018)
32 0% (migratory birds)

4% (non- migratory birds)

Birds (Shobrak and Abo-Amer, 2014)

In Riyadh, Saudi Arabia, it has been reported that all isolates of E. coli (N=200) detected in the feces of broiler chickens are resistant to streptomycin (Al-Arfaj et al., 2015). Streptomycin-resistant strains have been found to be the preponderant strains among enterotoxigenic E. coli isolates (N=181) collected from patients with diarrhea (Willshaw et al., 1995).

Tobramycin

Tobramycin (C18H37N5O9) is a narrow spectrum aminoglycoside antimicrobial agent, which can interact with microbial 30S and 50S ribosome, thereby preventing the formation of 70S ribosome complex. It is widely used to treat microbial infections caused by Gram-negative bacteria. The intracellular concentration of tobramycin is critical for its action. Active transport of tobramycin through the bacterial membrane is a significant mechanism that helps to increase tobramycin concentration inside the bacterial cell. The bacterial strains generally gain resistance to tobramycin through one or more of the three strategies mentioned above (physiological or genetic alteration in cell permeability, mutation at the ribosomal binding sites, or synthesis of enzymes having the ability to modify the aminoglycoside) (Islam et al., 2009). In Saudi Arabia, 67% of the E. coli strains (N=1116) isolated from patients were tobramycin-resistant strains (Kader and Kumar, 2004). In 2015, 57% of E. coli strains (N=130) detected in  pilgrims (patients) admitted in Makkah, Saudi Arabia were tobramycin-resistant (Haseeb et al., 2016). In King Fahd Hospital University, Clinical Microbiology Department,  Al-Khobar, Saudi Arabia (Al-Zahrani and Akhtar, 2005), more than 75% of the E. coli strains (N=48) depicted the ability to resist tobramycin.

Kanamycin

Kanamycin (C18H36N4O11) is a bactericidal antimicrobial agent grouped on the basis of its chemical structure in the aminoglycoside antibiotics group. It has the ability to eliminate bacterial pathogens by inhibiting protein synthesis, using the same mechanism of action as the aminoglycosides to cause irreversible damage in small ribosomal subunit and 16S ribosomal RNA. The pathogenic bacteria resistance to kanamycin. In industrial microbiology, kanamycin is produced using Streptomyces kanamyceticus. The E. coli strains with kanMX marker show resistance to kanamycin. In Kanamycin-resistant E. coli strains, efflux pumps may act to drive out kanamycin from E. coli cells. Resistance may be developed by a mutation in the ribosomal subunit target or by ribosome methyltransferases, which have gained increasing clinical importance (Garneau-Tsodikova and Labby, 2016). In Saudi Arabia, kanamycin-resistant E. coli strains have been isolated and detected in wastewater (Mantilla-Calderon et al., 2016), vegetable salads (Khiyami et al., 2011), and meat (Greeson et al., 2013). A study reported that all E. coli strains (N=60) isolated from frozen fish in Eastern Province of Saudi Arabia were kanamycin-susceptible E. coli isolates.

Neomycin

Neomycin is one of the aminoglycoside antimicrobial agents that have strong biological activity against pathogenic Gram-negative bacteria. It can be produced by fermentation using Streptomyces spp. such as S. fradiae and S. albogriseus. Neomycin inhibits microbial protein synthesis by interacting with 30S subunit and 16S rRNA. The E. coli strains that harbor the gene neo (coding for the 29-kDa phosphotransferase enzyme), have the biological ability to resist neomycin and kanamycin (Genilloud et al., 1988).

The neomycin-resistant E. coli mutants show significant alteration in the activity of membrane Mg2+-ATPase and periplasmic alkaline phosphatase. Point mutations in rrsB 16S rRNA gene, especially at the 3’ minor domain of helix 4 can lead to emergence of E. coli strains resistant to neomycin (Obaseiki-Ebor and Breeze, 1984) (https://card.mcmaster.ca/ontology/39986). In Saudi Arabia, E. coli strains resistant to neomycin have been reported by some previous studies (21% of 180 isolates of E. coli were resistant) (Abo-Amer et al., 2018); however, many reports have confirmed that all E. coli strains were susceptible to neomycin (Ali, 2018). It has been reported that neomycin is one of the less-used drugs among the 44 antibiotic drugs used to treat urinary tract infections (N=339) (Alsohaim et al., 2019).

Other Antibiotics

In Saudi Arabia, it has been reported that there are numerous E. coli strains that possess the ability to resist macrolides (erythromycin), chloramphenicol, quinolone (naldixic acid and ciprofloxacin), fluoroquinolones (norflaxacin), sulfonamide (sulfamethaxazole), glycopeptide (vancomycin), semisynthetic lincosamide (clindamycin), nitrofuran (nitrofurantoin), and pyrimidine (trimethoprim) antibiotics. Chloramphenicol, kanamycin, cefoxitin, and ceftiofur-resistant E. coli strains have been detected in Saudi Arabia from several sources of locally marketed meat (Greeson et al., 2013).

Both extended spectrum β-lactamase (ESB) E. coli or non-ESB E. coli strains show resistance to synergic action produced from sulfamethoxazole and trimethoprim (cotrimoxazole) among clinical isolates (Al-Otaibi and Bukhari, 2013). In fact, it is believed that the resistance to antibiotics is increasing continuously; however, sometimes the opposite occurs and the strains show susceptibility to the same antibiotics to which they were resistant in the past (Table).

Table 6: Percentage (%) of E. coli strains resistant to antibiotics, causing urinary tract infections in Saudi Arabia, in 1985 and 2017. 

Antibiotic % in 2017 Antibiotic % in 1985
Cotrimoxazole 72 Trimethoprim 59
Chlormphenicol 75 Sulfamethoxazole 87
Nalidixic acid 76 Nalidixic acid 10
Nitrofurantoin 26 Nitrofurantoin 32
Cip/Norfloxacin 59 N.T
Erythromycin 100 N.T
Clindamycin 100 N.T

* References: (Ali, 2018); (Eltahawy and Khalaf, 1988); N.T= Not tested

Conclusion

Antibiotics are frequently used for therapy of infected humans and animals. Treatment for E. coli infection has been highly difficult by the rise of resistance to most first-line antibiotics. The data showed the prevalence of E. coli strains in Saudi Arabia, which can resist all antibiotic groups including β-lactams, cephalosporins, aminoglycosides (except fifth generation), macrolides, chloramphenicol, quinolones, flouroquiolones, nitrofurans, sulfonaides, pyrimidine analogues, semisynthetic lincosamides, glycopeptides, and tetracycline antibiotics. The integrated monitoring and management of the antibiotics used to treat infections caused by E. coli must be applied to reduce health hazards.

Acknowledgments

The author wishes to thank Dr. Jamal M. Khaled and Dr. Shine Kadaikunnan for the helpful discussions on the topic. This project was funded by the King Abdulaziz City for Science and Technology (KACST), Kingdom of Saudi Arabia (Award number: LGP- 36-7).

Conflict of Interest

There is no Conflict of interest

Funding Source

This project was funded by the King Abdulaziz City for Science and Technology (KACST), Kingdom of Saudi Arabia (Award number: LGP- 36-7).

References

  1. Abo-Amer, A.E., Shobrak, M.Y., Altalhi, A.D., 2018. Isolation and antimicrobial resistance of Escherichia coli isolated from farm chickens in Taif, Saudi Arabia. Journal of Global Antimicrobial Resistance 15, 65-68.
  2. Abulreesh, H.H., 2011. Free living rock pigeon (Columba livia) as an environmental reservoir of enteric bacterial pathogens resistant to antimicrobial drugs in Saudi Arabia. Current Research in Bacteriology 4, 28-33.
  3. Al-Arfaj, A., Hessain, A., Hemeg, H., Mohamed, K.F., Moussa, I., 2015. Isolation, characterization and antibiogram of pathogenic Escherichia coli recovered from broiler chicken, Riyadh, Saudi Arabia. J Anim Plant Sci 25, 1540-1542.
  4. Al-Ghamdi, M., Al-Mustafa, Z., El-Morsy, F., Al-Faky, A., Haider, I., Essa, H., 2000. Residues of tetracycline compounds in poultry products in the eastern province of Saudi Arabia. Public Health 114, 300-304.
  5. Al-Mijalli, S., 2016. Extended-spectrum β-lactamase enzymes (ESBLs) produced by Escherichia coli urinary pathogens at Riyadh, Saudi Arabia. J Antimicrob Agents 2, 2472-1212.1000125.
  6. Al-Otaibi, F.E., Bukhari, E.E., 2013. Clinical and laboratory profiles of urinary tract infections caused by extendedspectrum beta-lactamase-producing Escherichia coli in a tertiary care center in central Saudi Arabia. Saudi Med J 34, 171-176.
  7. Al-Tawfiq, J.A., 2006. Increasing antibiotic resistance among isolates of Escherichia coli recovered from inpatients and outpatients in a Saudi Arabian hospital. Infection Control & Hospital Epidemiology 27, 748-753.
  8. Al-Zahrani, A.J., Akhtar, N., 2005. Susceptibility patterns of extended spectrum ß-lactamase (ESBL)-producing Escherichia coli and Klebsiella pneumoniae isolated in a teaching hospital. Pak J Med Res 44, 64-67.
  9. Al‐Ghamdi, M.S., El‐Morsy, F., Al‐Mustafa, Z.H., Al‐Ramadhan, M., Hanif, M., 1999. Antibiotic resistance of Escherichia coli isolated from poultry workers, patients and chicken in the eastern province of Saudi Arabia. Tropical Medicine & International Health 4, 278-283.
  10. Al Johani, S.M., Akhter, J., Balkhy, H., El-Saed, A., Younan, M., Memish, Z., 2010. Prevalence of antimicrobial resistance among gram-negative isolates in an adult intensive care unit at a tertiary care center in Saudi Arabia. Annals of Saudi medicine 30, 364.
  11. Al Wutayd, O., Al Nafeesah, A., Adam, I., Babikir, I., 2018. The antibiotic susceptibility patterns of uropathogens isolated in Qassim, Saudi Arabia. The Journal of Infection in Developing Countries 12, 946-952.
  12. Alam, M.Z., Alam, Q., Jiman-Fatani, A.A., Shukri, H.A., Haque, A., 2017. A surveillance study on the prevalence and antimicrobial resistance pattern among different groups of bacteria isolated from Western province of Saudi Arabia. Biomedical Research (0970-938X)
  13. Alghoribi, M.F., Gibreel, T.M., Farnham, G., Al Johani, S.M., Balkhy, H.H., Upton, M., 2015. Antibiotic-resistant ST38, ST131 and ST405 strains are the leading uropathogenic Escherichia coli clones in Riyadh, Saudi Arabia. Journal of Antimicrobial Chemotherapy 70, 2757-2762.
  14. Alharbi, N.S., Khaled, J.M., Kadaikunnan, S., Alobaidi, A.S., Sharafaddin, A.H., Alyahya, S.A., Almanaa, T.N., Alsughayier, M.A., Shehu, M.R., 2018. Prevalence of Escherichia coli strains resistance to antibiotics in wound infections and raw milk. Saudi Journal of Biological Sciences.
  15. Ali, A., 2018. Antimicrobial Resistance Pattern of Uropathogens Isolated from Rafha Central Hospital, Rafha, Kingdom of Saudi Arabia. Journal of Pure and Applied Microbiology 12, 577-586.
  16. Alqasim, A., Abu Jaffal, A., Alyousef, A.A., 2018. Prevalence of multidrug resistance and extended-spectrum β-lactamase carriage of clinical uropathogenic Escherichia coli isolates in Riyadh, Saudi Arabia. International Journal of Microbiology
  17. Alsohaim, S.I., Bawadikji, A.A., Elkalmi, R., Mahmud, M.I.A.-d.M., Hassali, M.A., 2019. Relationship between antimicrobial prescribing and antimicrobial resistance among UTI patients at Buraidah Central Hospital, Saudi Arabia. Journal of Pharmacy & Bioallied Sciences 11, 162.
  18. Altalhi, A.D., Gherbawy, Y.A., Hassan, S.A., 2010. Antibiotic resistance in Escherichia coli isolated from retail raw chicken meat in Taif, Saudi Arabia. Foodborne Pathogens and Disease 7, 281-285.
  19. Alyamani, E.J., Khiyami, A.M., Booq, R.Y., Majrashi, M.A., Bahwerth, F.S., Rechkina, E., 2017. The occurrence of ESBL-producing Escherichia coli carrying aminoglycoside resistance genes in urinary tract infections in Saudi Arabia. Annals of Clinical Microbiology and Antimicrobials 16, 1.
  20. Briñas, L., Zarazaga, M., Sáenz, Y., Ruiz-Larrea, F., Torres, C., 2002. β-Lactamases in ampicillin-resistant Escherichia coli isolates from foods, humans, and healthy animals. Antimicrobial Agents and Chemotherapy 46, 3156-3163.
  21. Bush, K., Bradford, P.A., 2016. β-Lactams and β-lactamase inhibitors: an overview. Cold Spring Harbor perspectives in medicine 6, a025247.
  22. Chopra, I., Hawkey, P., Hinton, M., 1992. Tetracyclines, molecular and clinical aspects. Journal of Antimicrobial Chemotherapy 29, 245-277.
  23. Chopra, I., Roberts, M., 2001. Tetracycline antibiotics: mode of action, applications, molecular biology, and epidemiology of bacterial resistance. Microbiol. Mol. Biol. Rev. 65, 232-260.
  24. Chumpolkulwong, N., Hori‐Takemoto, C., Hosaka, T., Inaoka, T., Kigawa, T., Shirouzu, M., Ochi, K., Yokoyama, S., 2004. Effects of Escherichia coli ribosomal protein S12 mutations on cell‐free protein synthesis. European Journal of Biochemistry 271, 1127-1134.
  25. Costa, D., Poeta, P., Sáenz, Y., Vinué, L., Coelho, A.C., Matos, M., Rojo-Bezares, B., Rodrigues, J., Torres, C., 2008. Mechanisms of antibiotic resistance in Escherichia coli isolates recovered from wild animals. Microbial Drug Resistance 14, 71-77.
  26. Demain, A.L., Elander, R.P., 1999. The β-lactam antibiotics: past, present, and future. Antonie Van Leeuwenhoek 75, 5-19.
  27. Domínguez, E., Zarazaga, M., Sáenz, Y., Briñas, L., Torres, C., 2002. Mechanisms of antibiotic resistance in Escherichia coli isolates obtained from healthy children in Spain. Microbial Drug Resistance 8, 321-327.
  28. Donnenberg, M., 2013. Introduction In: Escherichia coli: pathotypes and principles of pathogenesis, Second Edition. Elsevier Inc. UK, Page xvii. , xvii. p.
  29. Elander, R., 2003. Industrial production of β-lactam antibiotics. Applied Microbiology and Biotechnology 61, 385-392.
  30. Elkersh, T., Marie, M.A., Al-Sheikh, Y.A., Bloushy, A.A., Al-Agamy, M.H., 2015. Prevalence of fecal carriage of extended-spectrum-and metallo-β-lactamase-producing gram-negative bacteria among neonates born in a hospital setting in central Saudi Arabia. Annals of Saudi medicine 35, 240-247.
  31. Eltahawy, A.T., Khalaf, R.M., 1988. Urinary tract infection at a university hospital in Saudi Arabia: Incidence, microbiology, and antimicrobial susceptibility. Annals of Saudi Medicine 8, 261-266.
  32. Féria, C., Ferreira, E., Correia, J.D., Gonçalves, J., Caniça, M., 2002. Patterns and mechanisms of resistance to β-lactams and β-lactamase inhibitors in uropathogenic Escherichia coli isolated from dogs in Portugal. Journal of Antimicrobial Chemotherapy 49, 77-85.
  33. Garneau-Tsodikova, S., Labby, K.J., 2016. Mechanisms of resistance to aminoglycoside antibiotics: overview and perspectives. MedChemComm 7, 11-27.
  34. Genilloud, O., Blázquez, J., Mazodier, P., Moreno, F., 1988. A clinical isolate of transposon Tn5 expressing streptomycin resistance in Escherichia coli. Journal of Bacteriology 170, 1275-1278.
  35. Germovsek, E., Barker, C.I., Sharland, M., 2017. What do I need to know about aminoglycoside antibiotics? Archives of Disease in Childhood-Education and Practice 102, 89-93.
  36. Greeson, K., Suliman, G.M., Sami, A., Alowaimer, A., Koohmaraie, M., 2013. Frequency of antibiotic resistant Salmonella, Escherichia coli, Enterococcus, and Staphylococcus aureus in meat in Saudi Arabia. African Journal of Microbiology Research 7, 309-316.
  37. Haseeb, A., Faidah, H.S., Bakhsh, A.R., Al Malki, W.H., Elrggal, M.E., Saleem, F., ur Rahman, S., Khan, T.M., Hassali, M.A., 2016. Antimicrobial resistance among pilgrims: a retrospective study from two hospitals in Makkah, Saudi Arabia. International Journal of Infectious Diseases 47, 92-94.
  38. Ibrahim, M.E., Abbas, M., Al-Shahrai, A.M., Elamin, B.K., 2019. Phenotypic characterization and antibiotic resistance patterns of extended-spectrum β-lactamase and AmpC β-lactamase-producing Gram-negative bacteria in a referral hospital, Saudi Arabia. Canadian Journal of Infectious Diseases and Medical Microbiology
  39. Ineta, B.-E.L., Madu, E.P., Abdulhadi, A.-S.A., Ibrahim, H.I.M., 2018. Antibiotic susceptibility and plasmid profile of clinical isolates of Escherichia coli.
  40. Islam, S., Oh, H., Jalal, S., Karpati, F., Ciofu, O., Høiby, N., Wretlind, B., 2009. Chromosomal mechanisms of aminoglycoside resistance in Pseudomonas aeruginosa isolates from cystic fibrosis patients. Clinical Microbiology and Infection 15, 60-66.
  41. Jenkins, C., Rentenaar, R.J., Landraud, L., Brisse, S. 2017. Enterobacteriaceae, In: Infectious Diseases. Elsevier, 1565-1578. e1562.
  42. Kader, A.A., Kumar, A.K., 2004. Prevalence of extended spectrum beta-lactamase among multidrug resistant gram-negative isolates from a general hospital in Saudi Arabia. Saudi Medical Journal 25, 570-574.
  43. Kadima, T.A., Weiner, J.H., 1997. Mechanism of suppression of piperacillin resistance in enterobacteria by tazobactam. Antimicrobial agents and chemotherapy 41, 2177-2183.
  44. Kaper, J.B., Nataro, J.P., Mobley, H.L., 2004. Pathogenic Escherichia coli. Nature Reviews Microbiology 2, 123.
  45. Khiyami, M., Noura, A.-F., Busaeed, B., Sher, H., 2011. Food borne pathogen contamination in minimally processed vegetable salads in Riyadh, Saudi Arabia. Journal of Medicinal Plants Research 5, 444-451.
  46. Krause, K.M., Serio, A.W., Kane, T.R., Connolly, L.E., 2016. Aminoglycosides: an overview. Cold Spring Harbor Perspectives In Medicine 6, a027029.
  47. Kuper, K.M., Boles, D.M., Mohr, J.F., Wanger, A., 2009. Antimicrobial susceptibility testing: a primer for clinicians. Pharmacotherapy: The Journal of Human Pharmacology and Drug Therapy 29, 1326-1343.
  48. Mantilla-Calderon, D., Jumat, M.R., Wang, T., Ganesan, P., Al-Jassim, N., Hong, P.-Y., 2016. Isolation and characterization of NDM-positive Escherichia coli from municipal wastewater in Jeddah, Saudi Arabia. Antimicrobial Agents and Chemotherapy 60, 5223-5231.
  49. Matic, I., Radman, M., Taddei, F., Picard, B., Doit, C., Bingen, E., Denamur, E., Elion, J., 1997. Highly variable mutation rates in commensal and pathogenic Escherichia coli. Science 277, 1833-1834.
  50. Morris, A., Kellner, J.D., Low, D.E., 1998. The superbugs: evolution, dissemination and fitness. Current Opinion in Microbiology 1, 524-529.
  51. Munita, J.M., Arias, C.A., 2016. Mechanisms of antibiotic resistance. Microbiology Spectrum
  52. Nadarajah, J., Lee, M.J., Louie, L., Jacob, L., Simor, A.E., Louie, M., McGavin, M.J., 2006. Identification of different clonal complexes and diverse amino acid substitutions in penicillin-binding protein 2 (PBP2) associated with borderline oxacillin resistance in Canadian Staphylococcus aureus isolates. Journal of Medical Microbiology 55, 1675-1683.
  53. Obaseiki-Ebor, E., Breeze, A., 1984. Gentamicin-and neomycin-resistant mutants of Escherichia coli K-12 cross-resistant to nitrofurans. Journal of Antimicrobial Chemotherapy 13, 567-576.
  54. O’Neill J., 2016 Tackling drug‐resistant infections globally: final report and recommendations.
  55. Review on Antimicrobial Resistance.
  56. Pfaller, M.A., Flamm, R.K., Duncan, L.R., Shortridge, D., Smart, J.I., Hamed, K.A., Mendes, R.E., Sader, H.S., 2019. Ceftobiprole activity when tested against contemporary bacteria causing bloodstream infections in the United States (2016–2017). Diagnostic Microbiology and Infectious Disease.
  57. Reller, L.B., Weinstein, M., Jorgensen, J.H., Ferraro, M.J., 2009. Antimicrobial susceptibility testing: a review of general principles and contemporary practices. Clinical Infectious Diseases 49, 1749-1755.
  58. Rosenberg, E.Y., Ma, D., Nikaido, H., 2000. AcrD of Escherichia coli is an aminoglycoside efflux pump. Journal of Bacteriology 182, 1754-1756.
  59. Saeed, W.M., Ghanem, S., El Shafey, H.M., Manzoor, N., 2018. Assessment of antimicrobial resistance patterns in Escherichia coli isolated from clinical samples in Madinah, Saudi Arabia. African Journal of Microbiology Research 12, 321-326.
  60. Schechter, L.M., Creely, D.P., Garner, C.D., Shortridge, D., Nguyen, H., Chen, L., Hanson, B.M., Sodergren, E., Weinstock, G.M., Dunne, W.M., 2018. Extensive gene amplification as a mechanism for piperacillin-tazobactam resistance in Escherichia coli. Mbio 9, e00583-00518.
  61. Shahid, M., Sobia, F., Singh, A., Malik, A., Khan, H., Jonas, D., Hawkey, P., 2009. Beta-lactams and beta-lactamase-inhibitors in current-or potential-clinical practice: a comprehensive update. Critical Reviews in Microbiology 35, 81-108.
  62. Shobrak, M.Y., Abo-Amer, A.E., 2014. Role of wild birds as carriers of multi-drug resistant Escherichia coli and Escherichia vulneris. Brazilian Journal of Microbiology 45, 1199-1209.
  63. Somily, A.M., Habib, H.A., Absar, M.M., Arshad, M.Z., Manneh, K., Al Subaie, S.S., Al Hedaithy, M.A., Sayyed, S.B., Shakoor, Z., Murray, T.S., 2014. ESBL-producing Escherichia coli and Klebsiella pneumoniae at a tertiary care hospital in Saudi Arabia. The Journal of Infection in Developing Countries 8, 1129-1136.
  64. Springer, B., Kidan, Y.G., Prammananan, T., Ellrott, K., Böttger, E.C., Sander, P., 2001. Mechanisms of streptomycin resistance: selection of mutations in the 16S rRNA gene conferring resistance. Antimicrobial Agents and Chemotherapy 45, 2877-2884.
  65. Tenaillon, O., Skurnik, D., Picard, B., Denamur, E., 2010. The population genetics of commensal Escherichia coli. Nature Reviews Microbiology 8, 207.
  66. Willshaw, G., Cheasty, T., Rowe, B., Smith, H., Faithfull-Davies, D., Brooks, T., 1995. Isolation of enterotoxigenic Escherichia coli from British troops in Saudi Arabia. Epidemiology & Infection 115, 455-463.
  67. Yoshizawa, S., Fourmy, D., Puglisi, J.D., 1998. Structural origins of gentamicin antibiotic action. The EMBO Journal 17, 6437-6448.
  68. Zhang, X.Y., Ding, L.J., Fan, M.Z., 2009. Resistance patterns and detection of aac (3)-IV gene in apramycin-resistant Escherichia coli isolated from farm animals and farm workers in northeastern of China. Research in Veterinary Science 87, 449-454.


Standardization of Mannose Based Positive Selection in indica Rice Variety Swarna

$
0
0

Introduction

Genetically modified (GM) crops are a field reality and many nations had adopted GM crops. Several agronomical traits targeting various biotic and abiotic stresses were successfully incorporated into various crop species.1These traits provide metabolic advantage to the crop species whose native genepool does not harbor specific target genes. Several genes were transferred across the species.2-3 irrespective of the genetic background. However, success of foreign gene transfer depends on the stringent selective criteria, adopted after gene transformation. Predominantly selection of transformed explants is done with the help of antibiotic selectable markers with their added advantage to make the transformed explants survive in the selective antibiotic medium.4-11 However, these antibiotic selectable marker genes pose environmental threats.12-22 Keeping in view, the biosafety aspects of transgenics, positive selection is adopted using nontoxic substances as selectable agents, such as xylose, galactose, and mannose.23-25

In this study we had utilised mannose/phosphomannose isomerase (PMI) system. In this system, man A gene coding for the enzyme phosphomannose isomerase (pmi) taken from Escherichia coli, is used as selectable marker.26 This system allows selection of transformed explants which have a metabolic advantage to utilize mannose sugar in the medium whereas non transformed cells cannot.  The selection strategy is based on the observation that the intracellular hexokinase converts mannose into its orthophosphate by utilizing the energy currency of the cell, thereby resulting in feedback inhibition of the cycle and further severe growth inhibition of the cells27-30. However, the enzyme phosphomannose isomerase (pmi) catalyzes the conversion of accumulated mannose orthophosphate into fructose-6-phosphate which can be metabolized by the transformed cells.31 In this kind of selection, non-transformed cells are deprived of the metabolic carbon source, hence their growth is restricted, whereas the transformed counterparts start growing in the mannose medium. However, in antibiotic selection, non-transformed cells are killed due to the toxic effects of antibiotic. Hence antibiotic selection is called as negative selection, whereas mannose based selection is called as positive selection.

In this study PMI gene was transformed into elite indica rice variety Swarna. Mannose is employed as sugar source for selection. Experimental results regarding optimizing selection concentration of mannose and variations followed during regeneration stage compared with other studies along with the prospects and consequences involved were discussed.

Materials and Methods

Genotype

In this study, an elite indica rice variety Swarna, is used for transformation. It is a popular rice variety and is widely grown in eastern Indian and several other states It is widely adapted and grown in neighboring countries like Myanmar and Bangladesh.32 It has a yield potential of 75 Quintals/hectare. The grains are short bold and the duration of the crop is 150 days.33

Callus Induction and Proliferation

Surface sterilization of the mature dehusked grains of indica rice variety Swarna was carried out as per earlier reports.34 Sterilized kernels were then inoculated into culture tubes containing semisolid Callus Induction (CI) medium. [MS medium supplemented with maltose (30 gl-1), 2, 4-dichlorophenoxy acetic acid (2, 4-D) (2 mgl-1), and solidified with gel-rite (2.6 gl-1)]35 later, cultures were kept in dark and incubated at 24 ± 2ºC for three weeks. Compact embryogenic calli were excised and transferred into semi solid modified MS medium made ready for bombardment. (MS salts and vitamins, Myo Inositol (100 mgl-1), Sorbitol, (20 gl-1), Mannitol (36.4 gl-1), maltose (30 gl-1), L-proline (500 mgl-1), casein hydrolysate (300 mgl-1), 2,4-D (2.0 mgl-1), and Gelrite, (2.6 gl-1) with pH 5.8)

Plasmid Preparation

A single colony of E.coli strain pNOV2819 (Syngenta, USA) carrying the man A gene coding for the enzyme phosphomannose isomerase (pmi) was used for culture and plasmid attraction as per our earlier reports.36

Transformation

Micro-carriers were prepared as per standard protocol using gold, particles (1µ).37 Plasmid DNA with the transformation vector pNOV2819 is loaded onto the micro carriers and bombarded on embryogenic calli at 1100 psi helium pressure using the particle gun PDC-1000/He system (BIORAD) following manufacturer’s instructions.

Optimization of Mannose Concentration Required for Selection

With a view to standardize the concentration of mannose for selection of the transformed calli, an experiment was designed using the seed germination and seedling growth as the critera to fix the ideal concentration using different concentrations starting from 0.025% to 1.0% with mannose alone and with combination of other sugars like glucose, sucrose and maltose (Fig.1)

Figure 1: Effect of mannose on seed germination and growth. Figure 1: Effect of mannose on seed germination and growth.

Click here to View Figure

Selection

In case of positive selection, after the bombardment, the embryogenic calli were kept at dark for overnight in the same medium. The following day, the transformed calli were sub cultured onto selection medium supplemented with mannose @ 10 g l. After 15 days, the newly developing calli based on their growth pattern on mannose media were distinguished into actively dividing calli, moderately dividing calli and poorly dividing calli and were sub cultured onto fresh media for at least four cycles (Fig.2) and after keeping for four cycles on selection medium, the number of actively dividing calli were recorded and transferred into regeneration media.

Figure 2: Differential growth pattern of calli grown on mannose supplemented media Figure 2: Differential growth pattern of calli grown on mannose supplemented media

Click here to View Figure

DNA Extraction and PCR assay

Actively growing calli on the selection media were selected and from a half portion of the callus, DNA was extracted following the mini prep method38 while, the second half of the callus was allowed to grow in the medium. Incidence of PMI gene was determined by polymerase chain reaction (PCR) with the help of specific primers to give an amplification product of ~0.514 kb size.  The plasmid DNA (pNOV2819) was used as the positive control and non-transformed callus DNA is taken as negative control. The PCR mix contained 1µl of plant DNA (20ng), 0.8µl of 2.5mM dNTPs (Fermentas), 1.0 µl of 10X PCR buffer (10mM Tris, pH 8.4, 50 mM KCl, and 15 mM MgCl2; Sigma), 0.2µl of Taq DNA Polymerase (5U/µl Sigma), 1 µl each of both forward and reverse primers (5 pico moles/µl Sigma) and 5 µl of autoclaved sterile distilled water in a total volume of 10 µl. The  amplification was done in a thermal cycler (Eppendorf Vapo protect) under following conditions: an initial denaturation of template DNA at 940C for 3 min followed by 35 cycles of amplification i.e., 1 min denaturation at 940C, 10 min primer annealing at 600C, 2 min primer extension at 720C and 10 min final primer extension at 720C. PCR products were segregated in 1.2 % agarose gel (in 1X TBE electrophoresis buffer) containing 0.5 mg/ml ethidium bromide. Size of the separated PCR products was examined by visualizing under UV light and recorded by gel documentation system (Alpha innotech).

Results

Evaluation of Mannose on Seedling Growth

The results suggest that the growth of seedlings was inhibited from 0.3% until 1.0% concentration of mannose. When mannose was evaluated in combination with sugars, seedling’s growth was not affected till 0.2-0.3% mannose concentration while above that concentration, seedling growth was affected (Fig.1).

Molecular Analysis           

Molecular analysis was performed to detect the presence of PMI gene in the transformed calli through PCR amplification. Using specific primers, we had confirmed the presence of the gene of interest as a 514 bp  amplification product which was visible in the sample numbers 1, 2, 3, 5 and 6 while no amplification was detected in the remaining samples (Fig.3).

Figure 3: Amplification of pmi gene in the transformed plants Figure 3: Amplification of pmi gene in the transformed plants

Click here to View Figure

Discussion                 

In this study, experiments were conducted to study the influence of mannose on the growth of seedlings using various concentrations of mannose starting from 0.2% in combination of other sugars, but seed germination is arrested at 1% mannose concentration and this concentration was employed for the selection. The selection system employed in the study varied from other studies, as most of the researchers have used either sorbitol39 or sucrose40 in addition to mannose for selection, but in doing so, it is difficult to determine the selection concentration of mannose which can restrict the growth of non-transformed cells.

Sucrose in combination with mannose has metabolic advantage where sucrose is readily available in situations where mannose inhibits growth. Hence the combination of both these sugars is utilized in the previous reports41-42, but all the earlier studies focused on precautionary measures to enable transgenic cells to survive on selection medium by addition of metabolisable sugars like sucrose and sorbitol because concentrations of mannose employed in those studies totally depletes the orthophosphate and makes ATP unavailable for the cells to grow, and further growth is retarded. In our study we did not employ any other metabolisable sugars to enhance the growth of transformed cells because this could have drawbacks like production of escapes, but we have utilized low concentrations (1%) of mannose alone per selection and this system worked well as per the growth of callus is concerned (Fig.2) and regeneration and rooting is done on maltose media in accordance with earlier reports. Thus through this study a sugar based positive selection can successfully replace selection using antibiotics which are known to cause environmental problems. The selection system used in this study is optimal for growth of transformed callus and standardized for indica rice cultivar Swarna.

Conclusion

This study holds significance, as it can serve as reference for the standardized protocol while utilizing mannose as selective agent during transformation of indica rice. Specifically, mannose (1%) without any other sugar combination can be effectively utilized during selection and regeneration of transformed calli with phosphomannose isomerase (PMI) system. This positive selection system is advantageous over the negative/antibiotic selection as it does not pose any environmental hazards.

Acknowledgement

The authors are thankful to Director, NRRI for the facilities and encouragement. The first two authors are also thankful to ICAR-NPTC for providing them Senior Research Fellowship.

Conflict of Interest

The authors declare that they have no conflict of interest.

References

  1. James, C. Global status of commercialized biotech/GM crops: (International Service for the Acquisition of Agri-biotech Applications (ISAAA), Ithaca, NY, USA., (2014).
  2. Pontiroli, A., Simonet, P., Frostegard, A., Vogel, T.M., and Monier, J.M. Fate of transgenic plant DNA in the environment. Environ. Biosafety Res., 6: 15–35 (2007).
  3. Rizzi, A., Raddadi, N., Sorlini, C., Nordgrd, L., Nielsen, K.M, and Daffonchio, D. The stability and degradation of dietary DNA in the gastrointestinal tract of mammals: implications for horizontal gene transfer and the biosafety of GMOs. Crit Rev Food Sci Nutr.,52(2):142‐161 (2012).
  4. Chan, M.T., Chang, H.H, Ho, S.L, Tong, W.F, and Yu, S.M. Agrobacterium-mediated production of transgenic rice plants expressing a chimeric alpha-amylase promoter/beta-glucuronidase gene. Plant Mol Biol., 22:491–506 (1993).
  5. Potrykus, I and Spangenberg, G. Gene transfer to plants. Springer-Verlag, Berlin., (1995).
  6. Aldemita, R.R, and Hodges, T.K. Agrobacterium tumefaciens-mediated transformation of japonicaand indica rice varieties. Planta., 199: 612– 617 (1996).
  7. Dong, J.J., Teng, W.M., Wallace, G., and Timothy, C Agrobacterium mediated transformation of javanica rice. Mol Breed., 2:261–276(1996).
  8. Burkhardt, P.K., Beyer, P., Wünn, J., Kloti, A., Armstrong, G.A., Schledz, M., von Lintig, J. and Potrykus, I. Transgenic rice (Oryza sativa) endosperm expressing daffodil (Narcissus pseudonarcissus) phytoene synthase accumulates phytoene, a key intermediate of provitamin A biosynthesis. Plant J., 11: 1071–1078 (1997).
  9. Cheng, X., Sardana, R., Kaplan, H., and Altosaar, I. Agrobacterium-transformed rice plants expressing synthetic cryIA(b) and cryIA(c) genes are highly toxic to striped stem borer and yellow stem borer. Proc Natl Acad Sci., 95: 2767–272(1998).
  10. Haldrup, A., Petersen, S.G, and Okkels, F.T. The xylose isomerase gene from Thermoanaerobacterium thermosulfurogenes allows effective selection of transgenic plant cells using D-xylose as the selection agent. Plant Mol Biol., 37:287–296(1998).
  11. Ye, X., Al-Babili, S., Kloti, A., Zhang, J., Lucca, P., Beyer, P., and Potrykus I. Engineering the provitamin A (beta-carotene) biosynthetic pathway into (carotenoid-free) rice endosperm. Science., 287:303–305 (2000).
  12. Wang, A. S., et al. A mannose selection system for production of fertile transgenic maize plants from protoplasts. Plant Cell Rep.,19: 654–660 (2000).
  13. Kuiper, H.A., Kleter, G. A., Noteborn, H.P.J.M and Kok, E.J. Assessment of the food safety issues related to genetically modified foods. Plant J., 27: 503–528 (2001).
  14. Stewart, C.N., Halfhill, M.D. and Warwick, S.I. Transgene introgression from genetically modified crops to their wild relatives. Nat. Rev. Genet.,4: 806–817(2003).
  15. Nakamura, Y., Itoh, T., Matsuda, H and Gojobori T. Biased biological functions of horizontally transferred genes in prokaryotic genomes. Nat. Genet., 36: 760–766. (2004).
  16. Gadaleta, A., Giancaspro, A., Blechl, A., and Blanco, A. Phosphomannose isomerase, pmi, as a selectable marker gene for durum wheat transformation. Journal of Cereal Science., 43: 31-37 (2006).
  17. Pontiroli Alessandra., Simonet Pascal., Frostegard Asa., Vogel Timothy., and Monier Jean-Michel. Fate of transgenic plant DNA in the environment. Environmental biosafety research., 6: 15-35. (2007).
  18. Ramessar Koreen., Peremarti Ariadna., Gomez-Galera Sonia., Naqvi Shaista., Moralejo Marian., Munoz-Odina Pilar., Capell Teresa and Christou Paul. Biosafety and risk assessment framework for selectable marker genes in transgenic crop plants: A case of the science not supporting the politics. Transgenic research., 16: 261-80 (2007).
  19. Didelot, X and Maiden, M.C.J. Impact of recombination on bacterial evolution. Trends Microbiol.,18: 315–322 (2010).
  20. Kwit, C., Moon, H.S., Warwick, S.I and Stewart, C.N. J. Transgene introgression in crop relatives: molecular evidence and mitigation strategies. Trends Biotechnol., 129: 284–293 (2011).
  21. Nicolia, A., Manzo, A., Veronesi, F and Rosellini, D. An overview of the last 10 years of genetically engineered crop safety research. Crit. Rev. Biotechnol., 34: 77–88 (2014).
  22. da Silva Dias, J.C. Plant breeding for harmony between modern agriculture production and the environment. Agr. Sci., 6: 30 (2015).
  23. Haldrup Anna., Noerremark Michael, and Okkels Finn. Plant selection principle based on xylose isomerase. In Vitro Cellular & Developmental Biology – Plant.,37: 114-119 (2001).
  24. Privalle Laura., Wright Martha., Reed Janet., Hansen Genevieve., Dawson John., Dunder Erik., Chang Yin-Fu., Powell, M and Meghji, Moez. Phosphomannose Isomerase, A Novel Selectable Plant Selection System: Mode of Action and Safety Assessment. Ann. NY Acad. Sci., 964: 129–138 (2002).
  25. Joersbo, M., Jorgensen, K., and Brunstedt, J. A selection system for transgenic plants based on galactose as selective agent and a UDP-glucose: galactose-1-phosphate uridyltransferase gene as selective gene. Mol Breed., 11: 315–323 (2003).
  26. Miles, J.S and Guest, J.R Nucleotide sequence and transcriptional start point of the phosphomannose isomerase gene (manA) of Escherichia coli. Gene., 32: 41–48 (1984).
  27. Ferguson, J.D., Street, B.E, and David, S.B. The carbohydrate nutrition of tomato roots. Annals of Botany., 22: 525–538 (1958).
  28. Goldsworthy, A and Street, H.E. The carbohydrate nutrition of tomato roots: VIII. The mechanism of the inhibition by D-Mannose of the respiration of excised roots. Ann. Bot.-London., 29: 45–58 (1965).
  29. Malca, I., Endo, R.M, and Long, M.R. Mechanism of glucose counteraction of inhibition of root elongation by galactose, mannose and glucosamine. Phytopathology., 57: 272–278 (1967)
  30. Sheu-Hwa, C.S., Lewis, D.H., and Walker, D. A. Stimulation of photosynthetic starch formation by sequestration of cytoplasmic orthophosphate. New Phytologist., 74: 383- 392 (1975)
  31. Joersbo, M., Petersen, S.G, and Okkels, F.T. Parameters inter-acting with mannose selection employed for the production of transgenic sugar beet. Plant Physiology.,105: 109-116 (1999)
  32. Baisakh, N., Datta, K., Oliva, N., Ona, I., Rao, G.J.N., Mew, T.W, and Datta, S.K. Rapid development of homozygous transgenic rice using anther culture harboring rice chitinase gene for enhanced sheath blight resistance. Plant Biotechnology., 18: 101-108 (2001)
  33. Rao, V.R., Reddy, P.S., Murthy, N., Rao, I., Rao, P.S., Rao, C.B., Rao, G.M. Swarna (MTU 7029)–a new stable hybrid with wide adaptation. Oryza., 20:240–242 (1983)
  34. Vijayachandra, K., Palanichelvam, K., and Veluthambi, K. Rice scutellum induces Agrobacterium tumefaciens vir genes and T-strand generation. Plant Molecular Biology., 29: 125–133 (1995)
  35. Murashige, T., and Skoog, F. A. revised medium for rapid growth and bioassays with tobacco tissue cultures. Plant physiology., 15: 473-497 (1962)
  36. Saikrishna, R., Chaitanya, K.G and Rao, G.J.N. Efficacy of different transformation methods in rice (Oryza sativa ). Journal of Experimental Biology and Agricultural Sciences 1: (2S).,106-110 (2013).
  37. Repalli, S.K., Geda, C.K, and Rao, G.J.N. MMT, a High Promising, Cost Effective Micro-carrier for Gene Delivery. J Microb Biochem Technol.,11: 417(2019).
  38. Dellaporta, S.L, Wood, J, and Hicks, J.B. A plant DNA mini preparation: Version II. Plant Mol Biol Rep.,14:19-21 (1983).
  39. Juliana, D., Annika, P., Jurith, M., and Iris, S. The use of the phosphomannose-isomerase/mannose selection system to recover transgenic apple plants. Plant Cell Reports., 25:1149-1156 (2006).
  40. Lucca, P., Ye, X., and Potrykus I. Effective selection and regeneration of transgenic rice plants with mannose as selective agent. Molecular Breeding.,7:43–49 (2001)
  41. Joersbo, M., Donaldson, I., Kreiberg, J., Petersen, S.G., Brunstedt, J., and Okkels, F.T Analysis of mannose selection used for trans­formation of sugar beet. Molecular Breeding., 4: 111-117 (1998).
  42. Suprasanna, P., Manjunatha, B.R., and Bapat, V.A. Mannose based selection with phosphomannose isomerase (PMI) gene as a positive selectable marker for Rice genetic transformation. Journal of Crop Scienceand , 11 (4): 233-236. (2008).

Food Texture and Its Perception, Acceptance and Evaluation

$
0
0

Texture and Its Perception

Texture of food is based on multi parameters; some parameters were governed when food placed inside the mouth while most of them perceived when food gets deformed during mastication and detected through several senses. There is no single and specific receptor which governs the evaluation of texture of food instead there are many receptors and tissues come in to action.1 Texture perception is dynamic and complex process where the food gets manipulated under the forces to get fractured.2 Textural perception of food can be estimated with the help of mastication based on physiological techniques.3, 4

Texture evaluation depends on subject’s capability to analyze and explain their perceptions. Human perception of food texture is depending on three parameters visual, tactile and auditory. Visual parameter depends on previous experiences with same foods, tactile parameters depends on oral (mouth feel) and hand tactile texture perception and auditory parameter depend on food sounds. Acoustic signals related to food texture like low pitch sound correlated with crunchiness while high pitch sound correlated with crispiness.5 Mechanical parameters which are not perceptible by human sense organs are not play an important role in texture perception.6

Texture of food generates a psychological response which governs the quality and acceptability of the food. Texture perception depends on the physical properties of food i.e. its nature, composition and also on the rate of food deformation in mouth.7 Four major senses play an important role in perception of texture like discriminative touch for recognize different shape, size and texture of food, the sense of static position or movement of jaw, the sense of pain and the sensation of cold and warmth.2

Texture perception is also explained on the basis of neurological manner in which sensory and motor components of peripheral nervous system interacts with the central nervous system.2 The coordination between motor components is highly required so that all muscle action can be controlled as single unit.8 The term “Gestalt” defined as perception regard texture of food as a whole developed by the integration of different stimulus generated by various sense organs. The presence of one stimulus may affect the perception of another stimulus. The sensory perception and its nature may be varied from the physical properties of food and integration of all perception is subconscious.9

The internal characteristics of food are correlated with sensory perceptions.10 During the perception of sensory analysis, it is to be assumed that different information regard texture may be gathered due to differences in the manner in which interaction of food occurred.11 Sensory mechanoreceptors which perceive texture and mouth feel are grouped under three categories. First in the superficial structures of mouth, second in the periodontal membrane surrounding teeth roots and third in the tendon and muscles which are involved in mastication.2 Earlier the sensory perception of texture of food was governed by their rheological characteristics,12 by the force of mastication measured using miniature load cells placed inside mouth during chewing of food.13

Eating situation also influence the texture acceptance and preference.14 Texture tolerance is defined as how far textural behavior of a food deviates from its expectation. It is depending on the category of food, on the particular food and on dominant characteristics of food. Some food has more texture tolerance then other foods. During breakfast less texture tolerance was found as food which serve during breakfast is the one which get easily lubricated with saliva, manipulate easily inside mouth and make a bolus for its easy swallowing and digestion. During dinner food is enjoyed and appreciated. So that most of the experiment with new texture are performed while serving dinner. During dinner more texture tolerance was found as dinner consist of many food items and there is no fear of going hungry if any particular food item is disliked. Dessert in the dinner explained the fun behavioral of textural characteristics.1

Texture and Its Relation to Consumer Behaviour and Acceptance

There are various factors like social, cultural, physiological and psychological which governed the attitudes to texture.14 Lower socio economic classes are very conscious about their look while eating food and thus bring with negative attitude. Unsatisfied past experience also bring about rejection of texture of food. Learning of textured of food is a continuous process.1

Texture parameters are associated with liking and disliking characters based on physiological and cultural characters. Various liked and disliked characteristics were used during explanation of food texture like crisp and tough; crunchy and soggy; tender and lumpy; juicy and crumbly; firm and slimy.14 Textural contrast also plays an important role in the acceptance of food based on the eating experience and excellence of food preparation.1

Different countries use different textural characteristics for food like Japan uses crispy, crunchy, hard, soft and sticky food while Americans uses crispiness, crunchiness, tenderness, juiciness and firmness.14 The image of the food product reflects its food properties. Foods with soothing and relaxing to the human and creamy while food product with energy and aggressiveness should be firm and crispy. The size of serve also affects the textural perception of food.1 On psychological basis if the appearance of food product is not met with expectation or with the past experience, food is generally rejected. Gummy or slimy food with hard particles or lumps is generally rejected.

The acceptance of food by the consumer is dependent on the rheology and texture of food.15 Food texture is one of the dominant factors which affect the food choice.14 Food texture is an important factor for food palatability and thus affects food eating behavior.16 Food texture is defined as the combined sensation derived from various receptors present inside the mouth after taking the food and its relate to the physical properties of food sample like density, viscosity and surface tension etc.17

Texture is one of the important parameter of sensory evaluation. Texture cannot be treated as absence of defect while it should be treated as attribute of freshness, excellence of food preparation and enjoyment of eating1 Texture governs the palatability, quality and safety of food.18 Texture of food also used as an indicator for quality parameter. For example, freshness of food is governed by its texture.

Food texture and mouthful are the two important characteristics for consumer food preference and acceptance.2 To maintain the quality of food and consumer acceptance food industries must examine textural characteristics of their food products.19 Texture of food is generally taken for granted and consumer does not comment on it unless they were asked with specific questions regard texture of food. The acceptance of food on the basis of its textured depends not only on the consumer but also on the food properties and eating behavior. Consumer does not pay so much attention on the food for its sensory and nutritional returns until the food yield pleasant flavor.20

On the basis of consumer texture profile, ideal textural characteristics of food are determined. The deviation of the test food from the target food is calculated for determining the ideal texture. The difference among them explains the area of improvement. Closer to the ideal point explain increase the degree of liking of food. Thus textural parameters correlate with bad and good identify compare to the ideal; make negative and positive impact on acceptance of food.

Figure 1: Concept of Food Texture. Figure 1: Concept of Food Texture.

Click here to View Figure


Parameters Used During Food Texture Evaluation

Texture is used for solid and semisolid food while mouth feel is used for describing the feeling properties of food inside the mouth. Food texture is governed by mechanical, geometrical and others surface properties which are perceive by means of various receptors 21. Mechanical characteristics were explained in terms of physical and sensory manner as shown in Table 1 and Table 2.

Table 1: Various parameter of texture based on physical manner (Szczesniak, 2002).1

S.NO PARAMEER                                  DEFINATION
1 Hardness As the force required for breaking of food sample into many small pieces by molar teeth during first bite which can vary from soft, firm to hard.
2 Adhesiveness As the force which is required to reduce the adherence between the food material and the surface with which it is in contact. On the basis of adhesiveness food can be sticky or tacky gooey.
3 Cohesiveness As the limit to which a given food sample deformed before it breaks.
4 Springiness As the rate at which the deformed food material gets back in to its original condition when the applied force is removed from them. On this basis food can be divided in to two categories i.e. plastic and elastic.
5 Gumminess As the amount of energy which is required for the disintegration a food sample which is semi solid in nature for its swallowing. Its value classified as short, mealy and pasty gummy.
6 Brittleness As the force which is required by the food material for its fracture. It is also called brittleness, which can be varied from crumbly, crunchy to brittle.
7 Chewiness As the amount of energy which is required for the chewing of solid food for its swallowing. On the basis of chewiness food can be classified in to Tender, chewy and tough.


Table 2: Various parameter of texture based on sensory manner (Szczesniak, 2002).1

S.NO PARAMETER DEFINATION
1 Hardness As the force between tongue and palate for compression of a food sample,
2 Viscosity As the force which is required to draw liquid from a spoon over the tongue. On the nature of food, it can be varying from thin to viscous.
3 Adhesiveness As the force required for removing the adhesive food material adhere to the mouth.
4 Cohesiveness As the extent up to which food sample compressed between the teeth before it ruptures.
5 Springiness As a level up to which food get back in to its original shape,
6 Gumminess As denseness of the food product which remains exist throughout the process of chewing.
7 Brittleness As the force with which food get cracks.
8 Chewiness As the time required for the chewing of food under the effect of constant force.


Geometrical characteristics are further classified on the basis of particle size (griffty, grainy, coarse) and shape (fibrous, cellular, crystalline) while other characteristics are further classified in to primary parameters i.e. moisture (dry, moist, wet and watery), fat content and secondary parameters like oiliness and greasiness.1

Mouthfeel textural parameters like astringency and juiciness play a significant role in textural characterization of liquid beverages.22 Astringency is the tactile sensation 23 associated with ability of certain chemical to bind and precipitate salivary mucus proteins that lubricate mouth.24 During mastication the amount of juice which is released from food is described as juiciness.

Texture Evaluation

Texture Profile Analysis

For qualitative and quantitative analysis of food, texture should be studied in depth using the application of imaging and simulation techniques. The role of computer makes a significant advance in this research area. Texture Profile Analysis (TPA) is one of the instrumental methods25 which are basic and simple thus used for the evaluation of food texture based on the mechanical attributes of the food product. Texture profile method test the food sample twice under the compression and then record the force deformation curves. Textural profile method classified the textural attributes in to initial, masticatory and residual part.26 Texture analyzer test these attributes by applying controlled forces to the food products and record their responses in the terms of force, deformation and time.

This method has certain disadvantages like this method could not be used for texture analysis heterogeneous foods. It does not mimic the in vivo conditions of the mouth i.e. it does not consider the effect of saliva and temperature of the mouth on texture of food. TPA also does not include the psychological, physiological and environmental attributes while determining the texture of foods and moreover this method gives information regarding texture of food before its consumption. Instrumental methods which are used for accessing the texture of food not mimic the rate of deformation (force), dynamic of oral movement, salivary action and thus give low rate of correlation with subjective analysis as each subject used different parameters for governing the texture assessment.27 Instrumental methods not represent the actual state of mastication.28

The complex mechanism of rate of deformation of food inside mouth cannot be estimated by single mechanical based instrumental method.29 Instrumental analysis of texture also operates at low rate of deformation as compare to force that present in human mouth.30 Instrument use single measurement for examine texture of food while texture should be assessed progressively during chewing.31 Most of the information regard tenderness was governed by first bite but there are evidences which states that more than first bite is required for examine the tenderness of meat.28

Sensory Profile Analysis

During the sensory analysis, texture perception is one of the important factors. Sensory analysis method is used for determining food texture on the basis of some standard scales32 and also on the selection of panel members.33

Earlier the sensory perception of texture of food was governed by their rheological characteristics,12 by the force of mastication measured using miniature load cells placed inside mouth during chewing of food.13

The internal characteristics of food are correlated with sensory perceptions.34, 35 During the perception of sensory analysis it is to be assumed that different information regard texture may be gathered due to differences in the manner in which interaction of food occurred.36 Both instrumental as well as sensory method now move from single point analysis to multipoint as many attributes are quantified at a same time.37 Multiple sensory attributes are used for the characterization of mastication.38

Individual sensory analysis of food is one of the biggest problems in the sensory scientist community. Variation in sensory perception can be due to difference in the genetic makeup of an individual for sensory receptors, sensory experience to discriminate between stimuli, the way used to describe or define different sensory sensation parameters and sensory reporting.11 This method has certain disadvantages like it is a time consuming procedure, trained panelists are required, the results can be biased, affected by ill health of judge panelist and moreover this method gives information regarding texture after consumption of the food.

To avoid such variation numerous techniques are used like screening of human subjects, training of panelist, use of standardized methodology for examine sensory parameters and testing with specific sensory test.33 Sensory evaluation and consumer testing is one of the reliable methodology used for examine food texture.

Electromyography (EMG)

EMG is a technique which is based on calculation of muscle activity required during chewing of food.39 EMG measures the action potential of the motor unit of masticatory muscle when they undergo contraction. EMG method uses myoelectric potential from the skin surface of human subjects and relates it with muscle activity. EMG examined for human mastication is combined action of physical and psychological studies.40, 41

EMG is a non-invasive technique which does not interferes with normal habitual chewing.42, 43 EMG is a technique which is used for evaluation of texture of food in mouth. EMG is a novel method to investigate the changes in texture during eating of food. EMG studied dynamic changes in food during the process of mastication. Thus it is complement to texture measurement.

The differences in the signals which were generated during chewing of food were used for the assessment of texture. EMG is a technique which is used to show the differences in the pattern for chewing food which differ in their textural characteristics.44, 45 This technique is also being used for differentiating the chewing pattern between individuals.19, 46, 47

EMG analysis gives better result for texture perception than instrumental method as this method brings information from mastication rhythm which showed differences among different human subjects.48, 49 EMG is one of the repeatable techniques if homogenized conditions are maintained like by standardization of the applied methodology and analysis.50, 51

Table 3: Various definition of Food Texture

S.NO DEFINATIONS AUTHORS
1 Texture was defined as all of the mechanical, geometrical, surface and body attributes of a product perceptible by means of kinaesthesis and somesthesis receptors and (where appropriate) visual and auditory receptors from the first bite to final swallowing. ISO, 2008. 52
2 Texture was defined as mechanical, geometrical and surface characteristics which are perceive through various sense organs. Bourne, 2002. 53


3 Texture was explained in terms of physiological texture and mouth feel perception. Guinard & Mazzucchelli, 1996. 2
4 Texture was defined as a sensory perception of food structure which changes due to the action of applied forces along the presence of senses like vision, hearing and kinaesthesia. Szczesniak, 1990.9
5 Texture was described as changes which were observed in terms of sensory and functional attributes due to mechanical and structural manifestation in food properties. Szczesniak, 1963. 25
6 Food texture is a response which is generated due to interaction of the food with some part of the body. Bourne, 1975. 54
7 Texture was described as combined effect of psychology and physiology. Brown et al., 1996. 11


Discussion and Conclusion

Texture perception is a complex process which is based on stimulus of various sense organs. Food texture plays an important role in the acceptance of the food by the consumers. Food industries always expand their knowledge for examine the texture attributes of foods. Thus there is a need of a novel technique for texture evaluation of various foods based on in-vivo conditions i.e. the one which can give information regarding texture of food within the mouth during chewing start from the first bite to final swallowing. Accordingly, the developed technique Electromyography will be in lines with the latest definition of texture as described by International Organization for standardization.

Acknowledgement

I would like to thank Dr. Navdeep Singh Sodhi and Dr. Bhavnita Dhillon for discussions regarding to improve this review.

Conflict of Interest

The author brings in to your knowledge that there is no conflict regarding publication for this research paper.

Funding Sources

This study is supported by UGC Major Research Project Grant (MRP-MAJ-HOME-2013-862).

References

  1. Szczesniak AS. Texture is a Sensory Property. Journal of Food Quality and Preference. 2002; 13(4): 215-225.
  2. Guinard JX, Mazzucchelli R. The Sensory Perception of Texture and mouthfeel. Trends in Food Science and Technology. 1996; 7(7): 213-219.
  3. Chen J. Food Oral Processing – A Review. Journal of Food Hydrocolloids. 2009; 23(1): 1-25.
  4. Morell P, Hernando I, Fiszman SM. Understanding the relevance of in-mouth food processing. A review of in vitro techniques. Trends in Food Science & Technology.2013; 35(1), 18-31.
  5. Jessop B, Sider K, Lee T, Mittal GS. Feasibility of the acoustic/EMG system for the analysis of Instrumental food texture. International Journal of Food Properties. 2006; 9(2): 273-285.
  6. Kohyama K, Hanyu T, Hayakawa F, Sasaki T. Electromyographic measurement of eating behavior for buckwheat noodles. BioscienceBiotechnology and Biochemistry. 2010; 74(1): 56-62.
  7. Mathoniere C, Mioche L, Dransfield E, Culioli J. Meat texture characterisation: comparison of chewing patterns, sensory and mechanical measures. J. Texture Studies. 2000; 31, 183-203.
  8. Gorden J. ‘Spinal mechanism of motor coordination’. Principles of Neural Science. 1991; 581-595.
  9. Szczesnaik AS. Psychorheology and texture as factors controlling the consumer acceptance of food. Cereal Food World. 1990; 35(12): 1201-1204.
  10. Mioche L, Martin JF. Training and sensory judgement effects on mastication as studied by electromyography. J. Food Science. 1998; 63(1): 1-5.
  11. Brown WE, Langley KR, Mioche L, Marie S, Gerault S, Braxton D. Individuality of understanding and assessment of sensory attributes of foods, in particular, tenderness of meat. Journal of Food Quality and Preferences. 1996; 7(3,4): 205-216.
  12. Scott BGW, Coppen FM. The subjective judgement of the elastic and plastic properties of soft bodies the “Differential Thresholds” for Viscosities and Compression Moduli. British Journal of Psychology. 1939; 128(850): 109-125.
  13. Boyar MM, Kilcast D. Food texture and dental science. Journal of Texture Studies. 1986; 17(3): 221-252.
  14. Szczesnaik AS, Kahn, EE. Texture contrast and combinations: a valued consumer attributes. Journal of Texture Studies. 1971; 15(3), 280-295.
  15. Szczesnaik AS. Sensory texture profiling. Historical and scientific perspectives. Food Technology, 1998; 52(8): 54-57.
  16. Kohyama K, Sodhi NS, Suzuki K, Sasaki T. Texture Evaluation of Cooked Rice Prepared From Japanese Cultivars using Two-Bite Instrumental Test and Electromyography. J. Texture Studies. 2016; 47(3),188-198.
  17. Matz SA. Food texture. AVI Publication. 1962.
  18. Nishinari K. Texture and rheology in food and health. Food Science & Technology Research. 2009; 15(9): 99-106.
  19. Brown WE. Method to investigate differences in chewing behaviour in humans: I Use of electromyography in measuring chewing. Journal of Texture Studies. 1994; 25(1): 1-16.
  20. Munoz AM, Civille GV. Factors affecting perception and acceptance of food texture by American consumers. Food Review International. 1987; 3(3): 285-322.
  21. Kohyama K, Sasaki T, Hayakawa F, Hatakeyama E. Effects of cross sectional area on human bite studied with raw carrot and surimi gel. J. Bioscience, Biotechnology, and Biochemistry. 2004; 68(10): 2104-2110.
  22. Langstaff SA, Guinard JX, Lewis MJ. Sensory evaluation of the mouthfeel of the Beer. J. Am. Soc. Brew. Chem, 1991; 49(2): 54-59.
  23. Green BG. Oral astringency: a tactile component of flavour. Acta Psychologica. 1993; 84(1): 119-125.
  24. Guinard JX, Pangborn RM, Lewis MJ. The time course of astringency in wine upon repeated ingestion. The AmericanJournal of Enology and Viticulture. 1986; 37(3): 184-189.
  25. Szczesnaik AS. Classification of textural characteristics. Journal of food Science. 1963; 28(4): 385-389.
  26. Brandt MA, Skinner EZ. Coleman JA. Texture profile method. Journal of Food Science. 1963; 28(4), 404-409.
  27. Mioche L, Peyron MA. Bite force displayed during assessment of hardness in various texture contexts. Archives of Oral Biology. 1994; 40(5): 415-423.
  28. Duizer LM, Gullett EA, Fndlay CJ. The relationship between Sensory Time intensity, Physiological Electromyography and Instrumental Texture Profile Analysis Measurements of Beef Tenderness. Journal of Meat Science. 1996; 42(2): 215-224.
  29. Dransfield E. Instrumental measurement of meat. Meat Quality and Meat Packaging, Taylor, S. A. et al. Ed. 1996; 195-219.
  30. Shama F, Sherman P. Identification of stimuli controlling the sensory evaluation of viscosity II. Oral methods. Journal of Texture Studies. 1973; 4(1): 111-118.
  31. Kapsalis G, Moskowitz HR. Views on relating instrumental tests to sensory assessment of food texture. Applications to product development and improvement. Journal of Texture Studies. 1978; 9(4): 371-393.
  32. Szczesniak AS, Brandt MA, Friedman H. Development of standard rating scales for mechanical parameters of texture and correlation between the objective and sensory methods of texture evaluation. Journal of Food Science. 1963; 28(4): 397-403.
  33. Civille GV, Szczesnaik AS. Guidelines to training a texture profile panel. Journal of Texture Studies. 1973; 4, 204-223.
  34. Christensen CM. Food texture perception. Advance Food Research. 1984; 29, 159-199.
  35. Heath MR, Lucas PW. Oral perception of texture. Food structure, its creation and evaluation. Blanchard, J. M. V & Mitchell, JR. Edition, 1987; 465-481.
  36. Daget NMT, Brown, WE, Mela DJ. Inter-individual differences in intensity of perception of chocolate flavour during eating time. Abstract ECRO meeting autumn. 1994
  37. Szczesnaik AS. Correlation between objective and sensory texture measurements. Food Technology, 1968; 49-51, 53-54.
  38. Civille GV, Liska IH. Modifications and applications to foods of the general foods sensory texture profile technique. Journal of Texture Studies. 1975; 6(1): 19-31.
  39. Karlsson S, Carlsson GE. Characteristics of mandibular masticatory movement in young and elderly dentate subjects. Journal of Dental Research. 1990; 69(2): 473-476.
  40. Kohyama K, Sodhi NS, Sasaki T, Suzuki K. Texture evaluation of cooked rice prepared from Japanese cultivars using two-bite instrumental test and electromyography. Journal of Texture Studies. 2016; 47(3): 188-198.
  41. Wilkinson C, Dijksterhuis GB, Minekus M. From food structure to texture. Trends Food Science and Technology. 2000; 11(12): 442-450.
  42. Gonzalez R, Montoya I, Carcel J. Review: the use of electromyography on food texture assessment. Food Science Technology International. 2001; 7(6): 461-471.
  43. Kohyama K, Sodhi NS, Sasaki T, Suzuki K. Effects of milling ratio and water-to-rice ratio on mastication effort for cooked rice measured by electromyography. Journal of Texture Studies. 2014; 45(6): 477-486.
  44. Sakamoto H, Harada T, Mataukubo T, Takaesu Y, Tazaki M. Electromyographic measurement of textural changes of foodstuffs during chewing. Agriculturaland Biological Chemistry. 1989; 53(9): 2421-2433.
  45. Pratiksha, Sodhi NS, Dhillon B, Kaur T. Association between electromyography (EMG) variables during mastication by human subjects and food texture perceptions: a study on different snacks (gajaks, biscuits and chocolates). International Archive of Applied Sciences and Technology. 2018; 9(1): 33-42.
  46. Brown W, Langley KR, Martin A, Macfie HJH. Characterisation of patterns of chewing behaviour in human subjects and their influence on texture perception. Journal of Texture Studies. 1994; 25(4): 455-468.
  47. Rustagi S, Sodhi NS, Dhillon, B. A study to investigate reproducibility of chewing behaviour of human subjects within session recordings for different textured Indian foods using electromyography. The Pharma Innovation. 2018; 7(5): 5-9.
  48. Kohyama K, Ohtsubo K, Toyoshima H. Electromyographic studies on cooked rice with different amylose content. Journal of Texture Studies. 1998; 29(1): 101-113.
  49. Rustagi S, Sodhi NS, Dhillon, B. Analysis of Masseter muscle activities acquired by Surface Electromyography for different textured Indian food products. International Archive of Applied Sciences and Technology. 2018; 9(2): 51-57.
  50. Kossioni AE, Karkazis HC. Reproducibility of the human masseteric jaw-jerk reflex in association with the menstrual cycle. Journal of Archives of Oral Biology. 1993; 38(12): 1099-1105.
  51. Sodhi NS, Singh B. and Dhillon B, Kaur T. Application of electromyography (EMG) in food texture evaluation of different Indian sweets. Asian Journal of Dairy and Food Research. 2019; 38(1): 41-48.
  52. ISO. Sensory analysis-Vocabulary. 5492:2008 (en). https://www.iso.org/obp/ui/#5492:ed-2:v1:en. 2008.
  53. Bourne MC. Principles of objective texture measurement. MC. Bourne Ed. Food texture and viscosity: concept and measurement, New York: Academic Press; 2002, 107-188.
  54. Bourne MC. Is rheology enough for food texture measurement. Journal of Texture Studies. 1975; 6(2), 259-262.

Dengue Vector Control: A Review for Wolbachia-Based Strategies

$
0
0

Introduction

Global incidences of mosquito-borne diseases are growing up due to people travel, fast urbanization and ineffective of control programs measures.1 Dengue fever (DENV) is the most serious arboviral epidemic threatening humanity and it is responsible of death cases in the tropical and subtropical regions. About 50 % of the inhabitants across the world are now at dengue risk. Official reports estimated around 390 million person are infected annually, half million of them are critical situations and require hospital treatment. About of 2.5 % of those infected cases die. Although several countries used vaccine against DENV in humans ranged between 9 and 45 years of age inhabiting in endemic areas, but the mosquito control is still the main approach to stop the dengue disease.2  A. aegypti mosquito is the main vector of Dengue, Zika, chikungunya and yellow fever diseases, also A. albopictus is a possible transmitter. A. aegypti mosquito is well adapted to mankind. The mosquito females obtain blood meals by biting and digestive it inside their bodies to produce their eggs. Unfortunately, the elimination of A. aegypti is not easy task due to their ability to lay the eggs in many sites included those of a little amount of water. Also the eggs able to stay alive months in the absence of water and hatch as soon as water is available. Moreover they have resistance to common insecticides.3,4  All these conditions make the eradication of A. aegypti by traditional techniques useless.5 The use of insecticides can be effective on mosquito control program, but it is often prohibitively, highly cost, harmful on non-target organisms, has negative environmentally effects. Furthermore, the long term use of insecticides led mosquitoes to develop resistance against insecticides.6,7 Alternative methods were used to mosquitoes management such as the elimination of eggs laying sites, the using of animals that naturally preys on mosquitoes like copepods and fish8 and avoid mosquito bites by protection tools. These strategies are considered beneficial way in some cases but it can be difficult and high cost to apply in urban areas. Accordingly, Novel arbovirus vector control tools are needed. Currently, two novel techniques revealed promise in reducing the dengue transmission.9 The first one depends on is a genetic management by spread mosquitoes that are treated with lethal or flightless trait10 and the second technique is establishment of mosquitoes carrying Wolbachia bacterium. Wolbachia block and prevent the growth of the dengue virus inside A. agypti mosquitoes.11,12 In this technique, the Wolbachia-infected mosquitoes are released into the wild. Because of cytoplasmic incompatibility (CI), the wolbachia are passed on through generations of mosquitoes and the ratio of Wolbachia-infected mosquitoes is growing up until it become high and predominance without any additional releases. This strategy is applied in several countries.13,14,15

What is Wolbachia?

Wolbachia is considered type of Gram-negative bacterium fall under the order Rickettsiales and the family Anaplasmataceaet (Table 1). This type of bacterium are naturally available in invertebrates and infect about 60% of insect community.11 However, Wolbachia is naturally absent from A. aegypti mosquito, the main transmitter responsible for the spread of human diseases including dengue and other diseases of RNA-virus. Wolbachia has the ability to prevent the growth of several of RNA-viruses in mosquitoes and Drosophila. If infected or uninfected males fertilize wolbachia-possitive females, the resulting generations will be healthy and carrying Wolbachia and are expanded in the wild population. Otherwise if infected males fertilize uninfected females, the resulting offspring could not developed. This event is named by the term of  ̋cytoplasmic incompatibility̏ (CI). Meanwhile, Wolbachia-positive mosquitoes produce less eggs and reduce mosquito lifespan.

In general, the Wolbachia species are named based on the source where they first discovered.  For example, Wolbachia pipientis (wPip) strain was isolated for the first time from Culex pipiens mosquito. Also, wMel species from the fruit fly Drosophila melanogaster, while wAlb species isolated from the mosquito Aedes albopictus. Scientists have revealed that Wolbachia stimulate the resistance of arthropods against viruses and inhibit their reproductive ability inside the host. Recently, Australian researchers of the control program showed  of dengue have showed that the expand of wolbachia into wild mosquitoes A. aegypti populations is considered promising technique to overcome the dengue virus transmission. This led WHO and health authorities to encourage use Wolbachia approach as a way to overcome the transmission of dengue and arboviral diseases.12

Table 1: Taxonomy of Wolbachia and Aedes Aegypti

Name Taxon Name Taxon
Aedes Aegypti Wolbachia
Animalia kingdom Bacteria Domain
Arthropoda phylum Proteobacteria Phylum
Insecta Class Alphaproteobacteria Class
Diptera Order Rickettsidae Subclass
Culicoidae Superfamily Rickettsiales Order
Culicidae Meigen, 1818 Family Rickettsiaceae Family
Culex, Aedes, Anopheles, etc Genus (112) Wolbachia Genus
Aedes aegypti Linnaeus, 1762 Species Wolbachia pipientis, Hertig 1936 Species

Wolbachia strategy provides eco-friendly and a safe alternative to insecticide use. Although Wolbachia-infected A. aegypti were originally developed for biocontrol of dengue, it may able to reduce the transmission of other mosquito-borne diseases including chikungunya and yellow fever,16 potentially malaria17,18 and Zika.19

Potential Risk of Wolbachia-Infected Mosquitoes on Human

There is no evidence indicate that wolbachia transfer to human or to the mosquito predators such as geckos and spiders. No antigenic or immune response developed by mosquitoes bites.20 The Australian Commonwealth Scientific Organization produced a risk assessment of releasing Wolbachia in the wild [21] before the official authorities granted the acceptance.13

It is worth noting that the Wolbachia does not horizontally transfer to other organisms. Potentially, there is horizontally transfer of Wolbachia DNA into mosquito genomes, but this situation of transfer happen rarely.22,23,24,25 Such lateral transfer are unlikely to raise the risk related with the Wolbachia-positive mosquitoes release. Wolbachia-based biocontrol holds the promise of an environmentally and safe alternative that is not expensive to implement and has the chance to be effective on a global scale.

Biocontrol of Dengue Virus Using Wolbachia Strategy

Recently, the wolbachia has been studied by several researchers for its potential to use as a biocontrol strategy of Aedes mosquito.26 Laven (1967) was the first researcher started the use of Wolbachia-infected Cx. pipiens mosquitoes to eliminate the the population of mosquito Culex pipiens through cytoplasmic incompatability (CI).27  CI is a phenomenon occurs when wolbachia-infected males are mating with uninfected females and the resulting offspring can not develop. In contrast, when both Wolbachia-positive male and female are mating, the offspring will hatch and develop normally.28

Wolachia release was done in Yorkeys Knob and Gordonvale, Australia, in early January 2011, as first trial sites, both wMel-positive females and males of A. aegypti were weekly released for a totally of ten weeks.

After five weeks-post finishing release, A. aegypti mosquitoes were Wolbachia positive with the percentage of 100 % and 90 % in Yorkeys Knob and Gordonvale, respectively.

Second release was in January 2012 by wMelPop-infected A. aegypti in both Machans Beach and Babinda areas. A promising proportion of wMelPop-positive A. aegypti was reported (with 49% and 75%, respectively) in the wild population during 2–3 weeks after the release start. However, one month post-finishing release, the proportions of wMelPop-infected A. aegypti decreased to less than 50 and 71 % in both Machans Beach and Babinda, respectively. This is may be attributed to inability of that Wolbachia strain to keep themselves for a long time in the field.29

Releases of wAlbB-infected Ae. Aegypti mosquitoes were done in greater Kuala Lumpur, Malaysia, including 6 diverse sites with high dengue cases. The wolbachia strain was established successfully with very high population frequency at some sites and fluctuations at other sites which were supported by additional releases. Based on the monitoring of the situation and compared to control sites, decrease in human dengue cases was observed in the release sites. The wAlbB strain of Wolbachia offers a promising strategy as a tool for dengue control, especially in very hot weather.30

Durovni et al., 2019 described study for evaluating the impact of wide-scale Wolbachia releases on the control of dengue, chikungunya and Zika in Brazil. The study is in progress and the monitoring and data analysis will continue until 2023. In case of success, the experiment will be expanded nationally and regionally. Releases programs of mosquito carrying Wolbachia are implemented or still in progress in 8 countries, fortunately no record of dengue, chikungunya and zika cases in areas where wide spread of Wolbachia-infected mosquitoes are established.31

Adekunle et al., 2019 described a dynamic model adjusting for deficient vertically transmission and decline of Wolbachia infection. This model shows clearly that the disadvantages of CI could outweigh the advantages and the Wolbachia may be lost.  They set the optimal release strategy that determines the ability of Wolbachia for invasion and also, they deduced locally and globally stability of the equilibrium points.32

Mathematical modelling represents a significant tool to understand the effect of factors in infectious diseases dynamics and help in making decisions regarding the implementation of control programs.33 These models simulate the invasion of Wolbachia-infected A. aegypti into wild mosquito populations. 34,35,36 CI represents important factor on the replacement between Wolbachia-uninfected and Wolbachia-infected mosquitoes populations.37 Ndii et al. described a model for the competition between both infected and infected mosquitoe populations and demonstrated the main factors that control on this competition.38 Xue et al. developed the same model as Ndii et al and sex type is incorporated into the model and demonstrated that successful establishment of infected populations need releasing high amount of mosquitoes carrying Wolbachia.39 Mathematical equations were used to develop model for the mosquito contests between wolbachia-positive and wolbachia-negative ones, Zheng et al. demonstrated that the succeeded alteration of wolbachia-negative mosquitoes by positive ones need a careful release strategy and Wolbachia strain play role in this task.36 Qu et al. developed a model of designed release methods and extend the model to include the idea that mosquito female mate once.40 The model by Li and Liu was designed and took in consideration the combined variables of birth-rate, mortality rate, wolbachia type and the amount of wolbachia-infected mosquitoes released.41

OReilly et al. used different models to evaluate the negative consequences of dengue in Indonesia. They expect that Wolbachia technique can avoid up to 75 % of disease consequences in the country. Area-wide interventions such as wolbachia can display an effective way to protect humans more than individually measures, such as vaccinations, in such huge population density.42 Finally, all above mentioned models support the approach of ability of Wolbachia-infected mosquitos to replace the uninfected ones in wild populations

Novel Wolbachia Strains in Anopheles Malaria Vectors from Sub-Saharan Africa

Malaria is mosquito-borne disease and transmit to human by some Anopheles mosquito species. Historically, anopheles genus has been considered Wolbachia-free but has recently discovered in 5 Anopheles species in west Africa, Anopheles coluzzii, Anopheles gambiae, Anopheles arabiensis, Anopheles moucheti and Anopheles species A. These novel strains of Wolbachia have possibility to establish Wolbachia-infected anopheles mosquitoes, which could be used for control strategies to overcome the plasmodium parasite responsible for malaria incidence [43].

Prevalence Dynamic of Wolbachia and Cytoplasmic Incompatibility (CI)

It is known that Wolbachia passed on from generation to the next generation by vertical transmission. Infected-males cause excitation of cytoplasmic incompatibility (CI) and modification of their sperm and lead to offspring death in early development stages (Figure 1A). However, in females case, Wolbachia make encoding that keep the offspring to stay alive and successful development allowing the bacterium to dominate over the populations (Figure A1) [44]. When Wolbachia spread with high rate then the reproductive advantage of infected females will be greatest. Otherwise, If Wolbachia is low, females rarely mate with Wolbachia-infected males, then low chance of compatibility with these males and Wolbachia could be lost from the population (Figure 1B). Similar case happens when infected females don’t carry Wolbachia to the whole offspring. Wolbachia release should be with high amount to avoid losing the infection after release stop.45,46,47 Releasing of Wolbachia-positive A. aegypti was implemented in 2011 in both isolated Yorkeys Knob and Gordonvale areas and the infection kept spread for 2 year-post release stop.46 Recently release was applied in Cairns area where the mosquitos’ migration may occur from the release areas to surrounding areas and vice-versa, this may lead to decrease of Wolbachia infection level and ultimately the loss of Wolbachia. However, the infection was developed well showing that Wolbachia approach can be implemented in a wide-scale.48

Figure 1: (A) Mosquito mating between female and male and effect of Cytoplasmic incompatibility (CI) on resulting offspring (B) Role of release density in the invasion of Wolbachia in the population Figure 1: (A) Mosquito mating between female and male and effect of Cytoplasmic incompatibility (CI) on resulting offspring (B) Role of release density in the invasion of Wolbachia in the population

Click here to View Figure

Wolbachia and Pathogen Interference in Aedes aegypti

Creative strategy to control mosquito-born diseases started by using artificially Wolbachia-infected mosquitoes. Data from the field work has proved that Wolbachia represents promising technique to reduce natural populations of Aedes aegypti and control the diseases they transmit.

The mechanism of Wolbachia interference with the pathogens is complicated issue and need to be understood. Several scientists have attempted to explain the pathogen blocking by Wolbachia. They have discussed the properties of mosquito’s samples collected from the field and other related insects. They demonstrated the correlation between Wolbachia density and the ability to block pathogen by high load that destroy host tissue. Also the probability of induction the immune response system of the host which could resist the pathogens inside the insect. Furthermore, recent studies showed that Wolbachia play role in immune system modulation of the host and affect on the immunity system of A. aegypti and Culex quinquefasciatus to suppress Dengue and West Nile virus replication [49]. Other mode of action suggests modification of the cell membrane of the host, lead to preventing the vector to transmit the pathogens. Other explanation suggests competition development between Wolbachia and pathogens inside the host [50]. We mentioned above that wMelPop cause reducing in the lifespan of mosquito, this limits the pathogens spread because the lifespan of mosquito became shorter and not enough to complete the incubation interval for pathogens.51,52 Moreira et al. (2009) have described unusual behavior regarding the blood-feeding in wolbachia-infected A. aegypti, where proboscis becomes more prominent in elder mosquitoes, this phenomenon led to reduce the biting activities which eventually decrease the reproductive capacity.53 Additionally, Wolachia was found to enhance mosquito immune responses against pathogens. Bian et al. showed that the genes responsible for immune, Defensin, Cercropin, Diptericin, GNBPB1, SPZ1A, Cactus, Rel1 and Rel2 were adjusted in wolbachia-infected A. Aegypti mosquitoes, which could explain their ability to resist dengue virus.54

Wolbachia-Based Strategy to Control other Arboviral Infections

The technique of Wolbachia-infected mosquitoes was fucused initially for dengue control, experimental studies proved that this approach can extend to control other mosquito-borne diseases, particularly Chikungunya, Japanese encephalitis and Yellow fever. Regarding West Nile virus, it was recorded in 2009   that Wolbachia approach working to increase host resistance to West Nile virus in Culex quinquefasciatus mosquito.55 Subsequently, reports described that majority of Culex quinquefasciatus mosquitoes are naturally Wolbachia-infected but are still able to cause infection with West Nile virus. Furthermore, the Wolbachia strain isolated from Aedes albopictus play role in the enhancement of West Nile virus infection in Culex tarsalis, which is an important transmitter of West Nile virus in North America and naturally does carry Wolbachia.56 Finally, Wolbachia-infected mosquitoes showed high resistance to the transmission of two isolates of Brazilian Zika virus.  Fortunately, no evidence that Wolbachia-infected A. aegypti is carrying Zika virus in the saliva, indicating that Wolbachia-based strategy can prevent the infection with of Zika virus.57

Wolbachia Strategy in Saudi Arabia

In the Kingdom of Saudi Arabia (KSA) dengue disease was recorded for the first time in 1994 [58] and the number of cases is growing up as reported by researchers, Malaria cases also represent issue especially in Jazan region. Although the control activities during the past period, but people remain at risk as the epidemics transmission does not stop. Thus, new control strategies are needed to overcome these health problems. Accordingly, the strategy of Wolbachia-based biocontrol of dengue is started and still in the initial stages. Outcomes will be subject to evaluation and reported after finishing releases. If the experiment achieved success, it could be implemented on a large-scale.

Conclusion

Mosquitoes transmit Dengue and several diseases. We discussed here the current available informations about the relation between Wolbachia and moaquitoes. Insecticide-based approaches are currently the key tools in combat of major mosquito-borne diseases. However, the ability of mosquitoes to develop resistance against insecticides in addition to its harmful effects to ecosystem push to thinking to find alternative strategies. Wolbachia is a promising as a bio-control technique in fighting mosquitoes-borne diseases. More research is urgently needed to find better understand about behavior of artificially Wolbachia-infected mosquitoes and the mechanisms of interference between Wolbachia, pathogens and hosts.

Acknowledgements

We would like to present gratitude to King Abdulaziz City for Science and Technology, Ryidh, Saudi arabia for their technical support.

Conflict of Interest

The authors declare no conflict of interest.

Funding Source

There is no funding source.

References

  1. Chen LH, Wilson ME (2010) Dengue and chikungunya infections in travelers. Curr Opin Infect Dis 23: 438–444
  2. World Health Organization (WHO) (2019). Dengue and severe dengue. 2019 https://www.who.int/news-room/fact-sheets/detail/dengue-and-severe-dengue
  3. Lima, E.P., Paiva, M.H.S., Paula de Araújo, A., da Saliva, U. M. da Saliva, de Oliveira, L. N., et al. (2011)Insecticide resistant in Aedes aegypti populations from ceara, Brazil. Parasites & Vectors, 4(1), 5.
  4. Marcombe, S., Mathieu, R.B., Pocquet, N., Riaz, M.-A, Poupardin, R., Selior, S., et al. (2012) Insecticide resistant in the dengue vector Aedes aegypti from Matrinique: Distribution, mechanisms and relations with environmental factors, PLoS One, 7 (2), Article e30989
  5. Achee, N. L., Gould, F., Perkin, T.A., Reiner Jr. R.C., Morrison, A.C., Ritchie, S.A. et al. (2015) critical assessment of vector control for dengue prevention, PLoS Neglected Tropical Diseases, 9 (5) e0003655
  6. WHO (1998) Test Procedures for Insecticide Resistance Monitoring in Malaria Vectors, Bio­Efficacy and Persistence of Insecticides on Treated Surfaces. Report of the WHO informal consultation on WHO/HQ (document WHO/ cDS/cpc/MaL/98.12), 28–30 September. geneva, Swizerland: World Health Organization
  7. Zaim M, Guillet P. (2002) Alternative insecticides: an urgent need. Trends in Parasitology, 8(4):161–163.
  8. Kay B. and Nam VS. (2005) New strategy against Aedes aegypti in Vietnam. The Lancet. 365(9459):613–617.
  9. Yakob L. and Walker T. (2016) Zika virus outbreak in Americas: The need for novel mosquito control methods, The Lancet Global Health, 4 (3), pp. e148-e149
  10. Labbé G.M.C., Scaife S., Morgan, S.A., Curtis Z. H., Alphey L. (2012) Female-specific flightless (fsRIDL) phenotype for control of Aedes albopictus, PLoS Neglected Tropical Diseases, 6(7), e1724
  11. Ferguson N.M., Kien D. T. H., Clapham H., Augas R., Vu T.T., Chau, T.N.B., et al. (2015) Modeling the impact on virus transmission of wolbachia-mediated blocking of dengue virus infection of Aedes aegypti, Science Translational Medicine, 7 (279)
  12. Kamtchum-Tatuene, J. et al. (2017) “The potential role of Wolbachia in controlling the transmission of emerging human arboviral infections,” Current opinion in infectious diseases. Wolters Kluwer Health, 30(1), p. 108.
  13. Hoffmann, A. A., Montgomery B. L., Popovici, J., Iturbe-Ormaetxe I., Johnson P.H., Muzzi F., et al. (2011) Successful establishment of Wolbachia in Aedes populations to suppress dengue transmission, Nature, 476 (7361), p.454
  14. Frentiu F.D., Zakir T., Walker T., Popovici J., Alyssa T.P., van den Hurk A., et al. (2014) Limited dengue virus replication in field-collected Aedes aegypti mosquitoes infected with Wolbachia, PLoS Neglected Tropical Diseases, 8(2) p. e2688
  15. O’Neill, S.L., Ryan P.A., Turley, A. P., Wilson G., Retzki K., Iturbe-Ormaetxe I., et al. (2018) Scaled deployment of Wolbachia to protect the community from dengue and other Aedes transmitted arboviruses, Gates Open Research, 2
  16. Van den Hurk, A.F., Hall-Mendelin, S., Pyke, A.T., Frentiu, F.D., McElroy, K., Day, A., Higgs, S. and O’Neill, S.L. (2013) Impact of Wolbachia on infection with chikungunya and yellow fever viruses in the mosquito vector Aedes aegypti. PLoS Pathogens 6, e1892.
  17. Kambris, Z., Blagborough, A.M., Pinto, S.B., Blagrove, M.S., Godfray, H.C., Sinden, R.E. and Sinkins, S.P. (2010) Wolbachia stimulates immune gene expression and inhibits Plasmodium development in Anopheles PLoS Pathogens 6, e1001143.
  18. Hughes, G.L., Koga, R., Xue, P., Fukatsu, T. and Rasgon, J.L. (2011) Wolbachia infections are virulent and inhibit the human malaria parasite Plasmodium falciparum in Anopheles gambiae. PLoS Pathogens 7, e1002043.
  19. Aliota M. T., Peinado S. A., Velez, I. D. and Osorio J. E. (2016) The wMel strain of Wolbachia reduces transmission of Zika virus by Aedes aegypti, Scientific Reports, 6, p. 2879
  20. Popovici, J., Moreira, L.A., Poinsignon, A., Iturbe-Ormaexte, I., McNaughton, D. and O’Neill, S.L. (2010) Assessing key safety concerns of a Wolbachia-based strategy to control dengue transmission by Aedes Memorias do Instituto Oswaldo Cruz 105, 957–964.
  21. Murphy, B., Jansen, C.C., Murray, J. and De Barro, P. (2010) Risk Analysis on the Australian Release of Aedes aegypti (L.) (Diptera: Culicidae) Containing Wolbachia. CSIRO, Brisbane, Australia.
  22. Heath BD, Butcher DJ, Whitfield WgF, Hubbard SF (1999) Horizontal transfer of Wolbachia between phylogenetically distant insect species by a naturally occurring mechanism. Curr Biology 9: 313–316
  23. Huigens ME, de almeida rp, Boons pa, Luck rF, Stouthamer r (2004) Natural interspecific and intraspecific horizontal transfer of parthenogenesis-inducing Wolbachia in Trichogramma wasps. Proc Royal Soc Lond B Biol Sci 271: 509–515
  24. Klasson L, Kambris z, cook pE, Walker t, Sinkins Sp (2009a) Horizontal gene transfer between Wolbachia and the mosquito Aedes aegypti. BMC Genomics 10: 33
  25. McNulty SN et al (2010) Endosymbiont DNa in endobacteria-free filarial nematodes indicates ancient horizontal genetic transfer. PLoS ONE 5: e11029
  26. Rances, E., Ye, Y.H., Woolfit, M., McGraw, E.A. & O’Neill, S.L. The relative importance of innate immune priming in Wolbachia-mediated dengue interference. PLOS Pathogens 8(2): e1002548.
  27. Laven, H. (1967) Eradication of Culex pipiens fatigans through cytoplasmic incompatibility. Nature 216, 383–384.
  28. Scott, R. (2014). Rear and release: a new paradigm for dengue control. Austral Entomology 53: 363-367.
  29. Walker T, Johnson PH, Moreira LA, Iturbe-Ormaetxe I, Frentiu FD, McMeniman CJ, et al. (2011) The wMel Wolbachia strain blocks dengue and invades caged Aedes aegypti Nature, 476(7361):450–453.
  30. Nazni, W. A., Hoffmann, A. A., NoorAfizah et al. (2019) Establishment of Wolbachia strain wAlbB in Malaysian Populations of Aedes Aegypti for Dengue control, Current Biology 29, 4241–4248
  31. Schmidt TL, Barton NH, Rašić G, et al. (2017) Local introduction and heterogeneous spatial spread of dengue-suppressing Wolbachia through an urban population of Aedes aegypti. PLoS Biol. 15(5): e2001894.
  32. Adekunle, A. I., Meehan, M. T., and McBryde, E. S. (2019) Mathematical analysis of a Wolbachia invasive model with imperfect maternal transmission and loss of Wolbachia infection, Infectious Disease Modelling xxx (xxxx) xxx-xxx (https://doi.org/10.1016/j.idm.2019.10.001)
  33. M. (2015) An introduction to mathematical epidemiology, volume 61. Springer, 2015.
  34. Rafikov, M., Meza, M. E., Correa, D. P. and Wyse. A. P. (2019) Controlling Aedes aegypti populations by limited wolbachia -based strategies in a seasonal environment. Mathematical Methods in the Applied Sciences, mar 2019. doi: 10. 1002/mma.5527. URL https://doi.org/10.1002/mma.5527.
  35. Campo-Duarte, D. E., Vasilieva, O., Cardona-Salgado, D. and Svinin M. (2018) Optimal control approach for establishing wmelpop wolbachia infection among wild aedes aegypti populations. Journal of mathematical biology, 76(7):1907–1950, 2018.
  36. Zheng, B., Tang, M., Yu, J. and Qiu. J. (2018) Wolbachia spreading dynamics in mosquitoes with imperfect maternal transmission. Journal of mathematical biology, 76(1-2): 235–263.
  37. Caspari E. and Watson G. (1959) On the evolutionary importance of cytoplasmic sterility in mosquitoes. Evolution, 13(4):568–570.
  38. Ndii M. Z., Hickson, R. I. and Mercer G. N. (2012) Modelling the introduction of wolbachia into Aedes aegypti mosquitoes to reduce dengue transmission. The ANZIAM Journal, 53(3):213–227.
  39. Xue L., Manore, C. A., Thongsripong, P. and Hyman M. (2017) Two-sex mosquito model for the persistence of wolbachia. Journal of biological dynamics, 11(sup1):216–237.
  40. Qu, Z., Xue, L. and Hyman J. M. (2018). Modeling the transmission of wolbachia in mosquitoes for controlling mosquito-borne diseases. SIAM Journal on Applied Mathematics, 78(2):826–852.
  41. Li, Y. and Liu X. (2017) An impulsive model for wolbachia infection control of mosquito borne diseases with general birth and death rate functions. Nonlinear Analysis: Real World Applications, 37:412–432.
  42. ƠReilly, K. M., Hendrickx, E., Kharisma, D. D. et al. (2019) Estimating the burden of dengue and the impact of release of wMel Wolbachia –infected mosquitoes in Indonesia: a modelling study, BMC Medicine 17:172
  43. Jeffries, C. L., Lawrence, G. G., Golovko, G. et al. (2018) Novel Wolbachia strains in Anopheles malaria vectors from Sub-Saharan Africa, Wellcome Open Research 3:113
  44. Atyame, C. M. et al. (2016) “Comparison of irradiation and Wolbachia based approaches for sterile-male strategies targeting Aedes albopictus,” PLoS one. Public Library of Science, 11(1).
  45. Blagrove, M. S. C. et al. (2012) “Wolbachia strain wMel induces cytoplasmic incompatibility and blocks dengue transmission in Aedes albopictus,” Proceedings of the National Academy of Sciences. National Acad Sciences, 109(1), pp. 255–260.
  46. Alphey, L. et al. (2013) “Genetic control of Aedes mosquitoes,” Pathogens and global health. Taylor & Francis, 107(4), pp. 170–179.
  47. Atyame, C. M. et al. (2015) “Wolbachia-based population control strategy targeting Culex quinquefasciatus mosquitoes proves efficient under semi-field conditions,” PloS one. Public Library of Science, 10(3).
  48. Lacroix, R. et al. (2012) “Open field release of genetically engineered sterile male Aedes aegypti in Malaysia,” PloS one. Public Library of Science, 7(8), p. e42771.
  49. Niang, E. H. A. et al. (2018) “Biological Control of Mosquito-Borne Diseases: The Potential of Wolbachia-Based Interventions in an IVM Framework,” Journal of tropical medicine. Hindawi.
  50. Moreira LA, Iturbe-Ormaetxe I, Jeffery JA, Lu G, Pyke AT, Hedges LM, et al. (2009) A Wolbachia symbiont in Aedes aegypti limits infection with Dengue, Chikungunya, and Plasmodium. Cell. 139(7): 1268–1278.
  51. Moreira LA, Saig E, Turley AP, Ribeiro JMC, O’Neill SL, McGraw EA. (2009) Human probing behavior of Aedes aegypti when infected with a life-shortening strain of Wolbachia. PLoS Neglected Tropical Diseases, 3(12):e568.
  52. Sinkins SP, O’Neill SL. (2000) Wolbachia as a vehicle to modify insect populations. In: Handler A, James AA, eds. Insect transgenesis: methods and applications. Boca Raton: CRC Press, pp. 271–287.
  53. Aksoy S, Cook P, McMeniman C, O’Neill S. (2008) Modifying insect population age structure to control vectorborne disease, in transgenesis and the management of vector-borne disease. New York: Springer, pp.126–140.
  54. Bian G, Xu Y, Lu P, Xie Y, Xi Z. (2010) The endosymbiotic bacterium Wolbachia induces resistance to dengue virus in Aedes aegypti. PLoS Pathogens, 1;6(4):e1000833.
  55. Glaser, R. L. and Meola, M. A. (2010) “The native Wolbachia endosymbionts of Drosophila melanogaster and Culex quinquefasciatus increase host resistance to West Nile virus infection,” PloS one. Public Library of Science, 5(8).
  56. Dodson, B. L. et al. (2014) “Wolbachia enhances West Nile virus (WNV) infection in the mosquito Culex tarsalis,” PLoS neglected tropical diseases. Public Library of Science, 8(7).
  57. Dutra, H. L. C. et al. (2016) “Wolbachia blocks currently circulating Zika virus isolates in Brazilian Aedes aegypti mosquitoes,” Cell host & microbe. Elsevier, 19(6), pp. 771–774.
  58. Fakeeh M. and Zaki A. M. (2001) Virologic and Serologic Surveillance for Dengue Fever In Jeddah, Saudi Arabia, 1994–1999, Am. J. Trop. Med. Hyg., 65(6), 764–767.

A Study of Effectiveness of Natural Coatings on the Shelf Life Extension of Tomatoes by the Observation of TomloxC Gene Expression

$
0
0

Introduction

Tomato is very popular and widely consumed throughout the world. It can be eaten raw and cooked. They are used to prepare soup, juice ketchup, pickle, pasta and powder. Tomato is also popular because it is a promising source of vitamin C and adds variety of colors and flavors to the food.1 Dried tomato juice is rich in vitamin C. It is also considered to be intestinal antiseptic,anti-diabetic and also reduced heart disease. Depending on age groups, the requirement for vitamin C and vitamin A is about 30-40 mg/ 100mg and 2500-3000 mg /100mg thus daily consumption of 100g tomato, the requirement of vitamin C and vitamin A respectively will be met up. The perish ability of tomato is very high i.e. shelf life is very short. Soextension of shelf life of tomato is required.

The shelf life of any fruit consists of ripening and senescence.2 After harvest, fruits undergo many physiological and biochemical changes. The shelf life of fruits could be prolonged significantly through slowing down the process leading to ripening and controlling the microbial decay.3-6 Information regarding the extension of storage life of tomato through the treatment of natural coatings in Bangladesh is very scanty. Artificial preservatives and chemicals are often very injurious to health in the long term. The present study has been undertaken to extend the storage life (Shelf life) and to reduce the spoilage of tomato caused by various factors without changing its quality. In this study, the aim is to observe the effect of natural coating of aloe vera, olive oil and pectin on delaying ripening of tomatoes and increasing the shelf life. Aloe vera has given good results in increasing shelf life of fruits previously.7-10

The ripening of fruits is influenced by auxins,  ethylene, brassinosteroids and SBA. In climacteric fruits, including tomato, avocado, peach and apple, ripening is marked by a respiratory burst linked to the production of ethylene.11,12

There are five lipoxygenases (TomloxA, TomloxB,TomloxC, TomloxD, and TomloxE) available in tomatoes Lycopersicon esculentum). Lipoxygenases play vital role in disrupting chloroplast thylakoid membranes. This is required for thetransformation from chloroplast to chromoplastduring fruit ripening. The substrate for LOX is usually believed to be unesterified polyunsaturated fatty acids produced from complex lipids through the action of lipases. 13Chloroplasts have been suggested as the main site for hydroperoxide synthesis of fatty acids. Interruption of these thylakoid membranes may result in linoleic and linolenic acids. TomloxC is a primary lipoxygenase that primarily engages in the generation of short-chain flavor compounds derived from fatty acids C6 and is essential in the generation of fruit flavor and ripening properties.14 Experiments on the regulation of gene expression related to fruit shelf life and ripening is necessary to prove the efficiency of the preservatives by providing real time PCR data. TomloxC is a chloroplast-targeted lipoxygenase that is generated at significant concentrations during fruit maturation, and so it is clearly a worthy target.14,15

Preservation of food, fruits and vegetables in a natural way is explored for a long time. The goal of this research is to evaluate the natural coatings efficiency in extension of shelf life of tomato and analysis of related gene expression by real time PCR.16,17

Materials and Methods

Freshly harvested Aloe vera leaves were collected from the local market for processing and preparation of Aloe vera gel finally used as natural coatings. The leaves should be sound, undamaged, mold/ rot free and matured in order to keep all the active ingredients in full concentration. The leaves were washed with water and removed unexpected organ and peeled. The pulp were collected and homogenized by blending and mixed and the mixture was filtered then it was heated at low temperature for two hours. Now the aloe vera gel was cooled and added to 3% pectin powder and 5% olive oil mixed with over head stirrer in 3000 rpm for two hours. Then the homogenized mixture was cooled and ready for use as natural coatings.17,18 Experimental samples were taken from sound ripe and disease free tomato (Local, bizli and lovely cultivars) from local market of Rajshahi and washed with distilled water and air dried.

Tomatoes were placed in 20 L container containing natural coatings for 10 min and exposed to different treatments. Control uncoated) fruits were maintained in identical condition without treatment at ambient temperature. Tomatoes were air dried and stored for observation at an ambient temperature (28-30ºC) and relative humidity (70-72%). For each parameter, three sets of independent experiments were carried out and fifteen Tomatoes were employed for each set of experiment and analytical work. Starting with day 0 immediately after treatment) till day last edible stage (15 days), one tomato from each of the coated and uncoated were taken, analysis were performed. The experimental samples were taken from the uncoated and coated samples to analyze physical and chemical characteristics at two days intervals.

The sugar content was determined by spectrophotometrically by the Lane and Eynon method,19 and the reducing sugar was estimated by the DNSA method using 3, 5-Dinitrosalicylic acid (DNSA).20 Vitamin C was also estimated by spectrophotometric method. 5 ml of 1gm/ml sample was prepared and centrifuged at 5000 rpm. Then 0.5 ml extract was taken and 0.8 ml 10% Trichloroacetic acid was added to it and freezed for 5 minutes. Then it was centrifuged again. The supernatant was taken. 3 ml dH20 and 0.4 ml 10% Folin Ciocalteu’s Reagent ( FCR) solution was added. Then the absorbance was measured at 760 nm.21

TSS was determined by refractometric method and pH was determined by a standard pH meter. Acidity was estimated by acid–base titrimetric method using standard sodium hydroxide solution.23 The preserved tomato was analyzed periodically and the results were recorded in tables (Table 1 and 2).

The related gene expression of the uncoated and coated samples was done at the last edible stage; RNA was isolated from ripe tomato pulp tissue using Promega RNA isolation kit as per instructions provided therein. After RNA extraction, quantification of RNA concentration was done by a micro spectrophotometer K2800 nucleic acid analyzer, Beijing Kaiao Technology Development Co. Ltd; (China). Sample purity was evaluated by calculating absorbance ratio (A230:A280). The extracted RNA of the samples were equalized to 50 ng/ ul to be used as template in reverse transcription PCR and then for real time PCR reaction by diluting with calculated volume of DNAse / RNAse  free H2O Amresco,(USA).25,26

For amplification of tomato lipoxygenase(TomloxC), Forward primer: CACATTGGAGATAAATGCCTTAGC and reverse primer: CAGTTGTTGGCCTATTTGGAAAG were used (GenBank accession number: U37839).26 

TomloxC amount was measured by RT-PCR in coated and uncoated tomatoes. The following cycling protocols were used : 95ºC for 5 minutes , followed by 30 cycles of  95ºC for 15 sec, 60 ºC for 30 sec per cycle and 72ºC for 15 sec with a final extension of 72 ºC for 10 min. Melt curve analysis is done by instrument’s default parameters. Real–Time PCR analysis was carried out in a Rotor Gene Q (QIAGEN) with 20 µl reaction volume consisting of 4ul of master mix, 2.5 µl of primer and probe mix, 11 µl of ddH2O and 2.5 µl of DNA template containing 125 ng of total DNA. Required dilution was performed using DNAse/ RNAse free water.27 

Results and Discussions

Figure 1: Uncoated Tomato at the initial stage (a) Tomato treated with natural coatings at the initial stage (b). Uncoated Tomato at the last edible stage (c). Tomato treated with natural coatings at the last edible stage (d) Figure 1: Uncoated Tomato at the initial stage (a) Tomato treated with natural coatings at the initial stage (b). Uncoated Tomato at the last edible stage (c). Tomato treated with natural coatings at the last edible stage (d)

Click here to View Figure

The natural coatings applied for the extension of shelf life of tomato cultivars extended the shelf life 4 to 6 days compared to uncoated one as shown in Figure 1 and Figure 2. The weight loss of the coated tomato was affected (Figure 3) showed that the weight loss in coated tomato was significantly lower than that of uncoated Tomatoes. So, the natural coating was also found to have beneficial effects on firmness retention and delaying fruit softening.

Figure 2: Average shelf life of coated and uncoated tomato cultivars Figure 2: Average shelf life of coated and uncoated tomato cultivars

Click here to View Figure

Figure 3: Average weight loss (%) of coated and uncoated tomato cultivars Figure 3: Average weight loss (%) of coated and uncoated tomato cultivars

Click here to View Figure

Table 1 and 2 showed the nutritional quality of tomato that was also affected remarkably after the treatment with natural coatings at the last edible stage.

Tomatoes from the coating treated Coated) might have superior quality as the protein, B carotene, vitamin C, total sugar, reducing sugar, non reducing sugar, total soluble solids, carbohydrate, phosphorus etc content of its pulp were higher than those of uncoated Tomatoes.  The amount of moisture, Total sugar, Reducing sugar, non reducing ,carbohydrate, phosphorus, vitamin C ,protein, B-carotene were higher while the amount of dry matter, ash, pH were lower as compared to the amount of those present in the pulp of uncoated tomato. Application of edible natural coatings on preservation of tomato resulted in extended shelf life, reduced average weight loss, and acceptable improvement in sensory characteristics.

Table 1: The Physical parameters of tomato pulp from uncoated and coated ripe sample tomatoes at the last edible stage during the storage period.

Name of tomato cultivars Treatment Juice % TSS % pH Dry mater % Moisture % Ash % Acidity % as citric acid
Local Coated

uncoated

77.0

74.5

6.5

6.0

4.48

4.59

4.79

5.53

95.21

94.47

0.46

0.51

0.095

0.072

Bizli Coated

uncoated

75.0

72.5

6.5

6.0

4.47

4.53

5.03

5.04

94.97

94.96

0.34

0.50

0.103

0.043

Lovely.


Coated

uncoated

70.0

75.0

7.0

6.5

4.02

4.22

6.09

6.40

93.91

93.60

0.52

0.55

0.163

0.127

Table 2: The nutritional value of tomato pulp from uncoated and coated ripe tomato at the last edible stage during the storage period

Name of tomato cultivars

Treatments Total sugar % Reducing sugar % Non reducing sugar % Protein % B- carotene mg/100g Phosphorous % Vitamin C mg/ 100g Carbohydrate %
Local Coated

uncoated

3.63

3.47

1.38

1.33

2.25

2.14

0.62

0.49

341

273

26.03

23.60

10.87

09.33

4.76

4.53

Bizli

Coated

uncoated

4.38

3.95

1.42

1.26

2.96

2.69

0.58

0.51

380

326

19.35

18.09

13.60

18.43

5.42

4.91

Lovely Coated

uncoated

5.03

4.86

1.86

1.78

3.17

3.08

0.63

0.46

351

302

21.85

19.72

9.70

6.96

6.23

5.84

Figure 4 indicates that the expression of TomloxC is less in treated tomatoes as compared to the control ones. So, it can be said that the coating has vital role in delaying ripening.

Figure 3: Average weight loss (%) of coated and uncoated tomato cultivars Figure 4: Comparative Analysis of Melting Curve for TomloxC gene of Coated (Aloe vera coating Treatment) and Uncoated (Control) tomatoes

Click here to View Figure

The Melt curve shows that the value of change in fluorescence level with respect to per unit change in temperature (dF/dT) is greater in uncoated tomatoes (3.4) in comparison to coated tomatoes(1.6). It means that the coated tomatoes contained less amount of amplified TomloxC gene in comparison to coated ones. Previous studies show that TomloxC gene is expressed in higher amount in riper tomatoes. So, the findings indicate that the aloe vera gel coating has delayed the ripening of tomatoes.28

The shelf life of coated fruits increased to 4 to 6 days compared to that of uncoated ones. The average weight loss was 5-7% less in coated tomatoes than in uncoated one. So, it can be concluded that application of the pectin–based coating on tomatoes was effective in reducing the associated physiological changes and extending the storage life.

Conclusion   

Now a day, various toxic chemicals are often used to preserve fruits and vegetables or extend the shelf-life. Findings from the current work are effective for solving this issue. Usage of edible natural coatings on tomato resulted in increased shelf life, decreased average weight loss and reasonable sensory enhancement. Thus, it can be concluded that the application of aloe vera based natural coating has great potential in reducing the ripening-related physiological changes and prolonging  the shelf life of tomatoes and other fruits and vegetables. The natural coatings might be used to eradicate the use of hazardous chemicals in order to conserve the nation and climate.

Acknowledgements

Dr Md Ibrahim, Paroma Arefin and Ruhul Amin has designed the research. Zafar As Sadiq, A K M Shamsul Alam, Subarna Sandhani Dey, Farhana Boby and Md Shimul Parvaz have been involved in laboratory experiments. Paroma Arefin, Md Murshed Hasan Sarkar, and Md Shehan Habib have contributed to writing the paper.

Conflict of Interest

This research has no conflict of interest.

Funding Source

There is no funding source

References

  1. Manzano- Mendez J, Hicks JR and Masters, JF 1984. Influence of storage temperature and ethylene on firmness, acid and sugars of chilling–sensitive and chilling–tolerant tomato. J. Am. Soc. Hortic. Sci. 109: 273-277.
  2. Dang KTH, Singh Z and SwinnyEE Edible coatings influence fruit repining quality and aroma biosynthesis in mango fruit. J. Agric. Food Chem. 56: 1361-1370.
  3. Fabian G, Huertas M, Diaz- Mula, PJ, Zapata, Daniel V, Maria S, Salvador C and Domingo MR 2013. Aloe araborescens and Aloe vera gels as coating in delaying postharvest ripening in prach and plum fruit. Postharvest Biol and Technol. 83: 54-57
  4. Vahdat S, Ghazvoni RF and Ghasemnezhad M 2010. Effect of Aloe vera gel on maintenance of strawberry fruits quality. Acta Hort. 877: 919-924.
  5. Valverde JM, Valero D, Martinez-Romero D, Guillel F, Castillo S, Serrano M2005. Nobel coating based on Aloe vera gel to maintain table grape quality. Agric. Food Chem. 53: 7807-7813.
  6. Benitez S,Achaerandio I, Sepulcre F, and Pujola M 2013. Aloe vera based edible coating improve the quality of minimally processed Hayward Kiewifruit. Postharvest Biol and Technol. 81:29-36.
  7. Chandegara VK and Varshney AK 2014. Effect of centrifuge speed on gel extraction from Aloe vera leaves. Food Process Technol.51:1-6.
  8. Singh DBR, Singh ARP, Kihgly Sharma RR 2011. Effect of Aloe vera coating on fruit quality and storability Fragaria x Annassa). Indian J. Agr. Sci. 81: 407-412.
  9. Singh RN, Sing G, Mishra JS, Rao OP and Sing G1987. Studies on the effect of pre and postharvest treaments of calcium nitrate and calcium chloride in the storage life of amropali mango. Prog Hort. 19(1-2): 1-9.
  10. Singh S, Kushwaha BP, Nag SK, Mishra AK, Bhattacharya S, Gupta PK, Singh A 2011. In vitro methane emission from Indian dry roughages in relation to chemical composition. Current Science, 101(1): 57-65.
  11. Adams-Phillips L, Barry C, Kannan P, Leclercq J, Bouzayen M and Giovannoni J 2004. Evidence that CTR1-mediated ethylene signal transduction in tomato is encoded by a multigene family whose members display distinct regulatory features. Plant MolBiol 54:387-404.
  12. Chattopadhyay N, Hore JK andSen SK. 1992. Extension of storage life of sweet orange Citrus sinensisOsbeek) CV Jaffa. Indian J. of Plant Physiology. 35 (93): 245-251.
  13. Alexander L and Grierson D 2002. Ethylene biosynthesis and action in tomato: a model for climacteric fruit ripening, J of Exp Bot, 531: 2039–2055, https://doi.org/10.1093/jxb/erf072.
  14. Chen G, Hackett R, Walker D, Taylor A, Lin Z, and Grierson D 2004. Identification of a specific isoform of tomato lipoxygenase TomloxC involved in the generation of fatty acid-derived flavor compounds. Plant physiology, 136 2641–2651. https://doi.org/10.1104/pp.104.041608
  15. Wang L, Baldwin EA & Bai J 2016. Recent Advance in Aromatic Volatile Research in Tomato Fruit: The Metabolisms and Regulations. Food Bioprocess Technol 9: 203–216 https://doi.org/10.1007/s11947-015-1638-1.
  16. Hu T & Qv X & Hu Z & Chen, G & Chen, Z 2011. Expression, molecular characterization and detection of lipoxygenase activity of tomloxD from tomato. African Journal of Biotech. 10. 490-498.
  17. Mariutto M, Duby F, Adam A, Bureau C, Fauconnier ML, Ongena M, Thonart P, Dommes J 2011. The elicitation of a systemic resistance by Pseudomonas putida BTP1 in tomato involves the stimulation of two lipoxygenase isoforms. BMC Plant Biol, 11:29. doi: 10.1186/1471-2229-11-29.
  18. Changhong HE, Kojo E and Tian Z 2005. Quality and Safety assurance in the processing of aloe vera juice. Food Control.162: 95-104
  19. Method 923.09: invert sugar in sugars and syrups, lane eynon general volumetric method, final action. 1990. Official Methods of Analysis of Association of Official Analytical Chemists, Better World Books, Reno, NV, USA, 15th edition
  20. Miller GL 1959. Use of dinitrosalicylic acid reagent for determination of reducing sugar. Chem. 31(3): 426-428
  21. Rodger A and Sanders K 2017. UV-Visible Absorption Spectroscopy, Biomacromolecular Applications. Encyclopedia of Spectroscopy and Spectrometry (Third Edition)
  22. Arefin P, Sakib T, Habib MS, Saha T, Boby F. 2019. Evaluation of pH of Facial Cleansers Available in the Bangladeshi Market. Nov App in Drug Des & Dev; 5(2): 39-41. doi:10.19080/ NAPDD.2019.05.555660.
  23. Jayaraman, J. Laboratories Mannual in Biochemistry 1981. New age Internatinal Lit, 180.
  24. Yang XY, Jiang WJ, Yu HJ. The expression profiling of the lipoxygenase (LOX) family genes during fruit development, abiotic stress and hormonal treatments in cucumber (Cucumis sativus L.). Int J Mol Sci. 2012;13(2):481-500. doi: 10.3390/ijms13022481.
  25. Marone M, Mozzetti S, De Ritis D, Pierelli L and Scambia G 2001. Semiquantitative RT-PCR analysis to assess the expression levels of multiple transcripts from the same sample. Biol Proced Online.3:19-25. doi: 10.1251/bpo20.
  26. https://www.ncbi.nlm.nih.gov/genbank/
  27. Romero Mdel M, Grasa Mdel M, Esteve M, Fernández-López JA, Alemany M. 2007.Semiquantitative RT-PCR measurement of gene expression in rat tissues including a correction for varying cell size and number. Nutr Metab (Lond).4:26. doi: 10.1186/1743-7075-4-26.
  28. Arefin P, Amin R, Sadiq M Z, Dey S S, Boby F, Sarkar MMH, Habib MS, Alam AKMS , Parvaz MS, Ibrahim 2020. Extension of Shelf Life of Mango by Aloe Vera based Coatings and Related Gene Expression by Real Time Polymerase Chain Reaction. Bang Journ of Nutr.(Accepted)

Molecular Networking of Regulated Transcription Factors under Salt Stress in Wild Barley (H. spontaneum)

$
0
0

Introduction

Salt stress is one of the most devastating environmental conditions that extremely restrict plant growth and yield. For a plant to survive such harsh condition, a series of tolerance mechanisms can occur to help plant adapt and respond properly to this condition.1 Earlier reports indicate that expression levels of different stress-related genes are regulated by transcription factors (TFs) that work as stimulators of individual genes or act as master switches driving a battery of genes or a whole pathway such as stress signal transduction pathways.2-8 WRKY is among the largest families of TFs that play important roles in modulating physiological processes in plants under stress conditions.8-12 Protein encoded by this TF gene family is characterized by a 60 amino acids domain of highly conserved WRKYGQK heptapeptide at the N-terminal and an atypical zinc finger-like motif at its C-terminal.13, 14 This family contains over 70 members in Arabidopsis.13, 15 55 in cucumber,16 119 in maize,17 94 in barley,18 and 100 in rice.19 Encoded proteins of this family are characterized by a 60-amino acids domain containing the WRKY amino acid sequence at its amino-terminal end and a putative zinc finger motif at its carboxy-terminal end. Based on number and diversity of WRKY domains, WRKY proteins are classified into three groups (I, II and III) of which category I proteins harbor two domains, while proteins of groups II and III harbor only one domain. Groups II and III proteins differ in zinc finger structures (C2H2 in group II, while C2HC in group III) (14, 20). Previous study reported a number of 74 WRKY proteins in Arabidopsis, while over 100 in rice (Oryza sativa) (10). WRKY TFs have specificity to bind W-box [TTGAC(C/T)] of promoters of their target genes, which subsequently wire genetic circuits towards downstream biological responses.20, 21

WRKY TFs can either negatively or positively trigger a certain response under stress conditions.19 These regulation patterns as well as members participating in a given condition can changes from a plant to the other. For example, WRKY54 and WRKY70 in Arabidopsis negatively regulate leaf senescence.22 While, WRKY23 positively enhanced pathogen defense and overexpression of maize WRKY58 in rice.23 and wheat WRKY1 and WRKY33 in Arabidopsis positively conferred drought and salt tolerance.24 WRKY TFs also reported to be involved in abiotic stress by wiring ABA signaling pathway.25 For example, Chrysanthemum WRKY1 enhanced abiotic stress tolerance, while cotton WRKY17 overexpressed in tobacco reduced tolerance by regulating a number of genes in ABA signaling pathway and reactive oxygen species (ROS) production.

MYB is also a family of TFs involved in response to abiotic stresses in plants.26 Of which, expression of MYB108 gene in Arabidopsis is induced in response to salt stress and participate in crosstalking between abiotic and biotic stresses via orchestration of signaling pathways of jasmonic acid (JA) and gibberellic acid (GA) 27, 28 While, MYB65 participates in GA signaling in growth and flowering processes.29 Our work also showed that the expression of this gene increased in roots in response to both stresses whereas, in leaves up-regulated only in response to salt stress. Expression of genes encoding MYB differs in different tissues in response to salt stress as MYB34 in Arabidopsis, for example, is normally upregulated in root tissue and its expression in leaves increases only in response to stress, whereas MYB47 and MYB32 were common in both tissues.28, 30

In the present study, we have demonstrated important types of TFs including WRKY and MYB that were regulated under salt stress in wild barley Hordeum spontaneum. The information recovered from this work can be helpful in improving plant salt stress tolerance in the future.

Materials and Methods

Salt stress experiment was conducted on H. spontaneum as previously described.31 Fourteen-day-old seedlings were treated with salt (500 mM NaCl) and total RNAs were harvested in a replicated experiment from leaves at 0 (control), 2, 12 and 24 h time point using Trizol (Invitrogen, Life Tech, Grand Island, NY, USA). Then, RNAs were treated with RNase-free DNase (Promega Corporation, Madison, WI, USA) and 1 U/ul of RNasin® Plus RNase Inhibitor as described (Promega Corporation, Madison, WI, USA). Total RNA samples were, then, shipped to Beijing Genomics Institute (BGI), Shenzhen, China for deep sequencing using illumina Miseq. Generated raw data were retrieved in FASTQ format and submitted to the NCBI and experiment received accession number of PRJNA227211 (https://www.ncbi.nlm.nih.gov/ bioproject?LinkName=sra_bioproject&from_uid=537429). Individual accession numbers of raw data of different samples are available in NCBI (https://www.ncbi.nlm.nih.gov/ sra?LinkName=bioproject_sra_all&from_uid=227211). Raw data was processed as described32 and clean data was subjected to genome-guided Trinity de novo transcriptome assembly (https://github.com/trinityrnaseq/trinityrnaseq/wiki/Genome-Guided-Trinity-Transcriptome-Assembly) with Hordeum vulgare genome (https://plants.ensembl.org/ Hordeum_vulgare/Info/Index, Taxonomy ID 112509) used as the guide. Differential expression and cluster analysis were done by EdgeR (version 3.0.0, R version 2.1.5) with proper algorism and fold change values of ≥ 2 measured against actin house-keeping gene. Annotation of the recovered transcripts was done using Blast2GO (http://www.blast2go.org/). Subsequent bioinformatics approach was done as described.33 Predicted CDSs were annotated against protein database in order to assign functions of transcripts. Protein domains common in TFs were identified using HMMER3 software.34

Then, RNA-Seq datasets were validated via qRT-PCR of four randomly selected genes using the Agilent Mx3000P qPCR Systems (Agilent technology, USA) as previously described.31 Transcripts selected from cluster analysis were upregulated at 2 and 12 h time points. Primer sequences are shown in Table S1. Calculations referring to expression levels of each transcript were done relative to that under control condition and barley actin gene was used as the house-keeping gene.

Results and Discussion

For validating RNA-Seq datasets, qRT-PCR was done for four randomly selected transcripts encoding transcripts that were either upregulated at 2 and 12 h time points, upregulated at 2 h time point, or downregulated at 2 and 12 h time points of salt stress and results aligned with RNA-Seq datasets for transcripts used for validation (Figure S1). Cluster analysis resulted in the recovery of over 10000 differentially expressed (DE) transcripts with fold change of ≥ 2 under salt stress including over 600 TFs highlighted in Table S2 that are separately shown in Table S3. Well-known TF families for their response to abiotic stresses include WRKY and MYB. Genes encoding WRKY activated at 2 and 12 h time points under salt stress include WRKY2, WRKY11, WRKY41, WRKY46, WRKY50 and WRKY71 (Figure 1a). Gene encoding WRKY24 was upregulated at 2 h time point only, while downregulated at 24 h time point (Figure 1c). Downregulated WRKY genes in the present study include WRKY19 and WRKY35 (Figure 1b). Genes encoding MYB under salt stress include MYB30, MYB44, MYB62, MYB3R-2 and MYB3R-4, while downregulated MYB genes include MYB1, MYB20, MYB73 and MYBS3 (Figure 2).

WRKY2 and WRKY19 were reported by Niu et al.35 to induce stress tolerance in wheat through activation of STZ (salt tolerance zinc finger) and DREB2A (dehydration-responsive element binding 2A) pathways, respectively. Although a large number of zinc finger genes11 in the present study was regulated in leaves H. spontaneum under salt stress (Table S3), STZ gene was not regulated. Then, STZ gene cannot be used in tracing regulation of WRKY2 gene. WRKY19 gene was downregulated in leaves of H. spontaneum under salt stress (Figure 1b), thus, no activation of DREB2A gene is expected. DREB2A is among AP2-ERF (Apetala2/Ethylene responsive factor) gene family and a recent report indicated that DREB2A is also affected by other TFs, ex., NAC96.28 Interestingly, two Ap2-ERF gene isoforms and a gene encoding NAC96 were upregulated in cluster 1 under salt stress in leaves of H. spontaneum (Figure 3 and Table S2) indicating that upregulation of Ap2-ERF gene can compensate the negative regulation of WRKY19 gene in H. spontaneum.

Figure 1: Up- (a), downregulated (b) and up-/downregulated (c) transcripts of WRKY family under salt stress (1 M NaCl) across 0, 2, 12 and 24 h time points in leaves of H. spontaneum. Original RNA-Seq data is shown in Table S2. Figure 1: Up- (a), downregulated (b) and up-/ downregulated (c) transcripts of WRKY family under salt stress (1 M NaCl) across 0, 2, 12 and 24 h time points in leaves of H.

Click here to View Figure

Figure 2: Up- (a) and downregulated (b) transcripts of MYB family under salt stress (1 M NaCl) across 0, 2, 12 and 24 h time points in leaves of H. spontaneum. Original RNA-Seq data is shown in Table S2. Figure 2: Up- (a) and downregulated (b) transcripts of MYB family under salt stress (1 M NaCl) across 0, 2, 12 and 24 h time points in leaves of H. spontaneum. Original RNA-Seq data is shown in Table S2.

Click here to View Figure

Figure 3: Expression pattern of transcripts encoding two DREB2A (AP2-ERF) isoforms under salt stress (1 M NaCl) across 0, 2, 12 and 24 h time points in leaves of H. spontaneum. AP2-ERF = Apetala2/ethylene responsive factor. Figure 3: Expression pattern of transcripts encoding two DREB2A (AP2-ERF) isoforms under salt stress (1 M NaCl) across 0, 2, 12 and 24 h time points in leaves of H. factor.

Click here to View Figure

Overexpression of WRKY2 gene in grapevine increased proline under salt stress.36 Two other recent reports indicated that WRKY2 in wheat37 and WRKY11 in soybean38 also drive genes encoding free proline and soluble sugars under drought stress. Proline and sugars are known as important osmolytes that neutralize the effects of salt and alleviate stress.39, 40 Interestingly, gene encoding Delta-1-pyrroline-5-carboxylate synthase (P5CS) for proline accumulation was concordantly upregulated under salt stress with that encoding ERF1 (ethylene responsive factor 1) gene, other DREB gene derivative, in cluster 32 (Figure 4 and Table S2). Then, proline accumulation due to the function of P5CS gene in H. spontaneum under salt stress can also be driven by ERF1 gene that is likely controlled by NAC96, not by either WRKY2 or WRKY11. As per expected sugar levels under salt stress in H. spontaneum, results indicated that genes encoding enzymes participating in the last step of glucose (e.g., beta-glucosidase), sucrose (e.g., sucrose synthase 6) and maltose (e.g., beta-amylase 8) biosynthesis concordantly upregulated with WRKY2 in clusters 1 and 5, while WRKY11 and MYB3R-2 in cluster 6 (Table S2) under salt stress (Figure 5). Accordingly, we speculate that WRKY 2 and WRKY11 are involved in driving genes encoding soluble sugars as two different mechanisms of salt stress tolerance in H. spontaneum.

Figure 4: Expression pattern of transcripts of DREB2A (ERF1) and P5CS concordantly upregulated under salt stress (1 M NaCl) across 0, 2, 12 and 24 h time points in leaves of H. spontaneum. P5CS2 = Delta-1-pyrroline-5-carboxylate synthase 2, ERF1 = ethylene responsive factor 1. Original RNA-Seq data is shown in Table S2. Figure 4: Expression pattern of transcripts of DREB2A (ERF1) and P5CS concordantly upregulated under salt stress (1 M NaCl) across 0, 2, 12 and 24 h time pointsClick here to View Figure
Figure 5: Expression pattern of transcripts encoding SS6, BA8, BG25, WRKY2, WRKY11 and MYB3R-2 concordantly upregulated under salt stress (1 M NaCl) across 0, 2, 12 and 24 h time points in leaves of H. spontaneum. Figure 5: Expression pattern of transcripts encoding SS6, BA8, BG25, WRKY2, WRKY11 and MYB3R-2 concordantly upregulated under salt stress (1 M NaCl) across 0, 2, 12 and 24 h time points in leaves of H. spontaneum.Click here to View Figure

Recently, WRKY11 was also proven to induce elevated levels of superoxide dismutase (SOD) and catalase in soybean.38 In the present study, upregulated WRKY11 gene does not seem to concordantly express with SOD regulated gene isoforms in H. spontaneum, where SOD gene isoforms were downregulated (Figure 6 and Table S2) as shown in clusters 2 and 27 and no other TF can likely complement WRKY11 effect whose upregulation pattern of its three isoforms in H. spontaneum was different (cluster 1). Although both genes are upregulated, WRKY11 gene does not either concordantly express with isoforms of gene encoding catalase (existing in cluster 23), but gene encoding another TF namely B-box zinc finger protein 21 (BZF21) concordantly expressed with the two isoforms of gene encoding catalase, thus, possibly drive expression of this gene in H. spontaneum instead of WRKY11 (Figure 7 and Table S2). B-box zinc finger proteins were reported to enhance salt and drought stresses tolerance in Arabidopsis (Liu et al., 2019). Interestingly, gene encoding SAUR40 also concordantly expressed with BZF21 and catalase genes in cluster 23 (Figure 7 and Table S2). SAUR40 gene is among a family acting as a regulator of cell elongation and plant growth performance41 and a stimulator of shoot elongation due to auxin signaling.42 Thus, we speculate that BZF21 might drive expression of both catalase and SAUR40 genes as genes encoding the three metabolites are concordantly expressed (Figure 7).

Participation of the two TFs, namely WRKY24 and WRKY71, as responsive elements under salt stress was argued in rice.43 However, expression patterns of isoforms of these two TFs seem to be controversial (Figure 1) as gene encoding the first was upregulated at 2 h time point and downregulated at 24 h time point, while gene encoding the second was upregulated at 2 and 12 time points. Xie et al. (19) indicated that WRKY24 gene is induced by ABA signaling, while Basu and Roychoudhury43 indicated that ABA signaling induces higher expression of WRKY71 gene and many other TFs. Interestingly, the authors indicated that WRKY24 gene showed expression even lower than that of the control untreated samples under salt stress. WRKY71 was recently reported to antagonistically act against both salt-delayed flowering and escaping salt stress in Arabidopsis through the induction of gene encoding FLOWERING LOCUS T (FT) (44). Surprisingly, two isoforms of the latter gene in clusters 4 and 8 seem concordantly downregulated with gene encoding WRKY19 of cluster 4 rather than with gene encoding WRKY71 of cluster 21 (Figure 8 and Table S2). We cannot jump to conclusions on the relationship between WRKY19 and FT genes unless an experiment to detect the consequences of WRKY19 gene being knocked out in Arabidopsis model.

Figure 6: Expression pattern of transcripts encoding SOD downregulated under salt stress (1 M NaCl) across 0, 2, 12 and 24 h time points in leaves of H. spontaneum Figure 6: Expression pattern of transcripts encoding SOD downregulated under salt stress (1 M NaCl) across 0, 2, 12 and 24 h time points in leaves of H. spontaneum

Click here to View Figure

Figure 7: Expression pattern of transcripts encoding isoforms of catalase concordantly upregulated with BZF21 and SAUR genes, Figure 7: Expression pattern of transcripts encoding isoforms of catalase concordantly upregulated with BZF21 and SAUR genes

Click here to View Figure

Aligning with the results of the present study, WRKY41 and WRKY46 were reported to positively relate to salt stress tolerance in tobacco.45 Genes encoding the two TFs were upregulated under salt stress in H. spontaneum as shown in clusters 11 and 1, respectively (Figure 1 and Table S2). Overexpressing the cotton WRKY41 gene in tobacco exhibited enhanced stomatal closure and reactive oxygen species (ROS) scavenging when plants were exposed to osmotic stress.45 WRKY46 acts in Arabidopsis in developing lateral roots under osmotic/salt stress via regulation of ABA signaling and auxin homeostasis.46 Auxin homeostasis is known to be regulated by GRETCHEN HAGEN3 or GH3 gene family in “Plant hormone signal transduction” pathway.42 In the present study, GH3.8 gene was upregulated in cluster 17 with no exact TF concordantly expressed with it (Figure 9 and Table S2). No conclusive information on the function of WRKY50 (cluster 1) is available except that it acts as a positive regulator in the salicylic acid (SA) signaling pathway and probably ABA signaling pathway in Arabidopsis, while a negative regulator in jasmonic acid (JA) signaling.47, 48 Very little is known about the mode of action of WRKY35 except that its expression participates in conferring salt stress tolerance in zoysia grass.49 We conclude that WRKY gene family participates in salt stress responses in leaves of H. spontaneum in ways different from those in other plant species.

Figure 8: Expression pattern of transcripts encoding isoforms of FT concordantly upregulated with two isoforms of WRKY19 genes under salt stress Figure 8: Expression pattern of transcripts encoding isoforms of FT concordantly upregulated with two isoforms of WRKY19 genes under salt stress

Click here to View Figure

Figure 9: Expression pattern of transcript encoding GH3.8 upregulated under salt stress (1 M NaCl) across 0, 2, 12 and 24 h time points in leaves of H. spontaneum. Figure 9: Expression pattern of transcript encoding GH3.8 upregulated under salt stress (1 M NaCl) across 0, 2, 12 and 24 h time points in leaves of H. spontaneum.

Click here to View Figure

Expression of five MYB genes, namely MYB30, MYB44, MYB62, MYB3R-2 and MYB3R-4, was proven to be increased under salt stress in leaves of H. spontaneum (Figure 2a), while expression of four, namely MYB1, MYB20, MYB73 and MYBS3, was decreased (Figure 2b). MYB30, an R2R3‐MYB TF, was studied by Gong et al.50 and results indicated that expression in the perennial wall-rocket (Diplotaxis tenuifolia L.) increased under salt stress up to 4 h time point, while gradually decreased up to 24 h time point in perfect alignment with results of the present study with regard to regulation of gene encoding this TF. MYB30 was proven to be SUMOylated by SIZ150, 51 SUMOylation represents a post-translational regulation involved in various cellular processes including response to stresses.52 Small Ubiquitin-like Modifier (SUMO) proteins, like SIZ1 and SIZ2, represent a family of small proteins covalently attached to a certain protein, while detached from others to modify target protein’s (e.g., MYB30) function. In the present study, two isoforms of MYB30 gene as well as MYB44 and MYB3R-2 genes concordantly expressed with SIZ2 gene in cluster 6 under salt stress in H. spontaneum (Figure 10 and Table S2). MYB30 also accelerates flowering both in long and short days. Early flowering is mediated by elevated expression of FLOWERING LOCUS T (FT) gene that is mainly activated by CONSTANS (CO). However, MYB30 can also drive expression of FT gene,53 a phenomenon that we speculated for WRKY19 gene under salt stress in H. spontaneum. The major difference between the possible regulation of WRKY19 or MYB30 gene is that the first is a positive activator, while the second is a negative activator of FT gene. This controversial speculated regulation of WRKY19 and MYB30 genes under salt stress in H. spontaneum is shown in Figure 11. MYB30 was also reported to participate in ABA signaling response (51), in accumulation of very-long-chain fatty acids such as waxes, phospholipids, and complex sphingolipids,54 and in promoting the expression of a subset of brassinosteroids (BRs) target genes.55, 56 No results were detected on the regulation of genes encoding any of the above-mentioned compounds under salt stress in H. spontaneum.

Figure 10: Expression pattern of transcripts encoding SIZ2 concordantly upregulated with two isoforms of MYB30 gene as well as MYB3R-2 and MYB44 under salt stress Figure 10: Expression pattern of transcripts encoding SIZ2 concordantly upregulated with two isoforms of MYB30 gene as well as MYB3R-2 and MYB44 under salt stress

Click here to View Figure

Interestingly, MYB44 was proven to be a negative regulator of ABA signaling and abiotic stresses in Arabidopsis,57 while positively increased sensitivity of seed germination to ABA58 The latter authors indicated that phosphorylation of MYB44 by MAPK is mandatory for its function. Nonetheless, Jung et al.59 indicated that MYB44 promotes stomatal closure, a characteristic shared with WRKY41 that consequently serves in conferring tolerance to abiotic stresses in Arabidopsis. Tolerance is conferred for plants overexpressing MYB44 gene because they exhibit a reduced rate of water loss, reduced rate of genes encoding serine/threonine protein phosphatases 2C (PP2Cs), then enhanced tolerance to drought and salt stress. Nonetheless, genes encoding MYB44, protein phosphatase 2C and two isoforms of protein phosphatase 1 (PP1) in the present study are concordantly expressed in cluster 6 (Figure 12 and Table S2). Explanation of concordant expression of MYB44 and genes encoding the two phosphatases might be that MYB44 was upregulated only at 2 h time point only, while the other genes were upregulated also at 12 h time point. This indicates that negative regulation of MYB44 might take place only at 12 h time point.

Figure 11: Expression pattern of transcripts encoding MYB30 and the concordantly downregulated isoforms of WRKY19 and FT genes under salt stress Figure 11: Expression pattern of transcripts encoding MYB30 and the concordantly downregulated isoforms of WRKY19 and FT genes under salt stress.

Click here to View Figure

Figure 12: Expression pattern of transcripts encoding MYB44 concordantly upregulated with genes encoding two isoforms of serine/threonine protein phosphatase Figure 12: Expression pattern of transcripts encoding MYB44 concordantly upregulated with genes encoding two isoforms of serine/threonine protein phosphatase

Click here to View Figure

(Pi) starvation-induced genes and suppression of gibberellic acid (GA) biosynthesis under nutrient stress. Authors claimed that cross-talking between Pi homeostasis and GA is an adaptive mechanism under abiotic stresses. Therefore, it is logic that MYB62 negatively regulate expression of gibberellin-regulated protein under salt stress in H. spontaneum as previously described.60 In the present study, MYB62 exists in cluster 1 whose expression of transcripts indicated upregulation at 2 and 12 h time points, while one gibberellin-regulated protein exists in cluster 4 whose expression of transcripts indicated downregulation at 2 and 12 h time points (Figure 13 and Table S2). As per MYB3R-4, Haga et al.61 indicated its participation in pleiotropic development and regulation of multiple G2/M-specific genes in Arabidopsis. None of the genes involved in the latter processes were regulated in H. spontaneum under salt stress.

Figure 13: Expression pattern of transcript encoding MYB62 that is expressed oppositely to gene encoding gibberellin-regulated protein under salt stress Figure 13: Expression pattern of transcript encoding MYB62 that is expressed oppositely to gene encoding gibberellin-regulated protein under salt stress

Click here to View Figure

MYB1, MYB20, MYB73 and MYBS3 genes were shown to be downregulated under salt stress in H. spontaneum (Figure 2b). These TFs were previously reported to negatively regulate abiotic stress tolerance in plants except for MYBS3 that was reported for its positive role in abiotic stresses, particularly cold stress tolerance in rice via mediation of a-amylase gene expression. 62 In H. spontaneum, MYBS3 seems concordantly expressed with a-amylase gene although the first exists in cluster 4, while the second exists in cluster 2 (Figure 14 and Table S2). Wang et al.63 claimed that MYB1 negatively regulates seed germination under saline conditions in Arabidopsis by regulating the levels of the stress hormone abscisic acid (ABA). Similar conclusions were reached by Gao et al.47 in their work on MYB20 in Arabidopsis with regard to the negative regulation of ABA under drought stress. Loss-of-function experiment of MYB73 gene resulted in drought or/and salt tolerance due to its negative regulation of SOS1 (salt overly sensitive 1) and SOS3 genes.64, 65 No SOS genes are regulated under salt stress in H. spontaneum.

Figure 14: Expression pattern of transcript encoding MYBS3 that concordantly downregulated with gene encoding alpha-amylase under salt stress Figure 14: Expression pattern of transcript encoding MYBS3 that concordantly downregulated with gene encoding alpha-amylase under salt stress

Click here to View Figure

Figure 15: Networking of transcription factor regulated in H. spontaneum under salt stress and their known contribution to salt stress tolerance in plants. Figure 15: Networking of transcription factor regulated in H. spontaneum under salt stress and their known contribution to salt stress tolerance in plants.

Click here to View Figure

Summary of the overall molecular networking involving transcription factors and their concordantly expressed genes along with downstream biological processes towards conferring salt stress tolerance in H. spontaneum under salt stress is shown in Figure 15.

Conclusion

In conclusion, we suggest that WRKY gene family participates in salt stress responses in leaves of H. spontaneum of which some of them follow different approaches, in terms of their regulation under salt stress as well as the downstream responsive genes, from those of other plant species. Regulation of MYB gene family in H. spontaneum seems similar, to a large extent, to that of other plant species under salt stress. The present study addressed some of the molecular mechanisms by which H. spontaneum follows under salt stress in order to stand severe salt stress. One of the important avenue towards improving salt stress tolerance is understanding the regulatory elements, e.g. transcription factors, that drive important salt-related genes. This information might be useful in subsequent breeding programs in cultivated barley and other cereal crops.

Acknowledgments

The author thanks Professor Dr. Ahmed Bahieldin for providing aliquots of total RNA collected from wild barley at different time points of salt stress for validating RNA-Seq dataset.

Funding Source

There is no funding source.

Conflict of interest

The author declares no conflict of interest.

References

  1. Ingram J, Bartels D. The molecular basis of dehydration tolerance in plants. Annual review of plant biology. 1996;47(1):377-403.
  2. Zhu J-K. Salt and drought stress signal transduction in plants. Annual review of plant biology. 2002;53(1):247-73.
  3. Shinozaki K, Dennis ES. Cell signalling and gene regulation: global analyses of signal transduction and gene expression profiles. Current Opinion in Plant Biology. 2003;6(5):405-9.
  4. Chen WJ, Zhu T. Networks of transcription factors with roles in environmental stress response. Trends in plant science. 2004;9(12):591-6.
  5. Yamaguchi-Shinozaki K, Shinozaki K. Organization of cis-acting regulatory elements in osmotic-and cold-stress-responsive promoters. Trends in plant science. 2005;10(2):88-94.
  6. Xiong L, Schumaker KS, Zhu J-K. Cell signaling during cold, drought, and salt stress. The plant cell. 2002;14(suppl 1):S165-S83.
  7. Tuteja N. Abscisic acid and abiotic stress signaling. Plant signaling & behavior. 2007;2(3):135-8.
  8. Budak H, Kantar M, Yucebilgili Kurtoglu K. Drought tolerance in modern and wild wheat. The Scientific World Journal. 2013;2013:548246.
  9. Ryu H-S, Han M, Lee S-K, Cho J-I, Ryoo N, Heu S, et al. A comprehensive expression analysis of the WRKY gene superfamily in rice plants during defense response. Plant cell reports. 2006;25(8):836-47.
  10. Eulgem T, Somssich IE. Networks of WRKY transcription factors in defense signaling. Current opinion in plant biology. 2007;10(4):366-71.
  11. Pandey SP, Somssich IE. The role of WRKY transcription factors in plant immunity. Plant physiology. 2009;150(4):1648-55.
  12. Li H, Gao Y, Xu H, Dai Y, Deng D, Chen J. ZmWRKY33, a WRKY maize transcription factor conferring enhanced salt stress tolerances in Arabidopsis. Plant Growth Regulation. 2013;70(3):207-16.
  13. Eulgem T, Rushton PJ, Robatzek S, Somssich IE. The WRKY superfamily of plant transcription factors. Trends in plant science. 2000;5(5):199-206.
  14. Ülker B, Somssich IE. WRKY transcription factors: from DNA binding towards biological function. Current opinion in plant biology. 2004;7(5):491-8.
  15. Dong J, Chen C, Chen Z. Expression profiles of the Arabidopsis WRKY gene superfamily during plant defense response. Plant molecular biology. 2003;51(1):21-37.
  16. Wei K-F, Chen J, Chen Y-F, Wu L-J, Xie D-X. Molecular phylogenetic and expression analysis of the complete WRKY transcription factor family in maize. DNA research. 2012;19(2):153-64.
  17. Ling J, Jiang W, Zhang Y, Yu H, Mao Z, Gu X, et al. Genome-wide analysis of WRKY gene family in Cucumis sativus. BMC genomics. 2011;12(1):471.
  18. Liu D, Leib K, Zhao P, Kogel K-H, Langen G. Phylogenetic analysis of barley WRKY proteins and characterization of HvWRKY1 and-2 as repressors of the pathogen-inducible gene HvGER4c. Molecular genetics and genomics. 2014;289(6):1331-45.
  19. Xie Z, Zhang Z-L, Zou X, Huang J, Ruas P, Thompson D, et al. Annotations and functional analyses of the rice WRKY gene superfamily reveal positive and negative regulators of abscisic acid signaling in aleurone cells. Plant physiology. 2005;137(1):176-89.
  20. Rushton PJ, Somssich IE, Ringler P, Shen QJ. WRKY transcription factors. Trends in plant science. 2010;15(5):247-58.
  21. Ciolkowski I, Wanke D, Birkenbihl RP, Somssich IE. Studies on DNA-binding selectivity of WRKY transcription factors lend structural clues into WRKY-domain function. Plant molecular biology. 2008;68(1-2):81-92.
  22. Besseau S, Li J, Palva ET. WRKY54 and WRKY70 co-operate as negative regulators of leaf senescence in Arabidopsis thaliana. Journal of experimental botany. 2012;63(7):2667-79.
  23. Cai R, Zhao Y, Wang Y, Lin Y, Peng X, Li Q, et al. Overexpression of a maize WRKY58 gene enhances drought and salt tolerance in transgenic rice. Plant Cell, Tissue and Organ Culture (PCTOC). 2014;119(3):565-77.
  24. He G-H, Xu J-Y, Wang Y-X, Liu J-M, Li P-S, Chen M, et al. Drought-responsive WRKY transcription factor genes TaWRKY1 and TaWRKY33 from wheat confer drought and/or heat resistance in Arabidopsis. BMC plant biology. 2016;16(1):116.
  25. Osakabe Y, Osakabe K, Shinozaki K, Tran L-SP. Response of plants to water stress. Frontiers in plant science. 2014;5:86.
  26. Rasheed S, Bashir K, Matsui A, Tanaka M, Seki M. Transcriptomic analysis of soil-grown Arabidopsis thaliana roots and shoots in response to a drought stress. Frontiers in plant science. 2016;7:180.
  27. Mengiste T, Chen X, Salmeron J, Dietrich R. The BOTRYTIS SUSCEPTIBLE1 gene encodes an R2R3MYB transcription factor protein that is required for biotic and abiotic stress responses in Arabidopsis. The Plant Cell. 2003;15(11):2551-65.
  28. Ghorbani R, Alemzadeh A, Razi H. Microarray analysis of transcriptional responses to salt and drought stress in Arabidopsis thaliana. Heliyon. 2019;5(11):e02614.
  29. Gocal GFW, Sheldon CC, Gubler F, Moritz T, Bagnall DJ, MacMillan CP, et al. GAMYB-like genes, flowering, and gibberellin signaling in Arabidopsis. Plant physiology. 2001;127(4):1682-93.
  30. Bhargava A, Clabaugh I, To JP, Maxwell BB, Chiang Y-H, Schaller GE, et al. Identification of cytokinin-responsive genes using microarray meta-analysis and RNA-Seq in Arabidopsis. Plant Physiology. 2013;162(1):272-94.
  31. Bahieldin A, Atef A, Shokry AM, Al-Karim S, Al Attas SG, Gadallah NO, et al. Structural identification of putative USPs in Catharanthus roseus. Comptes rendus biologies. 2015;338(10):643-9.
  32. Bolger AM, Lohse M, Usadel B. Trimmomatic: a flexible trimmer for Illumina sequence data. Bioinformatics. 2014;30(15):2114-20.
  33. Bahieldin A, Atef A, Edris S, Gadalla NO, Ramadan AM, Hassan SM, et al. Multifunctional activities of ERF109 as affected by salt stress in Arabidopsis. Scientific reports. 2018;8(1):1-10.
  34. Eddy SR. A new generation of homology search tools based on probabilistic inference. Genome Informatics 2009: Genome Informatics Series Vol 23: World Scientific; 2009. p. 205-11.
  35. Niu CF, Wei WEI, Zhou QY, Tian AG, Hao YJ, Zhang WK, et al. Wheat WRKY genes TaWRKY2 and TaWRKY19 regulate abiotic stress tolerance in transgenic Arabidopsis plants. Plant, cell & environment. 2012;35(6):1156-70.
  36. Mzid R, Zorrig W, Ayed RB, Hamed KB, Ayadi M, Damak Y, et al. The grapevine VvWRKY2 gene enhances salt and osmotic stress tolerance in transgenic Nicotiana tabacum. 3 Biotech. 2018;8(6):277.
  37. Gao H, Wang Y, Xu P, Zhang Z. Overexpression of a WRKY transcription factor TaWRKY2 enhances drought stress tolerance in transgenic wheat. Frontiers in plant science. 2018;9:997.
  38. Wang Y, Jiang L, Chen J, Tao L, An Y, Cai H, et al. Overexpression of the alfalfa WRKY11 gene enhances salt tolerance in soybean. PLoS One. 2018;13(2):e0192382.
  39. Hu CA, Delauney AJ, Verma DP. A bifunctional enzyme (delta 1-pyrroline-5-carboxylate synthetase) catalyzes the first two steps in proline biosynthesis in plants. Proceedings of the National Academy of Sciences. 1992;89(19):9354-8.
  40. Hajrah NH, Obaid AY, Atef A, Ramadan AM, Arasappan D, Nelson CA, et al. Transcriptomic analysis of salt stress responsive genes in Rhazya stricta. PloS one. 2017;12(5):e0177589.
  41. Knauss S, Rohrmeier T, Lehle L. The auxin-induced maize gene ZmSAUR2 encodes a short-lived nuclear protein expressed in elongating tissues. Journal of Biological Chemistry. 2003;278(26):23936-43.
  42. Paponov IA, Paponov M, Teale W, Menges M, Chakrabortee S, Murray JAH, et al. Comprehensive transcriptome analysis of auxin responses in Arabidopsis. Molecular Plant. 2008;1(2):321-37.
  43. Basu S, Roychoudhury A. Expression profiling of abiotic stress-inducible genes in response to multiple stresses in rice (Oryza sativa L.) varieties with contrasting level of stress tolerance. BioMed research international. 2014;2014:706890.
  44. Yu Y, Wang L, Chen J, Liu Z, Park C-M, Xiang F. WRKY71 acts antagonistically against salt-delayed flowering in Arabidopsis thaliana. Plant and Cell Physiology. 2018;59(2):414-22.
  45. Chu X, Wang C, Chen X, Lu W, Li H, Wang X, et al. The cotton WRKY gene GhWRKY41 positively regulates salt and drought stress tolerance in transgenic Nicotiana benthamiana. PLoS One. 2015;10(11):e0143022.
  46. Ding ZJ, Yan JY, Li CX, Li GX, Wu YR, Zheng SJ. Transcription factor WRKY 46 modulates the development of Arabidopsis lateral roots in osmotic/salt stress conditions via regulation of ABA signaling and auxin homeostasis. The Plant Journal. 2015;84(1):56-69.
  47. Gao S, Zhang YL, Yang L, Song JB, Yang ZM. AtMYB20 is negatively involved in plant adaptive response to drought stress. Plant and soil. 2014;376(1-2):433-43.
  48. Luo D-l, Ba L-j, Shan W, Kuang J-f, Lu W-j, Chen J-y. Involvement of WRKY transcription factors in abscisic-acid-induced cold tolerance of banana fruit. Journal of agricultural and food chemistry. 2017;65(18):3627-35.
  49. Wang J, An C, Guo H, Yang X, Chen J, Zong J, et al. Physiological and transcriptomic analyses reveal the mechanisms underlying the salt tolerance of Zoysia japonica Steud. BMC plant biology. 2020;20(1):1-16.
  50. Gong Q, Li S, Zheng Y, Duan H, Xiao F, Zhuang Y, et al. SUMOylation of MYB30 enhances salt tolerance by elevating alternative respiration via transcriptionally upregulating AOX1a in Arabidopsis. The Plant Journal. 2020;102(6):1157-71.
  51. Zheng S, Tasnif Y, Hebert MF, Davis CL, Shitara Y, Calamia JC, et al. Measurement and compartmental modeling of the effect of CYP3A5 gene variation on systemic and intrarenal tacrolimus disposition. Clinical Pharmacology & Therapeutics. 2012;92(6):737-45.
  52. Hay RT. SUMO: a history of modification. Molecular cell. 2005;18(1):1-12.
  53. Liu L, Zhang J, Adrian J, Gissot L, Coupland G, Yu D, et al. Elevated levels of MYB30 in the phloem accelerate flowering in Arabidopsis through the regulation of FLOWERING LOCUS T. PloS one. 2014;9(2):e89799.
  54. Raffaele S, Vailleau F, Léger A, Joubès J, Miersch O, Huard C, et al. A MYB transcription factor regulates very-long-chain fatty acid biosynthesis for activation of the hypersensitive cell death response in Arabidopsis. The Plant Cell. 2008;20(3):752-67.
  55. Li L, Yu X, Thompson A, Guo M, Yoshida S, Asami T, et al. Arabidopsis MYB30 is a direct target of BES1 and cooperates with BES1 to regulate brassinosteroid‐induced gene expression. The Plant Journal. 2009;58(2):275-86.
  56. Ashraf M, Akram NA, Arteca RN, Foolad MR. The physiological, biochemical and molecular roles of brassinosteroids and salicylic acid in plant processes and salt tolerance. Critical Reviews in Plant Sciences. 2010;29(3):162-90.
  57. Jaradat MR, Feurtado JA, Huang D, Lu Y, Cutler AJ. Multiple roles of the transcription factor AtMYBR1/AtMYB44 in ABA signaling, stress responses, and leaf senescence. BMC Plant Biology. 2013;13(1):192.
  58. Nguyen XC, Hoang MHT, Kim HS, Lee K, Liu X-M, Kim SH, et al. Phosphorylation of the transcriptional regulator MYB44 by mitogen activated protein kinase regulates Arabidopsis seed germination. Biochemical and biophysical research communications. 2012;423(4):703-8.
  59. Jung C, Seo JS, Han SW, Koo YJ, Kim CH, Song SI, et al. Overexpression of AtMYB44 enhances stomatal closure to confer abiotic stress tolerance in transgenic Arabidopsis. Plant physiology. 2008;146(2):623-35.
  60. Devaiah BN, Madhuvanthi R, Karthikeyan AS, Raghothama KG. Phosphate starvation responses and gibberellic acid biosynthesis are regulated by the MYB62 transcription factor in Arabidopsis. Molecular plant. 2009;2(1):43-58.
  61. Haga N, Kobayashi K, Suzuki T, Maeo K, Kubo M, Ohtani M, et al. Mutations in MYB3R1 and MYB3R4 cause pleiotropic developmental defects and preferential down-regulation of multiple G2/M-specific genes in Arabidopsis. Plant Physiology. 2011;157(2):706-17.
  62. Su C-F, Wang Y-C, Hsieh T-H, Lu C-A, Tseng T-H, Yu S-M. A novel MYBS3-dependent pathway confers cold tolerance in rice. Plant physiology. 2010;153(1):145-58.
  63. Wang T, Tohge T, Ivakov A, Mueller-Roeber B, Fernie AR, Mutwil M, et al. Salt-related MYB1 coordinates abscisic acid biosynthesis and signaling during salt stress in Arabidopsis. Plant Physiology. 2015;169(2):1027-41.
  64. Cominelli E, Galbiati M, Vavasseur A, Conti L, Sala T, Vuylsteke M, et al. A guard-cell-specific MYB transcription factor regulates stomatal movements and plant drought tolerance. Current biology. 2005;15(13):1196-200.
  65. Kim JH, Nguyen NH, Jeong CY, Nguyen NT, Hong S-W, Lee H. Loss of the R2R3 MYB, AtMyb73, causes hyper-induction of the SOS1 and SOS3 genes in response to high salinity in Arabidopsis. Journal of Plant Physiology. 2013;170(16):1461-5.


A Strategic Production Improvement of Streptomyces Beta Glucanase Enzymes with Aid of Codon Optimization and Heterologous Expression

$
0
0

Introduction

β- glucan is a chief constituent of sub-aleurone and endosperm cell wall of cereals, found as (1→4)-(1→3) linked β-D-glucopyranose units.1,2,3 Major cereal β-glucan sources are barley and oats and lesser present in rye, wheat, rice, maize, sorghum and millet.4,5 β-glucan rich cereals improve human health6,7 and often used  as a dietary replacement of antibiotics in animal feeds.8 β-glucan rich barley is the principal component in breweries, which increases flavor, colour and nutritional properties.9 Besides these beneficial effects, it impairs the energy metabolism in animals such as cattle and poultry and also creates problems in the brewing industry which include inefficient filtration, gels and hazes formations that affects the flavour and taste of beer.10 The addition of exogenous β-glucanases (E.C. 3.2.1.x) can  circumvent these negative effects.

β-glucanases can function as exo- and endo-hydrolayes. Exo-enzymes hydrolyses the glycosidic bonds serially from non-reducing ends, while endo-enzymes randomly cuts internal bonds. On account of the type of glycosidic bond cleavage, they are further classified as β-1,4-glucanases, β-1,3-glucanases, β-1,6-glucanases, β-1,4- 1,3-glucanases etc.11 In cereal β-glucan, around 70% of glycosidic linkage is β-(1→4) and the remaining 30% is β-(1→3), hence the complete hydrolysis necessitates the synergic action of different β-glucanases. The ever-growing global demand for beverages and feed enzyme in the market puts significant pressure on industries and thus indirectly raises the future demand of β-glucanases. The major problem related to beta-glucanase commercial availability is the production cost. Few pure β-glucan products are offered from some companies that can be used as the substrate for β-glucanases and these are highly expensive, which in turn increases the overall production outlays of the enzymes. Regarding large scale production, heterologous production has proved to be a better alternative to conventional production.

Industrial enzymes from Streptomyces spp., exclusively isolated from unexplored habitats like Western Ghats regions in Kerala that boasts of unique biodiversity (recognized by UNESCO as a World Heritage Site), are more versatile than other bacterial and fungal enzymes with immense physiochemical properties.12, 13 Unfortunately, the heterologous expression may not deliver the expected outcomes due to high GC content and divergence in codon usage. Heterologous expression with the codon-optimization strategy in enzyme encoding genes has a significant impact on the industrial production of enzymes. The present study details the isolation and purification of exo-β-1,4-glucanase (exo14) and endo-β-1,3-glucanase (endo13) enzymes respectively from  Streptomyces althioticus TBG-MR17 and Streptomyces cinereoruber subsp. cinereoruber TBG-AL13 strains, isolated from the Western Ghats habitats of Kerala. The enzyme producing genes were isolated and codon optimized for obtaining high level expression in E. coli host. The over-expressed enzymes were purified and characterised for the efficient degradation of beta-glucan substrates.

Materials and Methods

Beta Glucanases Gene Amplification, Cloning and Sequencing

PCR amplicons of exo14 and endo13 genes from Streptomyces althioticus TBG-MR17 and Streptomyces cinereoruber subsp. cinereoruber TBG-AL13 strains, respectively, were generated using EX4F/EX4R and EN3F/EN3R primers designed from the conserved regions of exo-β-1,4-glucanase and endo-β-1,3-glucanase genes retrieved from the phylogenetic neighboring species of above mentioned Streptomyces strains available in the NCBI database. PCR program included an initial denaturation at 95 ºC for 2 min followed by 35 cycles of denaturation at 95 ºC for 1 min, annealing at 66 ºC for 30 sec and extension at 72 °C for 1.30 sec and a final extension at 72°C for 5 min. The purified amplicons were cloned into pGEM®-T Easy Vector (Promega, USA), transformed to DH5α E. coli cells and sequenced using primers TvectF/TvectR. The primer sequences were shown in Supplementary Table 1.

Sequence Analysis

Open reading frames (ORF) of sequences were determined and the nucleotide sequences were translated to protein, using the ExPASy Translate tool (http://web.expasy.org/translate/). Functional domains and motifs were recognized using the NCBI conserved domain database (CDD) search.14 Signal peptide cleavage sites were predicted by SignalP v4.1 (http://www.cbs.dtu.dk/services/SignalP/). Physico-chemical  parameters like molecular weight, theoretical isoelectric point (pI), instability index, half-life, the number of positive (+R) and negative residues (-R), aliphatic index, extinction coefficient and grand average of hydropathicity (GRAVY) values were determined by the EXPASY tool ProtParam (http://web.expasy.org/protparam/).15

Codon Optimization and Gene Synthesis

According to the E. coli codon preference, Streptomyces spp. exo14 and endo13 genes were optimized using the GeneArt™ GeneOptimizer® expert software (Life Technologies-Invitrogen) by employing an approach of sliding window algorithm with multiparametric optimization of DNA sequences considering codon usage, GC content, ribosomal entry sites, and RNA instability motifs. The optimized genes (optexo14 and optendo13) were synthesised as oligonucleotides and assembled by an overlapping batch-Polymerase Extension Reaction. The assembled fragments were cloned into a pMA-T vector (GeneartTM, Germany) and transformed into E. coli K12 OmniMAX™ 2 T1R cells. The purified plasmid constructs were amplified with primers pmaXf/pmaXr (for optexo14) and pmaNf/pmaNr (for optendo13) and verified by sequencing.

Vector Construction

PCR amplification of wild (wl) genes from pGEMT construct and optimized (opt) genes from pMA-T construct were carried out in 20 µL of a reaction mixture comprising 1 µL of 20 ng plasmid, 10 ng of each primer and 10 µL Phusion™ Flash High-Fidelity Master Mix. Primers wlEX-f/wlEX-r and wlEN-f/wlEN-r used correspondingly for wild exo14 and endo13 gene amplifications. Optimized exo14 and endo13 gene amplifications were carried out using primers optEX-f/optEX-r and optEN-f/optEN-r, respectively. Fast and two-step PCR amplification was performed in a temperature profile of an initial denaturation at 98 ºC for 10 sec followed by 30 cycles of denaturation at 98 ºC for 1 sec, extension at 72 °C for 15 sec and a final extension at 72 °C for 1 min. Purified amplicons were cloned into pET101 D-TOPO® vector and transformed to TOP10 E. coli as described by the manufacture’s protocol. The recombinant constructs were validated by restriction digestion using restriction enzymes EcoRI and ClaI for both wl and opt exo14 constructs and EcoRI and SacI for wl and opt endo13 constructs. Finally, the recombinant constructs were sequenced using primers T7 and T7 Reverse to confirm the insertion of the construct is in the frame with proper C-terminal fusion tags.

Protein Expression

BL21 StarTM (DE3) E. coli cells were transformed with pET101 D-TOPO wild (pET101/wlexo14 and pET101/wlendo14) and optimized (pET101/optexo14 and pET101/optendo14) expression constructs. The protein expression was induced with 1 mM IPTG in Terrific Broth (TB) containing 50 μg.mL-1carbenicillin. The proteins were harvested by incubating the cells on ice for 30 min after resuspending in lysis buffer (Sodium phosphate, 50 mM;  NaCl, 500 mM; Imidazole, 10 mM) with 1 mg.ml-1 lysozyme, 1% (v/v) protease inhibitor cocktail (Sigma, P8849), 10 μg.mL-1RNase A and 5 μg.mL-1 DNase.

SDS-PAGE and Western Blot Analysis

SDS-PAGE was performed on 12% gel, prepared using TGX™ FastCast™ Acrylamide Kit (Bio-Rad, USA) and stained with Coomassie Brilliant Blue R250. Protein bands were quantified by densitometry using ImageJ v1.52a (NIH, USA) software. For Western blot, the resolved protein samples in SDS-PAGE were transferred to Immobilon®-P PVDF membrane (Merk, India) in a TV100-EBK mini electroblotters (SCIE-PLAS, Cambridge, UK). The membrane was blocked using 5% non-fat dry milk in TBST buffer for 1 h at room temperature, then followed three times washing with TBST buffer. Then it was incubated with Anti-V5-HRP Antibody (1:2000 dilution in TBST) overnight at 4 °C with continuous shaking. After washing twice with TBST, the blot was developed by Di-aminobenzoic acid (DAB) stain and photographed.

Comparison of Protein Quantity and Enzyme Activity of Wild and Optimized Expressions

Protein concentration was determined by Bradford Protein Assay kit (Bio-Rad Laboratories, USA) with bovine serum albumin (BSA) as a standard.16 The enzyme activity of wild, optimized exo14 and wild, optimized endo13 was assayedusing0.5% (w/v) Avicel® PH-10 and 0.2% (w/v) CM-curdlan as substrates, respectively. The assay mixture (substrate, 100mM sodium- acetate buffer, pH- 5.0) was incubated with the enzyme at 37 °C for 1 h and the reaction was stopped by adding DNS reagent.17 The released reducing sugars were quantified by measuring A540. One unit of enzyme activity was denoted as the amount of enzyme required to releasing 1 µmol of reducing sugar from the corresponding substrate per minute.

Purification by Nickel Affinity Chromatography

The soluble crude lysates of recombinant optimised exo14 and endo13 proteins were subjected to Nickel affinity chromatography using Profinity™ IMAC (immobilized metal affinity chromatography) Nickel charged resin (Bio-Rad, USA) in Bio-Scale MT10 12 x 88 mm column (Bio-Rad, USA). A Column containing 2 mL nickel resin was equilibrated with binding buffer (5 mM imidazole). Then the crude clear lysate was loaded into the column and incubated at room temperature for 1h. The column was washed with 5 column volume of wash buffer (10 mM imidazole). Finally the proteins were eluted into elution buffer (250 mM imidazole). The purified proteins were desalted and concentrated using Amicon® Ultra-15 Centrifugal Filters, 30K (Merk Millipore, Ireland) and documented on 12% SDS gel. The total activity, total protein, specific activity, yield and fold purification of affinity purified proteins were calculated.

Effect of Temperature and pH

Temperature optimum for purified optexo14 and optendo13 activities were determined by incubating the purified enzymes at various temperature ranges from 20-80 °C in 100mM sodium- acetate buffer (pH- 5.0) with substrates (Avicel for exo14 and CM-curdlan for endo13) for 1h and for determining thermostability, the enzymes was pre-incubated at 50-80 °C without substrate in 100mM sodium- acetate buffer (pH- 5.0) for 5h.

The optimum pH was determined by conducting enzyme assays in various ranges of pH from 2.0-10.0 at optimum temperature and the activity was calculated. The buffers (0.1M) used were KCl-HCl buffer (pH 2.0), Glycine-HCl buffer (pH 3.0), Sodium-Acetate buffer (pH 4.0-5.0), Citrate buffer (pH 6.0), Citrate-Phosphate Buffer (pH 7.0), Phosphate Buffer (pH 8.0), Tris-HCl Buffer (pH 9.0) and Carbonate-Bicarbonate Buffer (pH10.0).The pH stability of enzymes were estimated by pre-incubating the enzyme solution with buffers at different pH ranges from 2.0-10.0 at optimum temperature for 6 h and the enzyme assays were performed with specific substrates.

Substrate Specificity

The hydrolysing efficiency of purified enzymes on various substrates was determined by performing an enzyme assays containing 100 µg of enzyme with different substrates such as Avicel (0.5%), CM-Curdlan (0.5%), Barley β-glucan (0.5%), salicin (0.5%), carboxy methylcellulose (CMC) (0.5%), birchwood xylan (0.5%) and chitin (0.5%)under optimal conditions for each enzyme.

Effect of Inhibitors and Metal Ions

The influence of metal ions Mg2+, Co2+, Mn2+, Ca2+, Cu2+, Fe2+, Zn2+, Ag+, K+ and Na+ were determined by pre-incubating the purified enzymes with 5mM concentrations of MgSO4, CoCl2, MnCl2, CaCl2, CuSO4, FeSO4, ZnSO4, AgNO3, KI and NaCl respectively. The enzyme activities were determined by standard assay under optimum conditions.

Kinetic Parameters

The kinetic constants such as Km and Vmax of purified enzymes were analysed under optimal assay conditions by incubating the enzyme with 2-100mM concentrations of barley β-glucan as a substrate. The Km and Vmax were determined by the Lineweaver-Burk plot using nonlinear regression analysis of GraphPad Prism version 8.0.

Data Analysis

All experiments were conducted in triplicate and the values were given as mean±SE. Analysis of data and graphical conversions were done by GraphPad Prism version 8.0.

GenBank Submissions and Culture Submissions

The native gene sequences were deposited in the GenBank database under the accession numbers of MG983485 (exo14) and MH719000 (endo13). Codon optimised synthetic gene constructs were deposited in GenBank under the accession numbers of MN175689 (optexo14) and MN200435 (optendo13).

Results

Beta Glucanases Gene Amplification, Cloning and Sequencing

The exo14 and endo13 genes correspondingly from Streptomyces althioticus TBG-MR17 and Streptomyces cinereoruber subsp. cinereoruber TBG-AL13 (Supplementary Fig. S1) were amplified and cloned into pGEMT vector which resulted in pGEMT/exo14 and pGEMT/endo13 constructs. The open reading frames (ORFs) were determined after sequencing, assembling and vector screening. The ORF of exo14 encoded 1737 bp corresponding 578 putative amino acids (Fig. 1a) and endo13 encoded 1293 bp corresponding 430 amino acids (Fig. 1b). Sequence analysis confirms both polypeptide sequence contains a signal peptide sequence, catalytic domain and carbohydrate binding module. The physicochemical properties of predicted proteins were computed using ExPASy ProtParam are shown in Table 1.

Figure 1: Putative protein coding amino acid sequences (a) exo14 protein containing 578 amino acids (b) endo13 protein containing 438 amino acids. Figure 1: Putative protein coding amino acid sequences (a) exo14 protein containing 578 amino acids (b) endo13 protein containing 438 amino acids.

Click here to View Figure

Table 1: Physicochemical properties of proteins exo14 and endo13

Parameters exo14 endo13
No of amino acid residues 578 430
Molecular weight (Daltons) 61152.67 44360.76
Chemical formula C2661H4046N742O892S14 C1918H2956N582O615S11
Theoretical PI 4.34 8.11
+R residues 38 33
-R residues 76 31
Extinction coefficient 111270-111645 79410-79910
Instability index 24.65 29.37
Aliphatic index 66.26 59.35
Estimated half-life in E.coli >10 hours >10 hours
GRAVY -0.446 -0.424

Codon Optimization and Gene Synthesis

To increase the Streptomyces exo14 and endo13 gene expression in E. coli, the codons were optimized in silico according to E. coli codon preference without altering amino acid sequences. The optimized and denovo synthesised genes were cloned into pMA-T cloning vectors. The GeneOptimizer® program changed 431 codons out of 578 total codons of exo14 wild sequence (72% of changes), and also changed the codon adaptation index (CAI) from 0.73 (wlexo14) to 0.97 (optexo14). Additionally, overall GC content was decreased from 69 to 49%. Codon optimization of endo13 gene by GeneOptimizer® changed 324 codons out of total wild type 430 codons (75%). The CAI was improved from 0.67 (wlendo13) to 0.98 (optendo13) and GC was reduced from 71 to 53%. Wild and optimized exo14 and endo13 gene sequences with corresponding amino acid sequences are shown in Supplementary Fig. S2 and S3 respectively.

Vector Construction and Overexpression of Beta Glucanases

Champion™ pET101 directional TOPO® Expression System was used for the expression of wild and optimized exo14 and endo13 genes in E. coli. Phusion™ Flash High-Fidelity amplified blunt-end PCR products from pGEM-T and pMA-T constructs were directly cloned to the pET101 expression vector. The schematic representation of recombinant expression constructs architecture is shown in Fig. 2. One Shot® TOP10 E. coli harboured plasmids were purified and the presence of beta glucanase genes was confirmed by restriction analysis. The sequencing confirmed the insertion of genes within the vector was in the correct frame and right orientation with V5-epitope tag and 6x His tags at C-terminal end.

Figure 2: Schematic representation of recombinant expression constructs Figure 2: Schematic representation of recombinant expression constructs

Click here to View Figure

The protein expressions were induced in E. coli BL21 StarTM (DE3) strains. Wild and optimized exo14 protein showed expression on 4th h when induced with 1mM IPTG at 37°C, while both wild and optimized endo13 protein displayed expression in 0.5mM IPTG at 27°C on 4th h. The detected proteins in lysate supernatant as soluble fractions indicated that it was transported to periplasmic space using signal sequences. The approximate molecular weight of induced proteins determined from the SDS-PAGE was around 70 kDa for both wild and optimised exo14 proteins (Fig. 3a), which is anomalously higher molecular weight than expected ~61 kDa (after removing signal peptide, but including V5-epitope tag and His-tag). According to Graceffa et al.18 and Alves et al.19 the anomalous slow migration might be due to the great proportion of acidic amino acids. The exo14 protein has high acidic amino acids which were already determined by in silico computation of physico-chemical parameters. (Table 1). The endo13 proteins exhibited around 44 kDa protein (with V5-epitope tag and His-tag), which is almost equal to the theoretical molecular weight determined in silico (Fig. 3a). The intensity of each band was determined by densitometry, using ImageJ software. The relative fold expression levels of optimized proteins were calculated based on the percentage peak area of each intensity plots (Figure 3b). In both cases, the sequence optimization produced substantially elevated levels of expression than the native ones.A Comparison of expression levels of wild and optimized proteins is shown in Table 2. Optexo14 revealed a 13 fold increase in protein expression when compared with a wild genes, whereas optendo13 showed only a 3.75 fold increase in expression when relating with wild genes, which is comparatively less than exo14 protein. The results from initial expression studies were confirmed further by western blot analysis of expressed recombinant proteins using Anti-V5-HRP Antibody (Figure 3c).

Figure 3: Overexpression of wild and optimized exo14 and endo13 proteins. Figure 3: Overexpression of wild and optimized exo14 and endo13 proteins.

Click here to View Figure

Table 2: Comparison of CAI, GC content and expression profile of wild and optimized genes

Protein Length CAI* GC% Codon Altered (No) Codon Altered (%) Ratio of Expression** Expression Statistics
wl opt wl opt
exo14 578 0.73 0.97 69 49 431 74 1:13 +
endo13 430 0.67 0.98 71 53 324 75 1:3.75 +

* CAI-codon adaptation index- is a measure of the relative adaptiveness values of the used codons that represents the ratio of the frequency of codons used in an expression system and frequency of synonymous codons for the same amino acid. This provides a value of 1 for optimal codon and less frequently used codons are scaled down accordingly. **Ratio of expression calculated by analysing the intensity of each band as the percentage peak area of intensity plots using ImageJ (NIH, USA) gel quantification through densitometry.

Comparison of Enzyme Activity and Protein Quantification

The analysis of recombinant crude enzyme activities of proteins expressed in E. coli BL21 StarTM (DE3) cells showed both the codon-optimised proteins have higher activity in comparison to the native ones. The recombinant exo-β-1,4-glucanase encoded by optexo14 gene showed 16.56 fold increase in the functional activity and 12.96 fold increase in protein concentration than native exo14 protein (Fig. 4a). The endo-β-1,3-glucanase produced by the optendo13 gene gave 6.32 fold increase in activity and 5.19 fold increase in protein concentration (Fig. 4b). While comparing with densitometry experiments, nearly a similar pattern of fold increases were detected in both protein concentrations.

Figure 4: Comparative recombinant enzyme activities and protein contents of the wild and optimised β-glucanase gene expressing recombinant E. Figure 4: Comparative recombinant enzyme activities and protein contents of the wild and optimised β-glucanase gene expressing recombinant E.

Click here to View Figure

Purification and Functional Assay of Optimised Recombinant Beta Glucanases

The Profinity™ IMAC Nickel charged resin purification and SDS-PAGE analysis of highly expressed optexo14 and optendo13 proteins showed homogenous nature as detectable single bands with corresponding  molecular mass of 70 kDa and 44 kDa, respectively. Purification of 100mL of Terrific Broth (TB) culture yielded 42 mg.mL-1 of optexo14 protein with 72.0 U.mg-1 exo-β-1,4-glucanase activity and optendo13 protein yielded 11mg.mL-1 protein with 65.63 U.mg-1 endo-β-1,3-glucanase activity. The yields of the enzymatic activities were 57% for exo-β-1,4-glucanase and 67% for endo-β-1,3-glucanase, considering the total activity in the crude extract as 100%. The details of the purification are summarized in Table 3.

Table 3: Purification of optexo14 and optendo13 proteins

optexo14
Step Volume (mL) Total Activity (U.mL-1) Total Protein (mg.mL-1) Specific Activity (U.mg-1) Yield (%) Purification Fold
Crude Extract 5 5300 830 6.3 100 1
Ni2+ Affinity Column 1 3024 42 72.0 57.0 11.42
optendo13
Crude Extract 5 1076 322 3.34 100 1
Ni2+ Affinity Column 1 722 11 65.63 67.1 19.64

Physico-Chemical Properties of Purified Optimized Beta Glucanases

The optexo14 showed the best activity at 50°C, whereas optendo13 showed the best activity at 60°C (Fig. 5a). Optexo 14 showed evident activity at 50°C and 60°C with 25% enzyme activity retaining at 70°C even after 120 min incubation (Fig. 5b). Optendo13 has shown similar retainment of activity at these temperatures and the enzyme activity was retained to 10% even after 240 mins of incubation at 80°C (Fig. 5c). Optexo14 showcased stability and desirable activity at pH 6 and 7 with maximum activity at pH 7.0, while for optendo 13 it was from pH 4 to 8 with maximum activity at pH 6 (Fig 5d, 5e, 5f).

Figure 5: Influence of temperature and pH on optexo14 and optendo13 activities and stabilities. Figure 5: Influence of temperature and pH on optexo14 and optendo13 activities and stabilities.

Click here to View Figure

At optimum temperature and pH optexo14 showed 100% activity towards Avicel, 80% towards barley β-glucan and only 22% to CMC, whereas it showed no activity towards CM-Curdlan, birchwood xylan and chitin. Optendo13 was highly active towards CM-Curdlan and showed 60% activity towards barley β-glucan, but no hydrolysis was observed with CMC, Avicel, birchwood xylan and chitin (Table 4). Both optexo14 and optendo13 activities were highly stimulated by metal ion Mn2. Ca2+ and Mg2+ also showed some positive effect on the optexo14.  Zn2+ witnessed high inhibitory activity on optexo14, whereas it increased the activity of optendo13. Common inhibitory metal ions of both enzymes were Fe2+, Cu2+, Co2+ and KI. The inhibitors such as EDTA, DTT, β-mercaptoethanol and SDS had detrimental effects on both optexo14 and optendo13 activities while PMSF and Triton X-100 produced minor positive effects (Table 5). The purified recombinant optexo14 showed a Km value of 7.508 mM and Vmax value of 58.62 µM.min-1.mg-1 and recombinant optendo13 showed Km value of 9.221 mM and Vmax value of 95.51 µM.min-1.mg-1 using the substrate barley β-glucan. Low Km values of both enzymes indicating the high affinity towards the substrate barley β-glucan (Fig. 6).

Figure 6: Michaelis–Menten plot for recombinant enzymes. (a) optexo14 and (b) optendo13 with barley β-glucan as substrate. Figure 6: Michaelis–Menten plot for recombinant enzymes. (a) optexo14 and (b) optendo13 with barley β-glucan as substrate.

Click here to View Figure

Table 4: Substrate specificity of optexo14 and optendo13 proteins

Substrate Description Relative Activity (%)
optexo14 optendo13
Avicel (1,4)- β-glycosidic linkage 100 ± 3 0
Barley β-glucan (1,4)-and (1,3)- β-glycosidic linkage 80 ± 5 60 ± 5
Carboxy methyl cellulose (1,4)-β-glycosidic linkage 22 ± 4 0
CM-Curdlan (1,3)- β-glycosidic linkage 0 100 ± 4
Birch wood xylan (1,4)- β- xylopyranose linkage 0 0
Chitin (1,4)- β-glycosidic linkage 0 0

The values were expressed as relative activities (%) to the maximal activity. The maximum activity was defined as 100%. The results are presented as mean ± standard deviations (n=3).

Table 5: The effect of metal ions and inhibitors on optexo14 and optendo13 activities

Metal Ions and Inhibitors Relative Activity (%)
optexo14 optendo13
Control 100 ± 6 100 ± 3
Mg2+ 108 ± 7 80 ± 7
Co2+ 65 ± 4.4 7.8 ± 2.8
Mn2+ 175 ± 5 143 ± 1.8
Ca2+ 118 ±3.4 92 ± 3.4
Cu2+ 37 ± 2.7 40 ± 2.7
Fe2+ 20 ± 3.5 90 ± 3.5
Zn2+ 11 ± 6.2 120 ± 3.2
Ag+ 103 ± 6 125 ± 6
KI+ 98 ± 1.88 82.8 ± 1.9
Na+ 100 ± 7 97 ± 1.32
EDTA 89 ± 8 17 ± 3.4
DTT 45 ± 7 70 ± 6
PMSF 103 ± 3.5 102 ± 3.5
ß-ME 50 ± 6.2 64 ± 5
SDS 94 ± 5 92 ± 5
Triton X-100 120 ± 4.3 113 ± 4.3

The values were expressed as relative activities (%) to the maximal activity. The maximum activity was defined as 100%. The results are presented as mean ± standard deviations (n=3)

Discussion

Recent developments in sequence optimization by frequently used host cell codons combined with de novo synthesis of genes deliver more significant impacts on recombinant protein expression tailored for precise industrial applications. The isolated beta glucanase genes, exo14 and endo13 from Streptomyces althioticus TBG-MR17 and Streptomyces cinereoruber subsp. cinereoruber TBG-AL13, respectively, were codon optimized for efficient expression in E. coli. The GeneOptimizer® expert program used in the present study has a deterministic algorithm implemented as a sliding window approach, which executes the sequences as unidirectional as normally within the cell that starts from 5’ and ends at 3’. GeneOptimizer algorithm considers more than 50 parameters to determine the optimal gene sequence for further consistent and higher level expression without changing the protein sequence.20 To improve the expression of exo14 (exo-β-1,4-glucanase) and endo13 (endo-β-1,3-glucanase) genes isolated from Streptomyces spp., the variances in the relative codon adaptiveness between the expression host E. coli and Streptomyces spp. were considered in detail, then codon usage was adapted according to E. coli codon bias resulting CAI value of 0.97 and also the GC content adjusted to acquire prolonged mRNA half- life and better expression. The elevated GC content of target genes against E. coli codon bias could be the major cause of declined protein expression in E. coli host,21 hence, the GC content of both gene sequences (~70%) was reduced as per to E. coli genome GC content (~50%).

pET101 directional TOPO® Expression vector (5753 bp) was used for this study due to their high success rate in the production of recombinant proteins22,23,24 and also the action of topoisomerase assists the direct integration of blunt end PCR product without ligase.25 The codon optimised synthetic human insulin gene cloned in pET101/D-TOPO vector expressed in E. coli cells produced high yield of pro-insulin protein.26 Habib-ur-Rehman et al.27 reported effective recombinant expression of the pullulanase gene from a hyperthermophilic Archaeon, Pyrobaculum calidifontis, cloned in pET101/D-TOPO vector and expressed in E. coli and proficiently purified using metal affinity chromatography.

As per previous studies, the codon optimised malaria vaccine gene dramatically improved 5-fold protein expression level in E. coli when compared with the native sequence.28 The significant 4.6 fold increase in codon optimised human cystatin expression in E. coli has commercial importance.29 Our finding also correlated to the above studies with optexo14 showing a 13 fold increase after codon optimization. The enzyme activity and protein concentration of codon optimised proteins were higher compared to native counterparts. The improved function of enzymes can be correlated to significantly high production of enzymes having a native folded state, which was achieved via codon optimization approach.30 Previous studies also showcased that sequence optimization of enzyme coding genes gave rise to upgraded catalytic activities compared to native ones in heterologous expression. The codon optimization of α-amylase gene isolated from Bacillus licheniformis exhibited 2.62 fold higher expression in Pichia pastoris.31 The wild-type lipase gene from Candida rugosa produced no lipase activity in heterologous host P. pastoris, while its optimised gene product produced the hydrolytic activity of 4.7 U.mL-1 in P. pastoris.32 The codon optimized genes in this study resulted in higher protein quantity of each enzyme. The sequence optimised genes have positive effects on expression at different levels such as transcription, translation, and mRNA stability, which improves the overall protein yield and activity of recombinant proteins.33 The purified optimised optexo14 and optendo13 protein fractions showed specific activities of 72 U.mg-1 and 65.63 U.mg-1 respectively, which were the highest beta glucanase activities ever reported from Streptomyces spp.

In the industrial scenario fungal beta glucanase enzymes are widely employed and most of the commercially available beta glucanase preparations are from the fungal source, mainly from Aspergillus and very few prepared from bacteria Bacillus amyloliquefaciens.34, 35, 36 The majority of available fungal beta glucanases are highly unstable during higher temperature requirements in the brewing process.37 The bacterial β-glucanases shows activity at an optimal pH, but do not show activity at wide pH intervals.38 When comparing our findings to exo-β-1,4-glucanases from Trichoderma viridi39 and Chaetomium olivaceum40 and endo- β-1,3-glucanases from Trichoderma harzianum41 and Trichoderma koningi42 Streptomyces spp. established an exception that our enzymes optexo14 and optendo13 have significantly high thermostability and pH stability than fungal enzymes and also showed significant activity and stability in wide ranges of pH from 4.0 to 8.0.

Optexo14 showed a high affinity towards cellulolytic substrate Avicel. Studies claim that the high affinity of enzymes towards Avicel confirms it as an exo- acting enzyme, hence Avicel is used as a model substrate for detecting cellobiohydrolase (CBH) activity.43, 44, 45 Optendo13 showed high specificity towards the β-1,3 linked substrate CM-Curdlan, and also showed 60% specificity towards barley β-glucan which confirmed the enzyme is also able to cleave the internal β-1,3-linkages within the barley β-glucan chain, these results define the enzyme as an endo-β-1,3-glucanase.

The metal ions such as Cu2+, Co2+ and Fe2+ showed a significant inhibitory effect on optexo14 and optendo13. Zn2+ produced a high detrimental effect on optexo14 activity. The inhibitory action of Zn2+ and Cu2+ is a general feature of β-glucanases. According to Lim et al.,46 Mn2+ and Cu2+ were reported as fungal β-glucanase inhibitors. However, Mn2+ stimulated the activities of both optexo14 and optendo13 Streptomyces enzymes. The results of kinetic studies of the purified recombinant optexo14 and optendo13 showed Km values of 7.508 and 9.221 mM using the substrate barley β-glucan. The lower Km values designate the higher affinity to β-glucan substrates which proves the beneficial application of both enzymes in industrial sectors such as brewing and animal feed enzyme industries.

Conclusion

Our exploration through the heterologous expression combined with the codon optimisation strategy efficiently improved the expression of Streptomyces spp. β-glucanase genes such as EXO14 (exo-β-1,4-glucanase) and ENDO13 (endo-β-1,3-glucanase) in E. coli and accomplished high protein yield and functional activity with better physio-chemical characteristics. These results suggested that the enzymes individually as well as the cocktail mix will be the better candidates for the applications in the brewing industry as well as animal feed enzyme industry for efficient hydrolysis of cereal β-glucan. Also suggested this strategy can efficiently use in large scale cost-effective production.

Supplementary Information

Additional File: PDF

Acknowledgements

The   authors   are   grateful   to   Woman   Scientist   Division   (WSD),   Kerala   State   Council   for   Science, Technology and Environment (KSCSTE), Kerala for financial assistance.

Compliance with Ethical Standards

Not applicable.

Conflict of Interests

All authors declare that they have no competing interests.

References

  1. Wood P. J., Fulcher R. G., Stone B. A. Studies on the specificity of interaction of cereals cell wall components with congo red and calcofluor: Specific detection and histochemistry of (1→3),(1→4)- β-D-glucan. Journal of Cereal Science. 1993; 1:95-110.
  2. Havrlentova M., Kraic J. Content of β-D-glucan in cereal grains. Journal of Food and Nutrition Research. 2006; 45(3):97-103.
  3. Havrlentova M., Petrulakova Z., Burgarova A., Gago F., Hlinkova A., Sturdik E. Cereal β-glucans and their significance for the preparation of functional foods – A Review. Czech Journal of Food Sciences. 2011; 29(1):1-14.
  4. Fincher G. B., Stone B. A. Cell walls and their components in cereal grain technology. In: Pomaranz Y, editors. Advances in cereal technology. St. Paul: AACC; 1986. Pp 278-295.
  5. Lee C. J., Horsley R. D., Manthey F. A., Schwarz P. B. Comparisons of β-glucan content of barley and oat. Cereal Chemistry. 1997; 74:571-575.
  6. Kapur N. K., Ashen D., Blumenthal R. S. High density lipoprotein cholesterol: an evolving target of therapy in the management of cardiovascular disease. Vascular Health and Risk Management. 2008; 4:39-57.
  7. Cui S. W., Wang Q. Cell wall polysaccharides in cereals: chemical structure and functional properties. Structural Chemistry. 2009; 20:291-297.
  8. Moon S. H., Lee I., Feng X., Lee H. Y., Kim J., Ahn D. U. Effect of dietary beta-glucan on the performance of broilers and the quality of broiler breast meat. Asian-Australasian Journal of Animal Sciences. 2016; 29(3):384-9.
  9. Gupta M., Abu‐Ghannam N., Gallaghar E. Barley for brewing: characteristic changes during malting, brewing and applications of its by‐products. Comprehensive Reviews in Food Science and Food Safety. 2010; 9:318-328.
  10. Jin Y. L., Speers R. A., Paulson A. T., Stewart R. J. Barley beta-glucans and their degradation during malting and brewing. Technical Quarterly, Master Brewers Association of the Americas. 2004; 41:231-240.
  11. Dake M. S., Jhadav J. P., Patil N. B. Induction and properties of 1,3-β-D-Glucanases from Aureobasidium pullulans. Indian Journalof Biotechnology. 2004; 3:58-64.
  12. Logeswaran R., Prabagaran S. R. P, Ramesh D. Bacterial Diversity towards Industrially Important Enzyme Producers from Velliangiri Hills, Western Ghats. IOSR Journal of Environmental Science, Toxicology and Food Technology. 2014; 8(5):45-63.
  13. Nampoothiri K. M., Ramkumar B., Pandey A. Western Ghats of India: Rich source of microbial biodiversity. Appl Biochem Biotechnol. 2013; 167(6):1753-62.
  14. Marchler-Bauer A. CDD: conserved domains and protein three-dimensional structure. Nucleic Acids Research. 2013; 41:384-52.
  15. Gasteiger E., Hoogland C., Gattiker A. Protein identification and analysis tools on the ExPASy Server. John M. Walker, editors. The Proteomics Protocols Handbook. Humana Press; 2005. Pp 571-607.
  16. Bradford M. M. A rapid and sensitive method for the quantitation of microgram quantities of protein utilizing the principle of protein-dye binding. Annals of Biochemistry. 1976; 72:248-254.
  17. Miller G. L. Use of dinitrosalicylic acid reagent for determination of reducing sugar. Analytical Chemistry. 1959; 31:426-428.
  18. Graceffa P., Jancso A., Mabuchi K. Modification of acidic residues normalizes sodium dodecyl sulfate-polyacrylamide gel electrophoresis of caldesmon and other proteins that migrate anomalously. Archives of Biochemistry and Biophysics. 1992; 297(1):46-51.
  19. Alves V. S., Pimenta D. C., Sattlegger E., Castilho B. A. Biophysical characterization of Gir2, a highly acidic protein of Saccharomyces cerevisiae with anomalous electrophoretic behaviour. Biochemical and Biophysical Research Communications. 2004; 314(1):229-234.
  20. Raab D., Graf M., Notka F., Schoedl T., Wagner R. The GeneOptimizer Algorithm: Using a sliding window approach to cope with the vast sequence space in multiparameter DNA sequence optimization. Systems and Synthetic Biology. 2010; 4(3):215-225.
  21. Redwan E. L. The optimal gene sequence for optimal protein expression in Escherichia coli: principle requirements. Arab Journal of Biotechnology. 2006; 9:493-510.
  22. Tokano D. V., Kawaichi M. E., Venancio E. J., Vidotto M. C. Cloning and characterization of the iron uptake gene IutA from avian Escherichia coli. Brazilian Archives of Biology and Technology. 2008; 51(3):473-482.
  23. Zarif R., Sankian M., Gholubi A., Farshadzadeh Z., Soleimanpour S., Youssefi F., Abdolreza V. Cloning and expression of Mycobacterium tuberculosis major secreted protein antigen 85B (Ag85B) in Escherichia coli. Jundishapur Journal of Microbiology. 2013; 6(2):112-6.
  24. Kishore V., Nishita K. P., Manonmani H. K. Cloning, expression and characterization of L-asparaginase from Pseudomonas fluorescensfor large scale production in E. coli BL21. Biotechnology. 2015; 5:975e81.
  25. Shuman S. Novel approach to molecular cloning and polynucleotide synthesis using Vaccinia DNA Topoisomerase. The Journal of Biological Chemistry. 1994; 269(51):32678-32684.
  26. El-Aziz G. A., Abdel-Aziz S. H., Reda M. M., Baehen M., Baeshen N. A., Redwan E. M. Synthesis of human insulin gene in vitro through computational methodology. Life Science Journal. 2014; 11(1):27-34.
  27. Habib-ur-Rehman, Siddiqui M. A., Qayyum A., Bano A., Rashid N. Gene expression in Escherichia coli and purification of recombinant type II pullulanase from a hyperthermophilic archaeon, Pyrobaculum calidifontis. Pakistan Journal of Zoology. 2018; 50(4):1381-1386.
  28. Yadava A., Ockenhouse C. F. Effect of codon optimization on expression levels of a functionally folded malaria vaccine candidate in prokaryotic and eukaryotic expression systems. Infection and Immunity. 2003; 71(9):4961-4969.
  29. Qing W., Mei C., Zhen H., Zhu J. Codon preference optimization increases prokaryotic cystatin c expression. Journal of Biomedicine and Biotechnology. 2012; 732017:1-7.
  30. Li Y. M., Li D. J., Xu X. J., Cui M., Zhen H. H., Wang Q. Effect of codon optimization on expression levels of human cystatin C in Pichia pastoris. Genetics and Molecular Research. 2014; 13(3): 4990-5000.
  31. Wang J. R., Li Y. Y., Liu D. N., Liu J. S., Li P., Chen L. Z., Xu S. D. Codon optimization significantly improves the expression level of α -amylase gene from Bacillus licheniformis in Pichia pastoris. BioMed Research International. 2015: 248680.
  32. Xu L., Jiang X., Yang J., Liu Y., Yan Y. Cloning of a novel lipase gene, lipJ08, from Candida rugosa and expression in Pichia pastoris by codon optimization. Biotechnology Letters. 2010; 32:269-276.
  33. Fath S., Bauer A. P., Liss M., Spriestersbach A., Maertens B., Hahn P., Ludwig C., Schafer F., Graf M., Wagner R. Multiparameter RNA and codon optimization: a standardized tool to assess and enhance autologous mammalian gene expression. PLoS ONE. 2011; 6(3):e17596.
  34. Sahay S. Wine Enzymes: Potential and Practices. In: Kuddus M, editors. Enzymes in Food Biotechnology: Production, Applications, and Future Prospects. 2019: 73-92. doi:10.1016/b978-0-12-813280-7.00006-2.
  35. Mischnick P., Momcilovic D. Chemical Structure Analysis of Starch and Cellulose Derivatives. Advances in Carbohydrate Chemistry and Biochemistry. 2010; 117–210. doi:10.1016/s0065-2318(10)64004-8.
  36. Canal-Llauberes R. M. Enzymes and wine quality. Managing Wine Quality. 2010; 93-132. doi:10.1533/9781845699987.1.93
  37. You S., Tu T., Zhang L., Wang Y., Huang H., Ma R., … Yao B. Improvement of the thermostability and catalytic efficiency of a highly active β-glucanase from Talaromyces leycettanus JCM12802 by optimizing residual charge-charge interactions. Biotechnology for biofuels. 2016; 9:124. doi:10.1186/s13068-016-0544-8.
  38. Cano-Ramirez C., Santiago-Hernandez A., Rivera-Orduna F. N., Garcia-Huante Y., Zuniga G., Hidalgo-Lara M. E. Expression, purification and characterization of an endoglucanase from Serratia proteamaculans CDBB-1961, isolated from the gut of Dendroctonus adjunctus (Coleoptera: Scolytinae). AMB Express. 2016; 6(1):63.
  39. Irshad M., Anwar Z., Afroz A. Characterization of exo -1,4-β glucanase produced from Trichoderma Viridi through solid-state bio-processing of orange peel waste. Advances in Bioscience and Biotechnology. 2012; 3:580-584.
  40. El-Gindy A. A, Saad R. R, Fawzi E. Purification and some properties of exo-1,4-beta-glucanase from Chaetomium olivaceum. Acta Microbiologica Polonica. 2003; 52:35-44.
  41. Noronha E. F., Ulhoa C. J. Purification and characterization of an endo-β-1,3-glucanase from Trichoderma harzianum. Canadian Journal of Microbiology. 1996; 42(10):1039-1044.
  42. Monteiro V. N., Ulhoa C. J. Biochemical characterization of a beta-1,3-glucanasefrom Trichoderma koningii induced by cell wall of Rhizoctonia solani. Current Microbiology. 2006; 52(2):92-96.
  43. Kruus K., Wang W. K., Ching J. T., Wu J. H. D. Exoglucanase activities of the recombinant Clostridium thermocellum CelS, a major cellulosome component. Journal of Bacteriology. 1995; 177:1641-1644.
  44. Teeri T. T. Crystalline cellulose degradation: new insight into the function of cellobiohydrolases, Trends in Biotechnology. 1997; 15(5):160-167.
  45. Zhang Y. H. P., Himmel M. E., Mielenz J. R. Outlook for cellulase improvement: Screening and selection strategies. Biotechnology Advances. 2006; 24(5):452-81.
  46. Lim J., Lee C., Dhakshnamoorthy V., Park J. S., Hong S. Molecular characterization of Streptomyces coelicolor A(3) SCO6548 as a cellulose 1,4-β-cellobiosidase. FEMS Microbiology Letters. 2016; 363:245.

Modifying Supports Surfaces by Dairy Wastewater Conditioning Film and Relationship with Initial Bacterial Adhesion

$
0
0

Introduction

The dairy industry represents an economic and nutritional interest for the sums it generates and dairy products are very important for human nutrition. But this industry generates a lot of wastewater. The quantity of wastewater varies between 0.2 and 10 L for one liter of treated milk1. Dairy wastewater (DWW) is highly loaded with organic matter2.

Treatment of this wastewater is becoming an absolute necessity for environmental protection. There are several methods of treating DWW to reduce its organic matter loading: electrochemical3, membrane filtration4, reverse osmosis5,coagulation-flocculation 6, land treatment7, and biological treatments such as anaerobic biofilm reactor8. Among the anaerobic bioreactors, it is worth citing the anaerobic digester, which not only produces little sludge but also generates bio-methane used as an energy source. After anaerobic digestion begins, biogas detection only takes place from the second week of start-up 9 due to the time required to accumulate a sufficient amount of biomass to treat the organic matter. Often, when the content is renewed in a bioreactor, some of the biomass is lost through the effluent, which delays the bioprocess 10. The use of supports inside the reactors allows the microorganisms to bind to support surfaces, form a biofilm, and increase the surface area of contact between the microorganisms and the organic material. Supports, also, can help in maintaining the biomass that may be lost at a reactor outlet and increasing the start-up speed of the bioreactor after the renewal of its contents.

Many different studies have concluded that physicochemical characteristics, roughness, pH, ionic strength, and porosity play an important role in the initial adhesion of bacteria to substrates 10–16. One aspect of microorganisms’ adhesion to bio carriers that has received little attention is the conditioning film phenomenon: the deposit of nutrients on material surfaces when immersed in a liquid medium17. Substances in organic materials such as sugars and proteins can adsorb to surfaces, forming a conditioning film and affecting physicochemical characteristics, roughness, surface charge, and wettability. The conditioning film, in turn, affects the adhesion of bacteria to the surface17.

To our knowledge, no work has highlighted the effect of DWW conditioning film or, more generally, any organic material on the supports in the bioreactor for wastewater treatment. In this work, our objective is to compare 3 plastic supports before and after treatment with DWW, demonstrate how the DWW conditioning film modifies both the bio carriers’ physicochemical characteristics and the bacterium adhesion to substrate surfaces treated and untreated with DWW.

Materials and Methods

Bacterial strain and the preparation of a bacterial suspension

The bacterial strain used as a biological model is an optional anaerobic Gram-positive bacterium from a laboratory digester. This bacterium is added to the consortium of microorganisms in the anaerobic digester to increase the quantity of biogas 18. This strain is grown in a liquid Luria Bertani medium (LBL) at 37°C for 24 hours. The bacteria are then collected by centrifugation (5000 g for 15 min), washed twice with a solution of KNO3 at 0.1 M of ionic strength. Finally, the bacterial suspension was prepared with a solution of KNO3 (0.1M).

Plastic Supports

Three ordinary plastic carrier materials were selected for their low cost, durability, and availability and because they are commonly used as mobile carrier materials in anaerobic digesters: polyethylene terephthalate (PET:(C10H8O4)n), polypropylene (PP:(C3H6)n), and polyvinyl chloride (PVC:(C2H3Cl)n). Each plastic material was cut into 1.5 cm2 square coupons for contact angle measurement experiments, and into 1 cm2 square for adhesion tests. The plastic supports were immersed in ethanol for 15 min to disinfect and remove dirt from their surface and subjected to a sonication bath in sterile distilled water for 10 min. The coupons were rinsed several times with sterile distilled water. Then they were dried in a sterile area before being stored in a sterile condition for later use.

Contact angle measurement

The Bacteria

The method for measuring contact angles on bacterial layers has been described by Busscher et al 19. Briefly, the prepared bacterial suspension is deposited on a cellulose acetate filter (0.45 μm) using a filtration ramp, producing a bacterial mat whose thickness probably represents 50 to 100 cells. This film is placed on a glass support and allowed to evaporate. The contact angle is then measured. Water (w), formamide (f), and diiodomethane (d) were used as reference solvents. A drop is formed at the end of a syringe to be deposited on the sample surface. A sequence of digital images is immediately acquired (Windrop) using a CCD camera placed on a goniometer (GBX Instruments, France). Three measurements are made for each sample and for each solvent. The experiment is repeated three times. The free surface energies are determined: the Lifshitz-Van der Waals γLW, electron acceptor γ+, and electron donor γ using the equation (1) of Van Oss et al20. In this approach the contact angles (θ) can be expressed as in Equation (1).

vol_17_no_3_Mod_Tao_Equ1

And the quantitative hydrophobicity can be estimatedby using Equation (2).

vol_17_no_3_Mod_Tao_Equ2

The supports with and without conditioning film

The effect of DWW conditioning film on supports’ physicochemical characteristics was studied by comparing the physicochemical characteristics of these plastic materials before and after their treatment with DWW. Treatment consisted of immersing the materials in DWW for 3 hours at 37°C and then drying in a sterile area.

For untreated supports, the contact angle was measured after cleaning, disinfecting, and drying. For treated supports, the contact angle was measured after treatment with DWW.  The basic principle is the same as for bacteria. The contact angles of the supports were measured using the sessile drop technique of the three probe liquids of different polarity and with known surface energy.

Initial Adhesion Tests

Ten ml of bacterial suspension containing approximately 108 CFU/ml was incubated in a petri dish containing PET, PP, PVC coupons (cleaned and disinfected according to the protocol described above) untreated and treated by sterile DWW for 3 hours at 37°C. After incubation, the coupons were then rinsed three times with sterile distilled water to remove non-adherent bacteria. The plastic coupons were immersed in test tubes containing sterile physiological water (NaCl: 9 g/l). The bacterial cells were detached from the inert supports using a sonication bath (ultrasonic) for 5 min21. The adhered bacteria were harvested by the sonication method and CFUs were counted using the serial dilution technique of the bacterial suspension (dilution up to 10-3 in the case of untreated supports and 10-9 for supports treated with DWW).

Results and Discussion

Surface Energy Cmponents of the Bacterium

Qualitative hydrophobicity θw is a measure of the contact angle between a bacterial surface and a drop of water and quantitative hydrophobicity ΔGiwi is the free energy of interaction between any substance (i) and water (w). The contact angle measurements of the bacterium were taken and then used to determine the surface energy components (Table 1).

Table 1: Contact angle and surface energy components of the bacterium

  Contact angle (°) Surface energy (mJ/ m2)
Surface θd θf θw γLW γ+ γ γAB ΔGiwi
Bacterium 43.5 38.6 33.8 37.5 0.59 50.62 10.93 31.1
Std. dev. 1.5 2 1.4 0.8 0.1 4.5

Bacterium43.538.633.8 37.50.5950.6210.9331.1Std. dev.1.521.4 0.80.14.5d = diiodomethane, f = formamide and w = waterγLW surface energy of Lifshitz-Van der Waals, γ+ electron acceptor, γelectron donor, the γAB Lewis acid–base surface tension and ΔGiwi: the free energy of interaction between two entities of that material when immersed in waterStd. dev.= Standard deviationIn view of the results obtained, our bacterium has a hydrophilic character qualitatively (θw = 33.8°<65°)22. A quantitative approach affirms this result, finding that the strain tested has a positive free surface energy (ΔGiwi = 31.1 mj/m2>0)20. Moreover, this strain has a strong electron donor character (γ= 50.62 mj/m 2), whereas the electron acceptor properties are very low (γ + = 0.59 mj/m2). In light of these results, Latrache et al 23have shown that the hydrophobicity measured by the contact angle is directly correlated with the high N / C ratio and inversely correlated with that of O / C  ratio and have also shown that the hydrophilicity of Escherichia coli is related to the presence of polysaccharides, while hydrophobicity is related to the presence of proteins. Also, the carboxyl and phosphate groups contribute to the negative charges present at Escherichia coli cell surface24.

Plastic supports’ physicochemical charactersThe contact angle measurements for the different plastic supports were taken before and after the supports were treated with DWW and then used to determine the surface energy components (Figure 1).All the supports (U) are hydrophobic and have agreat qualitative hydrophobicity (θw(PETU) = 80.9°; θw (PPU) = 77.8°; θw (PVCU) = 73.3°) (Figure 1.a). Like the qualitative approach (θw), the quantitative hydrophobicity (∆Giwi) of the three supports havea hydrophobic character (∆Giwi (PETU)= -63.2mJ/m²; ∆Giwi (PPU)= -42.3mJ/m²; ∆Giwi (PVCU)=-48.5mJ/m²) (Figure 1.b). The electron donor γcharacter for the three untreated supports have a feeble valor ( γ(PETU)= 4.9mJ/m²; γ(PPU)= 4.1 mJ/m²; γ(PVCU)= 5.3mJ/m²) (Figure 1.c) and the valor of electron acceptor character is very feeble ( γ+(PETU)= 0 mJ/m²; γ+(PPU)= 0.25mJ/m²; γ+(PVCU)= 1 mJ/m²) (Figure 1.d).

Figure 1: Physicochemical characteristics of supports (PET, PP, and PVC) untreated (U) and treated (T) with OMWW. (a) Qualitative hydrophobicity; (b) Quantitative hydrophobicity; (c) Electron donor property; (d) Electron acceptor property; U Untreated; T Treated with DWW. Figure 1: Physicochemical characteristics of supports (PET, PP, and PVC) untreated (U) and treated (T) with OMWW. (a) Qualitative hydrophobicity; (b) Quantitative hydrophobicity; (c) Electron donor property; (d) Electron acceptor property; U Untreated; T Treated with DWW.

Click here to View figure

After treatment with DWW , the support surfaces show a change in their qualitative hydrophobicity θww (PETT) = 78.97°; θw (PPT) = 100.84°, θw (PVCT) = 93.90°) (Figure 1.a) and quantitative hydrophobicity ∆Giwi (∆Giwi (PETT)=-39.08 mj/m²; ∆Giwi (PPT)=-79.03 mj/m²; ∆Giwi (PVCT)=-79.03 mj/m²) (Figure 1.b). The DWW conditioning film increased the valor of the electron donor γcharacter for PET ( γ(PETT)= 13.28 mJ/m²) and decreased the valor for PP and PCV (γ(PPT)= 0.60 mJ/m²; γ(PVCT)= 2.26 mJ/m²) (Figure 1.c), while the valor of electron acceptor character remained very feeble with a slight increase for PET and small decrease por PP and PVC ( γ+(PETT)= 0.25 mJ/m²; γ+(PPT)= 0.55 mJ/m²; γ+(PVCT)= 0.06 mJ/m²) (Figure 1.d).Initial adhesion tests of a bacterium to supports treated and untreated with DWWThis section presents results regarding the adhesion power of the selected bacterial strain to several supports that differ by their physicochemical characteristics and by whether they were conditioned in DWW. The bacterial strain’s ability to attach to untreated supports compared to those treated with DWW is presented in Figure 2.

Figure 2.Number of initial cells adhering to supports. (a) Untreated supports; (b) Treated supports. Figure 2: Number of initial cells adhering to supports. (a) Untreated supports; (b) Treated supports.

Click here to View figure

In Figure 2.a, results of the adhesion tests show a marked difference among the untreated support materials (PET, PP, and PVC) in their ability to promote initial bacteria adhesion. PET is the substrate with least colonization by the studied bacterial strain, whereas PVC contains the most of adherent bacteria, followed by PP; both PVC and PP had over 2 times more colonization than PET [PVC:1.58 105 CFU/cm2; PP:1.48 105 CFU/cm2; PET: 0.72 105 CFU/cm²]. The adhesion on these untreated substrates decreases in this order PVC>PP>PET. Treatment with DWW increases bacteria adhesion across all supports by a factor of 106 (from 105 UFC/cm2 for untreated supports to 1011 UFC/cm2for treated supports) (Figure 2.b). Notably, after treatment with DWW, PET is the substrate with least colonization by the studied bacterial strain, whereas PVC contains the higher colonization (56 times more than PET and 4 times more than PP), followed by PP (13.8 times more than PET) [PET: 0.43 1011 CFU/cm2; PP: 5.95 1011 CFU/cm2; PVC: 24.25 1011 CFU/cm²]. The adhesion on these treated substrates decreases in this order PVC>PP>PET.

Microbial adhesion to a surface is quite complex because it involves electrostatic, Van der Waals and acid-base components. Our study consisted in determining the physicochemical characteristics of the bacterium and the supports treated and untreated with DWW.

Various studies have shown that a conditioning film can be formed by several organic substances such as proteins, polysaccharides, lipids, nucleic acids, and exopolysaccharides 25,26. Conditioning film formation is a multi-step phenomenon; as an example, on stainless steel in a marine environment, proteins adsorb first followed by carbohydrates27,28.

It should be noted that DWW has a complex composition. Some authors have mentioned that DWW resembles milk but is diluted, the organic and mineralogical composition differs according to the industrial process ( milk, cheese, yogurt and butter) used and that detergents and other products used in the production process is found in trace amounts in the effluent at the outlet of the dairy plant 29. It is known that milk is a complex biological fluid consisting of several components including lactose, proteins, fats and calcium phosphate. According to Mittelman 30, the adsorption of milk and its components on the substrate surface occurs within 5 to 10 s.

Because of this, other authors put into perspective the role of the medium, especially the conditioning film, on bacterial adhesion 17,25.

Treatment with DWW does alter the natural character of the three supports, with remarkable changes in the ∆Giwi and θw values (Figure 1.a and b). The ΔGiwidecreased for the PET support after DWW treatment and increased greatly for the PP and PVC supports (Figure 1.b). The electron donor character value increased greatly for the PET (γ(PETU)= 4.9 mJ/m² to γ(PETT)= 13.28 mJ/m²) following DWW treatment and decreased greatly for PP (γ(PPU)= 4.1 mJ/m² to γ(PPT)= 0.60 mJ/m²; and PVC (γ(PVCU)= 5.3 mJ/m² to γ(PVCT)= 2.26 mJ/m²) (Figure 1.c).

The results show that the hydrophobicity, qualitatively and quantitatively, increased after treatment with DWW for PVC and PP supports and remainedalmost stable qualitatively and increased quantitatively for PET.These results are consistent with those of Hamadi et al 31 who had worked on stainless steel and found that steel coated with milk is more hydrophobic than uncoated steel.The electron donor character for PP and PVC are stronger for untreated supports than for treated supports with DWW, these results are the same to those found for stainless steel 21. For PET it is the opposite.

The contact angle method gave very detailed results in terms of hydrophobicity and electron donor/acceptor character for the three supports (PET, PP, PVC) before and after modification with DWW (Figure 2). From a qualitative and quantitative point of view, we found that all the untreated polymer materials have a clearly hydrophobic character. Moreover, all these materials have a low electron donor/acceptor character. Many different studies have shown the same tendency in the surface physicochemical characteristics for these untreated polymers 32–37.

In this study, adhesion tests of the bacterial strain were performed on polyethylene terephthalate (PET), polypropylene (PP), and polyvinyl chloride (PVC). Different results were observed between supports that were modified with DWW and those that were untreated. Microorganism adhesion to surfaces is, as with any inert colloidal particle, largely governed by physicochemical interactions. The sum of these interactions—including electrostatic, Lifshitz-Van der Waals, and acid-Lewis base interactions—can be attractive or repulsive. These interactions depend on the physicochemical properties of microorganisms’ surface, substrate surface, and suspension medium characteristics. These physicochemical properties include hydrophobicity, electrostatic charge, and electron donor/electron acceptor character. All the factors likely to modify the physicochemical surface properties of one of the elements involved in the adhesion phenomenon can thus favor or limit microorganisms’ fixation 35.

In addition, basic chemistry states that one hydrophilic entity naturally attracts another hydrophilic entity 38 and vice versa. Previous research38–40 have reported that hydrophobicity cannot systematically explain the results of microbial adhesion to a support and that acid-base interactions play a very important role in the adhesion phenomenon 13,41,42. According to these assertions, the adhesion of the studied bacterium on the surfaces of supports modified with DWW may be due in part to the acid-base interactions between the strong bacterium’s electron-donating character and the weak supports’ electron-accepting character, which may also explain the adhesive power of this bacterium on modified and untreated supports with DWW.

Hydrophobicity and electron acceptor/donor characteristics were used here to explain these results. Electrostatic forces were not taken into account because the tests were carried out in a liquid with a high ionic strength43. It is well known that bacteria are usually charged negatively in a liquid medium 44. To avoid charge interference between the bacteria cells and the DWW, we used high ionic strength of cell suspension.

As mentioned in different studies, polysaccharides can have a hydrophobic or hydrophilic character depending on the state of freedom in solution as well as their three-dimensional conformation, which can influence the physicochemical parameters of the supports treated with DWW 36,45. Hamadi et al 21have shown that physicochemical parameters including hydrophobicity and electron acceptor/donor character of a stainless steel surface can be modified by fatty acid and proteins after conditioning by milk.

In our case, the modification of the three supports’ physicochemical characteristics (hydrophobicity and electron donor/acceptor character) is due to DWW properties (carbohydrate, fat content and proteins). The concentration and type of molecules adsorbed on the surface of a material are conditioned by the nature of this material (∆Giwi, hydrophobicity, electron donor/acceptor character, electrostatic charges, etc.) 46,47. This may explain the differences we found concerning hydrophobicity and electron donor/acceptor character between the modified supports.

The more the hydrophobicity decreases (θw (PETU) = 80.9°; θw (PPU) = 77. 8°; θw (PVCU) = 76.3 °) (Figure 2.a)., the more the bacterial adhesion increases for untreated supports [PET: 0.72 105 CFU/cm²; PP:1.48 105 CFU/cm2; PVC:1.58 105 CFU/cm2] (Figure.1a). The work of Pringle and Fletcher 48 who found a relationship between the contact angle to water (varies from 0° to 110°) and the adhesion of different bacteria on four different surfaces. Also, Absolom et al 49 showed a linear relationship between the contact angle to water of different varieties of polymers (ranging from 58° to 110°) and bacterial adhesion.

In our case, the thermodynamic theory (physicochemical proprieties) cannot explain the high number of adhered cells on the treated supports. It must be other factors like specific biological interaction (that include ligand-receptor bond) involved in the bacterial adhesion 50.

The components of DWW probably adsorb differently on the 3 supports due to difference of plastic chemical composition (more on PVC than PP and less on PET). Thus, DWW conditioning film increase the bacterial adhesion differently, PVC contains the higher colonization (56 times more than PET and 4 times more than PP) followed by PP (13.8 times more than PET).

Conclusions

The bacterium has a very pronounced hydrophilic character both qualitatively and quantitatively and a strong donor electron character.

Untreated supports with DWW have a hydrophobic character and a very weak electron acceptor/donor character.

After treatment, PET support retained its hydrophobic character with change compared to untreated supports. PVC and PP treated supports have an increase in hydrophobicity and a decrease in the electron donor character.

Bacterial adhesion to untreated supports is affected by hydrophobicity. In fact, the more the hydrophobicity increases, the more the bacterial adhesion increases, and the amount of cell adherence is double for PVC and PP comparted to PET for untreated supports. After treatment with DWW, the conditioning film of DWW significantly enhanced the bacterial adhesion for all three supports (from 105 UFC/cm² to 1011CFU/cm²).

In conclusion, the choice of support material impacts bacterial adhesion, especially after taking into account the DWW conditioning film, which promotes a high level of bacterial adhesion.

Acknowledgments

We deeply thank Dr. Abdeslam Jaafari for his technical support to produce this work.

Conflict of Interest

The authors declare no conflict of interest.

References

  1. Balannec B., Vourch M., Rabiller-Baudry M., Chaufer B. Comparative study of different nanofiltration and reverse osmosis membranes for dairy effluent treatment by dead-end filtration. Sep Purif Technol. 2005;42(2):195–200.
  2. Lhanafi S., Aba-AakiZ R., Et-Taleb S., Elhaouti R., Abbaz M., Ez-Zahery M.Caractérisation des effluents laitiers en vue de leur valorisation: Cas de lactosérum. J Mater Environ Sci. 2014;5:2489–94.
  3. Mohan S. V., Mohanakrishna G., Velvizhi G., Babu V. L., Sarma P.N. Bio-catalyzed electrochemical treatment of real field dairy wastewater with simultaneous power generation. Biochem Eng J. 2010;51(1–2):32–9.
  4. Bortoluzzi A. C., Faitão J. A., Di Luccio M., Dallago R. M., Steffens J., Zabot G. L. Dairy wastewater treatment using integrated membrane systems. J Environ Chem Eng. 2017;5(5):4819–27.
  5. Vourch M., Balannec B., Chaufer B., Dorange G. Treatment of dairy industry wastewater by reverse osmosis for water reuse. Desalination. 2008;219(1–3):190–202.
  6. Mateus G. A. P., Formentini-Schmitt D. M., Nishi L., Fagundes-Klen M. R., Gomes R. G., Bergamasco R. Coagulation/flocculation with Moringa oleifera and membrane filtration for dairy wastewater treatment. Water, Air, Soil Pollut. 2017;228(9):342.
  7. Healy M. G., Rodgers M., Mulqueen J. Treatment of dairy wastewater using constructed wetlands and intermittent sand filters. Bioresour Technol. 2007;98(12):2268–81.
  8. Karadag D., Köroʇlu O. E., Ozkaya B., Cakmakci M. A review on anaerobic biofilm reactors for the treatment of dairy industry wastewater. Process Biochem. 2015;50(2):262–71.
  9. Weiland P. Biogas production: Current state and perspectives. Appl Microbiol Biotechnol. 2010;85(4):849–60.
  10. Muñoz Sierra J. D., Oosterkamp M. J., Wang W., Spanjers H., van Lier J. B. Comparative performance of upflow anaerobic sludge blanket reactor and anaerobic membrane bioreactor treating phenolic wastewater: Overcoming high salinity. Chem Eng J. 2019;366(December 2018):480–90.
  11. Mao Y., Quan X., Zhao H., Zhang Y., Chen S., Liu T. Accelerated startup of moving bed biofilm process with novel electrophilic suspended biofilm carriers. Chem Eng J. 2017;315:364–72.
  12. daSilva A. N., Macêdo W. V., Sakamoto I. K., Pereyra D. de L. A. D., Mendes C. O., Maintinguer S. I.Biohydrogen production from dairy industry wastewater in an anaerobic fluidized-bed reactor. Biomass and Bioenergy. 2019;120(November 2018):257–64.
  13. Hamadi F., Latrache H., Mabrrouki M., Elghmari A., Outzourhit A., Ellouali M. Effect of pH on distribution and adhesion of Staphylococcus aureus to glass. J Adhes Sci Technol. 2005;19(1):73–85.
  14. Tang B., Yu C., Bin L., Zhao Y., Feng X., Huang S. Essential factors of an integrated moving bed biofilm reactor-membrane bioreactor: Adhesion characteristics and microbial community of the biofilm. Bioresour Technol. 2016;211:574–83.
  15. Liu Y., Yang S. F., Tay J. H., Liu Q. S., Qin L., Li Y. Cell hydrophobicity is a triggering force of biogranulation. Enzyme Microb Technol. 2004;34(5):371–9.
  16. Oh Y. J., Lee N. R., Jo W., Jung W. K., Lim J. S. Effects of substrates on biofilm formation observed by atomic force microscopy. Ultramicroscopy. 2009;109(8):874–80.
  17. Kanematsu H., Barry D. M., (ed): Biofilm and Materials Science. Biofilm and Materials Science. Springer International Publishing Switzerland. 2015; 17–23.
  18. Afilal M. E., Belkhadi N., Daoudi H., Elasri O. Methanic fermentation of different organic substrates. J Mater Environ Sci. 2013;4(1):11–6.
  19. Busscher H. J., Weerkamp A. H., van Der Mei H. C., van Pelt A. W., de Jong H. P., Arends J. Measurement of the surface free energy of bacterial cell surfaces and its relevance for adhesion. Appl Environ Microbiol. 1984;48(5):980–3.
  20. van Oss C. J., Chaudhury M. K., Good R. J. Interfacial Lifshitz-van der Waals and polar interactions in macroscopic systems. Chem Rev. 1988;88(6):927–41.
  21. Hamadi F., Latrache H., Asserne F., Elabed S., Zahir H., Saad I. K. Quantitative Adhesion of Staphylococcus aureus on Stainless Steel Coated with Milk. Food Nutr Sci. 2013;04(03):299–304.
  22. Vogler E. A. Structure and reactivity of water at biomaterial surfaces. Adv Colloid Interface Sci. 1998;74(1–3):69–117.
  23. Latrache H., El Ghmari A., Karroua M., Hakkou A., Ait Mousse H., El Bouadili A. Relations between hydrophobicity tested by three methods and surface chemical composition of Escherichia coli. New Microbiol. 2002;
  24. Hamadi F., Latrache H., Elghmari A. Determination of Escherichia coli Negative Charge Concentration From XPS Data and Its Variation with pH. J Surf Anal. 2005;12(3):293–302.
  25. Taylor G. T, Zheng D., Lee M., Troy P. J., Gyananath G., Sharma S. K. Influence of surface properties on accumulation of conditioning films and marine bacteria on substrata exposed to oligotrophic waters. Biofouling. 1997;11(1):31–57.
  26. Zaidi B. R., Bard R. F., Tosteson T. R. Microbial specificity of metallic surfaces exposed to ambient seawater. Appl Environ Microbiol. 1984;48(3):519–24.
  27. Compère C., Bellon-Fontaine M. N., Bertrand P., Costa D., Marcus P., Poleunis C. Kinetics of conditioning layer formation on stainless steel immersed in seawater. Biofouling. 2001;17(2):129–45.
  28. Poleunis C., Compère C., Bertrand P. Time-of-flight secondary ion mass spectrometry: Characterisation of stainless steel surfaces immersed in natural seawater. J Microbiol Methods. 2002;48(2–3):195–205.
  29. Ozturk I., Eroglu V., Ubay G., Demir I. Hybrid upflow anaerobic sludge blanket reactor (HUASBR) treatment of dairy effluents. Water Sci Technol. 1993;28(2):77–85.
  30. Mittelman M. W. Structure and Functional Characteristics of Bacterial Biofilms in Fluid Processing Operations. J Dairy Sci. 1998;81(10):2760–4.
  31. Hamadi F., Asserne F., Elabed S., Bensouda S., Mabrouki M., Latrache H. Adhesion of Staphylococcus aureus on stainless steel treated with three types of milk. Food Control. 2014;38(1):104–8.
  32. Nguyen V., Karunakaran E., Collins G., Biggs C.A. Physicochemical analysis of initial adhesion and biofilm formation of Methanosarcina barkeri on polymer support material. Colloids Surfaces B Biointerfaces. 2016;143:518–25.
  33. Habouzit F., Gévaudan G., Hamelin J., Steyer J. P., Bernet N. Influence of support material properties on the potential selection of Archaea during initial adhesion of a methanogenic consortium. Bioresour Technol. 2011;102(5):4054–60.
  34. Assaidi A., Ellouali M., Latrache H., Mabrouki M., Timinouni M., Zahir H. Adhesion of Legionella pneumophila on glass and plumbing materials commonly used in domestic water systems. Int J Environ Health Res. 2018;28(2):125–33.
  35. van Oss C. J. (ed): Interfacial Forces in Aqueous Media, 2ndedn.New York:CRC press.2006; 217-220.
  36. van Oss C. J, Chaudhury M. K., Good R. J. The Mechanism of Phase Separation of Polymers in Organic Media—Apolar and Polar Systems. Sep Sci Technol. 1989;24(1–2):15–30.
  37. van Oss C. J., Good R. J., Busscher H. J. Estimation of the polar surface tension parameters of glycerol and formamide, for use in contact angle measurements on polar solids. J Dispers Sci Technol. 1990; 11(1):75-81.
  38. McEldowney S., Fletcher M. Variability of the influence of physicochemical factors affecting bacterial adhesion to polystyrene substrata. Appl Environ Microbiol. 1986;52(3):460–5.
  39. Pratt-Terpstra I. H., Weerkamp A. H., Busscher H. J. On a relation between interfacial free energy-dependent and noninterfacial free energy-dependent adherence of oral streptococci to solid substrata. Curr Microbiol. 1988 Nov;16(6):311–3.
  40. Sjollema J., Van der Mei H. C., Uyen H. M. W., Busscher H.J. The influence of collector and bacterial cell surface properties on the deposition of oral streptococci in a parallel plate flow cell. J Adhes Sci Technol. 1990;4(1):765–77.
  41. Hamadi F., Latrache H., Mallouki B., Mliji E., El Ghmari A., Mabrouki M. Adhesion of Escherichia coli to glass under different pH. J Pure Appl Microbiol. 2008;2(2):295–302.
  42. Henriques M., Azeredo J., Oliveira R. Adhesion of Candida albicans and Candida dubliniensis to acrylic and hydroxyapatite. Colloids Surfaces B Biointerfaces. 2004; 33(3-4):235-241.
  43. Bellon-Fontaine M. N., Rault J., van Oss C. J. Microbial adhesion to solvents: A novel method to determine the electron-donor/electron-acceptor or Lewis acid-base properties of microbial cells. Colloids Surfaces B Biointerfaces. 1996;7(1–2):47–53.
  44. van Loosdrecht M. C. M., Lyklema J., Norde W., Zehnder A. J.B. Bacterial adhesion: a physicochemical approach. Microb Ecol. 1989;17(1):1–15.
  45. van Oss C. J. Interfacial Forces in Aqueous Media- 2nd ed. Taylor Fr Gr. 2006;V36.
  46. Rosmaninho R., Santos O., Nylander T., Paulsson M., Beuf M., Benezech T.Modified stainless steel surfaces targeted to reduce fouling – Evaluation of fouling by milk components. J Food Eng. 2007; 80(4):1176-1187.
  47. Rubio C., Costa D., Bellon-Fontaine M. N., Relkin P., Pradier C. M., Marcus P. Characterization of bovine serum albumin adsorption on chromium and AISI 304 stainless steel, consequences for the Pseudomonas fragi K1 adhesion. Colloids Surfaces B Biointerfaces. 2002;24(3–4):193–205.
  48. Pringle J. H., Fletcher M. Influence of substratum wettability on attachment of freshwater bacteria to solid surfaces. Appl Environ Microbiol. 1983;45(3):811–7.
  49. Absolom D. R., Lamberti F. V., Policova Z., Zingg W., van Oss C. J., Neumann A. W. Surface thermodynamics of bacterial adhesion. Appl Environ Microbiol. 1983;46(1):90–7.
  50. Vitte J., Benoliel A. M., Pierres A., Bongrand P. Is there a predictable relationship between surface physical-chemical properties and cell behaviour at interface. Eur Cells Mater. 2004;7(SUPPL.1):19.

Development of Interspecific Hybrids (Abelmoschus Esculentus × A. Tetraphyllus) in Okra Using Embryo Rescue Approach

$
0
0

Introduction

Okra [Abelmoschus esculentus (L.) Moench] also called lady’s finger or bindi is a polyploid vegetable with chromosome number 2n=130 belonging to family Malvaceae. A number of insect pests and viruses affect the production of this crop. Whitefly (Bemisia tabaci) transmitted virus complex consisting of a monopartite begomovirus, bhendi yellow vein mosaic virus (BYVMV) causing Yellow Vein Mosaic Virus (YVMV) is the most important and destructive viral disease in okra (Rana et al., 2006). The total loss due to YVMV has been reported to be 20-30%, which could rise to 80-90% if the carrier of the virus is not controlled (Richardson, 1997). The use of chemicals and culling off the infected plants is not practical and economical solution to control the virus, and therefore, development of resistant/tolerant varieties seems to be the best option to curtail the loss. Undomesticated related species are the genetic stocks of resistant genes for different pest, diseases and abiotic stresses (Rattan et. al., 2015). Lack of stable source of resistance to YVMV in cultivated species is the major constrain in developing stable resistant variety in okra.  However, some of the wild species of okra have been reported to be stable and reliable sources of resistance to YVMV. One such wild species of okra, A. tetraphyllus is an important resistance sources to YVMV (Prabu, 2005), but the sterility problems and trouble in producing subsequent generations or even to carry out back crosses hampers the transfer of resistance from wild species. Hence  for the development of YVMV resistant lines adoption of non-conventional methods of breeding like plant tissue culture mediated introgression is an urgent need. Embryo rescue technique can be efficiently used to overcome post-zygotic incompatibility which is found to operate between these species. In view of this, the investigation was undertaken with the objective to transfer resistance genes from wild species (A. tetraphyllus IC 141017) to popular okra varieties mediated through embryo rescue.

Materials and Methods

Planting Material and Interspecific Hybridization

The planting materials used in the investigation comprised of four cultivated genotypes of okra [A. esculentus L. (Moench)], viz., Arka Anamika, Parbhani Kranti, Pusa Makhmali (procured from ICAR-NBPGR, New Delhi), Jammu okra-05 (procured from SKUAST, Jammu), and a wild species, A. tetraphyllus (IC 141017) procured from ICAR-Indian Institute of Vegetable Research, Varanasi. All these genotypes were sown in the Agriculture Farm of DAV University, Jalandhar in April, 2017. Reciprocal crosses were made between the cultivated and wild genotypes.  Female flowers were selected at the balloon stage a day prior to pollination and their bagging was done to avoid undesirable crossing. Next day they were pollinated with the desirable pollen.

Embryo Rescue and Shoot and Root Regeneration

Fruits of okra at immature stage were harvested at 5, 10, 15 and 20 days after pollination (DAP). The immature seeds were extracted from these fruits and they were inoculated on media composed of Murashige and Skoog (MS) medium containing different concentrations of 6-Benzyl amino purine (BAP) for embryo emergence or callogenesis. The emerged embryos (4-5 cm) were further cultured on different treatment combinations so as to study their effect on shoot emergence. These treatment combinations were MS + 0.25 mg l-1 NAA + 0.5 mg l-1 IBA; MS + 0.5 mg l-1 NAA + 0.5 mg l-1 IBA; MS + 1.0 mg l-1 NAA + 0.5 mg l-1 IBA; MS + 0.25 mg l-1  NAA + 1.0 mg l-1 IBA; MS + 0.5 mg l-1 NAA + 1.0 mg l-1 IBA; MS + 1.0 mg l-1 NAA + 1.0 mg l-1 IBA. Incubation of these cultures was done at 26±20C for 30 d after which they were sub-cultured on to freshly prepared medium for shoot multiplication. These shoots were transferred then transferred to root regeneration medium having composition of half-strength MS medium +0.25 mg l-1 IBA + 200 mg l-1 and activated charcoal, for root initiation.

Hardening of the Plantlets

Well rooted plantlets were isolated from the test tube with utmost care so that the shoots do not get damaged. After washing them with distilled water to remove the adhering agar, the plantlets were transplanted in sterilized soil less media (cocopeat: vermiculite: perlite in ratio of 1:1:1) in the small pots. Watering of these plantlets was done at every 15 days with half-strength MS medium.

Results and Discussion

Interspecific Hybridization

The four cultivated varieties started flowering in the month of May 2017, whereas, the wild species (IC 141017) started flowering in the month of Sept. 2017. The main problem in the hybridization programme of the present study was non-synchronised flowering among cultivated and wild genotypes. The wild genotype started flowering by the Sept. 2017, however the cultivated genotypes which were sown in the April, 2017 stopped flowering by August, 2017.  So, when the cultivated genotypes were in their peak period of flowering there was no flowering in the wild genotype. To overcome this problem, repeated sowings of cultivated varieties of okra was done under controlled conditions so as to get a synchronous flowering.

Figure 1: Different interspecific cross combinations and wild genotype Figure 1: Different interspecific cross combinations and wild genotype

Click here to view figure

Table 1: Cross compatibility between Abelmoschus esculentus L. (Moench) and A. tetraphyllus IC 141017   

Cross combination No. of cross attempted Fruit setting No. of fruits obtained after 25 DAP
Arka Anamika × A. tetraphyllus IC 141017 50 28 22
Parbhani Kranti × A. tetraphyllus IC 141017 50 32 26
Pusa Makhmali × A. tetraphyllus IC 141017 50 20 18
A. tetraphyllus IC 141017   × Arka Anamika 50
A. tetraphyllus IC 141017    × Parbhani Kranti 50
A. tetraphyllus IC 141017    × Pusa Makhmali 50

A total of 50 crosses were made in each cross combination, of the four cultivated genotypes, fruit setting was observed only in Arka Anamika, Parbhani Kranti and Pusa Makhmali when cultivated genotypes were used as female parents. Fruit setting failed when A. tetraphyllus (IC 14101) was used as female parent (Table 1). Similar results were observed by Mamidwar et al. (1979), Meshram and Dhapake (1981), Sheela (1986). They observed that fruit set was maximum when A. esculantus was used as female parent in an interspecific cross between A. esculentus × A. tetraphyllus. Small fruits were obtained in the all the cross combinations. The fruits appeared normal till 25 d after pollination, but after that the fruits showed splitting/cracking from the distal end. The seeds looked healthy for up to 10-15 d after pollination, after that it shrivelled and became pale yellow (Fig. 2). The findings are in time with Mamidwar et al. (1979) who also obtained seed less fruits and shrivelled seeds when crossed Abelmoschus esculentus × Abelmoschus tetraphyllus.

Figure 2: (a to d):a) Small interspecific hybrid fruit b) Distal cracking in the fruits after 25 DAP c)Small white yet succulent seeds after 15 DAP d)Degeneration of seeds after 25 DAP Figure 2: (a to d):a) Small interspecific hybrid fruit b) Distal cracking in the fruits after 25 DAP c)Small white yet succulent seeds after 15 DAP d)Degeneration of seeds after 25 DAP

Click here to view figure

Sureshbabu and Datta (1990) also observed the similar results and inferred that slow pollen tube growth, abnormal pollen tube, and abortion of fertilized ovules or scarcity of pollen grains could be the reason for no seed formation in interspecific hybrids. The findings are also in time with Sindhu (1993) who obtained shrivelled seeds in interspecific hybridization which may be attributed to the poor development of endosperm. Age at which embryo is extracted for inoculation affects a lot in regeneration of plant from embryo. The excision stage of embryo varies with crop. After 5, 10, 15 and 20 d of pollination, the fruits were harvested in the present study. This could be due to the fact that the embryo of the seeds which were harvested before 15 d of pollination were quite immature for pollination however, the embryo of the seeds which were harvested after 15 d of pollination were degenerated. Similar findings were reported by Rajamany et al. (2006), who obtained interspecific hybrids o A. esculentus × A. moschatus when excised embryos at 12 and 15 d after pollination through embryo rescue technique.

Effect of Media of Embryo Emergence

The fruits of the all the cross combinations which were harvested at 5, 10 and 15 d, had seeds which were shiny and succulent yet small and white. As the number of days after pollination increased the seeds started appearing shrivelled and dull white (Fig. 2). However, the seeds remained succulent at 15 d after pollination. Inoculations of these harvested seeds were done on different treatment combinations viz., MS + 0.25 mg l-1  BAP; MS + 0.5 mg l-1  BAP; MS + 1.0 mg l-1  BAP; MS + 1.5 mg l-1  BAP. The results pertaining to this component is presented in Table 2. Cross combinations, Arka Anamika × A. tetraphyllus IC 141017 showed emergence of embryo 25 d after inoculation when inoculated media containing MS + 0.25 mg l-1  BAP. Cross combination, viz., Pusa Makhmali × A. tetraphyllus IC 141017 and Parbhani Kranti × A. tetraphyllus IC 141017 showed direct emergence of embryo 30-35 d after inoculation in the same media. Emergence of embryo was observed in all the cross combinations after 45-50 d of inoculation in the MS media containing BAP @0.5 mg l-1. No cross combinations showed embryo emergence in media comprising of MS + 1.0 mg l-1  BAP; MS + 1.5 mg l-1  BAP.

Table 2: Response of different interspecific hybrids on growth media

Cross combination Different levels of BAP (mg l-1 ) in MS Medium
0.25 0.5 1.0 1.5
Arka Anamika × A. tetraphyllus (IC 141017) embryo emergence after 25 d of inoculation embryo emergence after 45-50 d of inoculation -*
Pusa Makhmali × A. tetraphyllus (IC 141017) embryo emergence after 30-35 d of inoculation embryo emergence after 45-50 d of inoculation
Parbhani Kranti × A. tetraphyllus (IC 141017) embryo emergence after after 30-35 d of inoculation embryo emergence after 45-50 d of inoculation

Role of media is major in embryo rescue, as it acts as endosperm by providing nutrient to the excised embryo. The seeds of fruits harvested after 15 d of pollination were inoculated in MS media containing various concentrations of BAP. MS media containing 0.25 mg of BAP gave the best results in all cross combinations. These findings corroborates with the results of Kabir et al. (2008), who observed good regeneration with BAP. It was observed that lower the concentration of BAP greater were the results with early emergence of embryo. Negative effect on plant regeneration with higher concentration of BAP was also observed by earlier researchers viz.,  Kashif Waseem et al. (2011) and Zayova et al. (2012).

Regeneration and Hardening Plantlets

Shoot Regeneration

Different treatments such as MS + 0.25 mg l-1  NAA + 0.5 mg l-1  IBA; MS + 0.5 mg l-1  NAA + 0.5 mg l-1  IBA; MS + 0.5 mg l-1  NAA + 0.5 mg l-1  IBA; MS + 0.25 mg l-1  NAA + 1.0 mg l-1  IBA; MS + 0.5 mg l-1  NAA + 1.0 mg l-1IBA; MS + 1.0 mg l-1  NAA + 1.0 mg l-1  IBA were used to subculture the two true leaf stage emerged embryos. MS media supplemented with 0.5 mg l-1  NAA + 1.0 mg l-1  IBA  resulted in  the largest number of shoots per explant (0.92±0.12%) with the maximum frequency of shoot regeneration (86±0.12%) in Parbhani Kranti × A. tetraphyllus IC 141017.  The same media combination revealed maximum number of shoots/explants to the tune of 0.89±0.10 and 0.88±0.13 in cross combinations viz., Arka Anamika × A. tetraphyllus IC 141017 and Pusa Makhmali × A. tetraphyllus IC 141017 respectively. Similarly, the maximum frequency of shoot regeneration was observed in Arka Anamika × A. tetraphyllus IC 141017 (85±0.11%) and Pusa Makhmali × A. tetraphyllus IC 141017 (82±0.14%) on this media combination (Table 3).  Kabir et al. (2008) also obtained shoot differentiation in okra when MS media was supplemented with NAA and Dhande et al. (2012) who observed that MS media supplemented with IBA and NAA gave good shoot regeneration in okra.

Table 3: Shoot regeneration in different media combinations

Cross MS medium containing 1 mg l-1  IBA  MS medium containing 0.5 mg l-1  IBA
1 mg l-1  NAA 0.5 mg l-1  NAA 0.2 5mg l-1  NAA 1.0 mg l-1  NAA 0.5 mg l-1  NAA 0.25 mg l-1  NAA
Arka Anamika × A. tetraphyllus (IC 141017)
Callus formation +++ +++ +++ +++ ++ +
Avg. No. of shoots/explants 0.68 ± 0.108 0.89 ± 0.101 0.75 ± 0.113 0.62 ± 0.128 0.16 ± 0.114 0.08 ± 0.106
Shoot regeneration frequency (%) 52 ± 0.152 85 ± 0.113 70 ± 0.115 42 ± 0.110 22 ±0.156 12 ± 0.128
Parbhani Kranti × A. tetraphyllus (IC 141017)
Callus formation ++ +++ ++ ++ + +
Avg. No. of shoots/explants 0.58 ± 0.142 0.92 ± 0.126 0.64 ± 0.136 0.38 ± 0.142 0.28 ± 0.141 0.06 ± 0.128
Shoot regeneration frequency (%) 38 ± 0.126 86 ± 0.125 68 ± 0.129 29 ± 0.139 0.32 ± 0.100 0.14±0.132
Pusa Makhmali × A. tetraphyllus (IC 141017)
Callus formation ++ +++ +++ + + +
Avg. No. of shoots/explants 0.72 ± 0.109 0.88 ± 0.132 0.72 ± 0.134 0.39 ± 0.112 0.39 ± 0.112 0.10 ± 0.109
Shoot regeneration frequency (%) 46 ± 0.132 82 ± 0.136 58 ± 0.128 44 ± 0.110 41 ± 0.108 26 ± 0.121

Root Regeneration

The subculturing of regenerated shoots was done in the media containing different levels of auxins. After 10-15 days of subculturing there was initiation of roots in all cross combination and well developed roots were seen in 3 weeks. Arka Anamika × A. tetraphyllus IC 141017, Pusa Makhmali × A. tetraphyllus IC 141017, Parbhani Kranti × A. Tetraphyllus IC 141017 showed the maximum root regeneration  to the tune of 56.08, 78.28, and 48.12%, respectively in half-strength MS media containing 0.25 mg l-1  IBA + 200mg l-1 and  activated charcoal. Plantlets after proper rooting were transferred to sterilized soil less mixture (cocopeat: vermiculite: perlite in the ration of 1:1:1) in pots as presented in Fig. 3.

Figure 3: (a to h): a) Immature seeds, b)Inoculation of immature seeds, c)Emergence of embryo from immature seed, d)Development of callus from embryo, e)Development of embryonic callus, f)Shoot and Root development g)Acclimatization of invitro development plantlets. Figure 3: (a to h): a) Immature seeds, b)Inoculation of immature seeds, c)Emergence of embryo from immature seed, d)Development of callus from embryo, e)Development of embryonic callus, f)Shoot and Root development g)Acclimatization of invitro development plantlets.

Click here to view figure

Introduction of roots on regenerated shoots is important for establishment of plantlets in soil Kabir et al (2008). Maximum roots were observed in MS media containing 0.25mg l-1  IBA + 200mg l-1  and activated charcoal in the present study. Kabir et al. (2008) also reported good root regeneration by supplementing the MS media with IBA. Activated charcoal was used as anti browning agent. Activated charcoal stimulates nitrogen uptake by shoots and induce a dark environment resulting invitro rooting (Thomas, 2008). However, Muhammad Isshad et al. 2017 suggested that the reduced salt concentration to be effective for invitro rooting due to reduced nitrogen content rather than reduced osmotic potential.  The results also corroborates with Mohammad Irshad et al. (2017) who used 1/2 MS supplemented with IBA and AC (Activated Charcoal) for rooting in okra.

Conclusion

Interspecific hybridization using wild relatives through biotechnological interventions can be the best way to introduce desirable genes absent in the domesticated species. Present study was made with an aim to standardize a protocol of embryo rescue so to obtain the hybrids of Abelmoschus esculentus × A. tetraphyllus IC141017. Out of the four popular cultivars used in crossing, fruit set was observed only in Arka Anamika, Pusa Makhmali, Parbhani Kranti  when A. tetraphyallus IC141017 was used as a male parent. Healthy seeds can only be obtained before 15 d after pollination. Ms media containing on 0.5 mg l-1  NAA + 1.0 mg l-1  IBA  resulted in highest shoot regeneration in cross combinations, viz., Parbhani Kranti × A. tetraphyllus  IC141017, Arka Anamika × A. tetraphyllus IC141017 and Pusa Makhmali × A. tetraphyllus IC 141017. Among these Parbhani Kranti × A. tetraphyllus IC141017 showed greatest number of shoots per explant (0.92±0.12) as well as the maximum frequency of shoot regeneration (86±0.12%). On MS media supplemented with 0.5 mg l-1  NAA + 1.0 mg l-1  IBA, the maximum frequency of shoot regeneration was recorded in Arka Anamika × A. tetraphyllus IC 141017 (86±0.12%) and Pusa Makhmali × A. tetraphyllus IC 141017 (82±0.13%)

Acknowledgment

The authors are thankful to ICAR-National Bureau of Plant Genetic Resources (NBPGR), Indian Institute of Vegetable Research (IIVR), Varanasi and Sher-e- Kashmir University of Agricultural Sciences and Technology (SKUAST),-Jammu for providing the germplasm for conducting the present investigation. The authors are also highly thankful to Department of Science and Technology (DST), Ministry of Science and Technology, Govt. of India for funding the research project entitled, “Alien introgression of Yellow Vein Mossaic Virus (YVMV) resistance genes in okra (Abelmoschus esculentus L) through embryo rescue technique.” under Extra Mural Scheme.”

Conflict of Interest

There is no conflict of interest among authors for honorarium, grants, membership, employment, ownership of stock or any other interest or non‐financial interest such as personal or professional relation, affiliation and knowledge of the research topic of the present research paper.

Funding Source

The present investigation was carried out under the Extra Mural Research project funded by the Department of Science and Technology (DST), Ministry of Science and Technology, Govt. of India.

References

  1. Babu K. V. S and Dutta O. P. Cytogenetic studies of the F1 hybrid Abelmoschus esculentus X tetraphyllus and its amphidiploid. Agric. Res. J. Kerala. 1990; 28:22-25.
  2. Dhande G. A, Patil V. M, Raut R. V, Rajput J. C and Ingle A. G. Regeneration of okra (Abelmoschus esculentus) via apical shoot culture system. Afr. J. Biotechnol. 2012; 11 (86):15226-15230.
  3. Irshad M, He B, Liu S, Mitra S, Debnath B, Li M, and Qiu D. In vitro regeneration of Abelmoschus esculentus cv. Wufu: Influence of anti-browning additives on phenolic secretion and callus formation frequency in explants. Hortic Environ Biotechnol. 2017; 58(5): 503-513.
  4. Jose J and Usha R. Bhendi yellow vein mosaic disease in India is caused by association of a DNA β satellite with a begomovirus. Virol. 2003; 305(2), 310-317.
  5. Kabir A. H, Sarker K. K, Sharmin S. A, Islam M. S, and Alam M. F. Callus induction and plantlet regeneration in Abelmoschus esculentus (L.) Moench.  Agric. Sci. Technol. 2008; 4:193-204.
  6. Mamidwar R B, Nerkar Y S, and Jambhale  N D. Cytogenetics of interspecific hybrids in the genus Abelmoschus [okra, India]. Indian J.Hered. 1979; 11, 35-39.
  7. Meshram L . D and D.  K Dhapake. Cytogenetical studies on an inter-specific hybrid between esculentus (L.) Moench x A. tetraphyllus. In fourth International SABRAO Congress, Kulalampur. 1991.
  8. Prabu Studies on interspecific hybridization for resistance to yellow vein mosaic virus in okra (Doctoral dissertation, Mahatma Phule Krishi Vidyapeeth; Rahuri). 2005.
  9. Rajamony L, Chandran M  and Rajmohan  In vitro embryo rescue of interspecific crosses for transferring virus resistance in okra (Abelmoschus esculentus (L.) Moench). In V International Symposium on In Vitro Culture and Horticultural Breeding 2004; 725, pp. 235-240.
  10. Rana S. C, Singh P. B, Pandita V. K and Sinha S. N. Evaluation of insecticides as seed treatment of control of early sucking pests in seed crop of Annf. Plant Protect. Sci. 2006. 14, 364-367.
  11. Rattan P, Kumar S, Slgotra R . K, Samnotra R. K and Sharma F. Development of interspecific F1 hybrids (Solanum melongena × khasianum) in eggplant through embryo rescue technique. Pl. Cell Tiss. Org. Cult. 2015; 120(1):379-386.
  12. Richardson M. J. An annotated list of seed borne di Third edition. C.M.I. Kew, Surrey, England. 1997; pp. 106- 107.
  13. Sengkhamparn N, Sagis L M, De Vries  R, Schols H A, Sajjaanantakul T, and Voragen A  .Physicochemical properties of pectins from okra (Abelmoschus esculentus (L.) Moench). Food Hydrocoll. 2010; 24(1): 35-41.
  14. Sheela M N. Evaluation of bhendi hybrids for yield and its components. M.Sc. (Agri.) Thesis, Kerala Agricultural University, Thrissur. 1986.
  15. Sindhu S. Inter-specific cross compatibility in the genus Abelmoschus. M.Sc. (Agri.) Thesis, Kerala Agricultural University, Thrissur. 1993.
  16. Thomas T. D. The role of activated charcoal in plant tissue culture. Biotechnol. Adv. 2008;  26(6): 618-63.
  17. Waseem K, Jilani, M. S, Jaskani, M. J, Khan  S, Kiran M,  and Khan G U. Significance of different plant growth regulators on the regeneration of chrysanthemum plantlets (Dendranthema morifolium L.) through shoot tip culture. Pak. J. Bot.  2011; 43(4): 1843-1848.
  18. Zayova E, Vassilevska-Ivanova R, Kraptchev B,  and Stoeva D. Indirect shoot organogenesis of eggplant (Solanum melongena). J. Cent. Eur. Agric. 2012; 13(3) :1-5.

Probiotics: An Alternative Therapeutic Strategy for Covid-19

$
0
0

Introduction

The world today is facing the havoc of SARS- CoV-2 also known as COVID-19. The disease which reportedly was first seen in Wuhan city of China in December 2019 has now spread to nearly 190 countries of the world. It is a zoonotic disease primarily affecting a specie of bats but due to close proximity of animals and humans in the present world it has mutated and attacked humans. The spread of this disease has overwhelmed the healthcare systems of developing as well as developed countries. Various continuously evolving treatment strategies are being currently used ranging from the use of hydroxychloroqin to plasma therapy. Simultaneously several vaccine candidates are in I or II phase of clinical trials which means that currently no specific treatment or preventive vaccine is available. This has greatly emphasized on the need of some alternate therapy not only to combat the pathogen but also to enhance the immunity of the person to make him less prone to the infection as well as with better chances of recovery.

Various studies have shown that gastrointestinal tract is also involved in the spread of the virus as the virus has been isolated from stool samples of the patients 1-6. Further, the study has revealed that corona virus including the novel one can invade enterocytes7 causing severe distress in patients. Probiotic bacteria are well documented for their role in correcting gut dysbiosis8,9, reducing pro inflammatory reactions increasing defense against various pathogens10,  and upgrading mucosal immunity11. They are useful in treating gut dysbiosis12, antibiotic associated diarrhea13,14, irritating bowel syndrome15 etc. Latest studies have shown their impact in treating disorders caused due to gut dysbiosis such as obesity and atopic dermatitis16. This review tries to assess the potentiality of the probiotic strains as an alternate or supplementary therapeutic option for treating the COVID-19 disease.

Gut Microbiota and Viral Respiratory Tract Infections

Numerous studies have focussed on the importance of gut microbiota in defending or providing better immune response against various diseases17-21and respiratory viral infections are no exception. In a study, when mice were treated with antibiotics to deplete gut microbiota, a decrease in antibody production and reduction in influenza virus specific T-cells was observed22, along with increased morbidity and mortality22,23. This occurred due to decreased T- cell numbers and migration rate of dendritic cells. These mice were also unable to stimulate the response of CD4+ T-cell mediated to PR8 antigen. A decrease in number of influenza specific CD8+ T- cells was also observed.

Gut microbes also modulate the macrophage response during viral pulmonary infection. According to a study, the ability of macrophages to limit viral replication was impaired in mice treated with antibiotics along with reduced response to type I and type II IFNs23. The studyhighlighted the importance of gut microbiota in strengthening the immune system against viral infections.

Conversely, different studies have reported that viral respiratory infections, like influenza and Respiratory Syncytial Virus (RSV)causing common cold, have an impact on the gut microbiota24-28. These infections caused a disbalance of gut microbiota by increasing the phylum Bacteroidetes and leading to decrease in phylum Firmicutes28, especially Lactobacillus24,29. This change in gut microbiota composition after influenza infection is due to type- 2 IFN which is produced by T- cells derived in the lung and recruited to the intestine28.

COVID-19 and Gut

Till 2019, there were six known species of coronavirus which caused human diseases. These include severe acute respiratory syndrome coronavirus (SARS-CoV) and Middle East respiratory syndrome coronavirus (MERS-CoV) causing severe respiratory tract infections and had high mortality rate. SARS-CoV-2, or COVID-19 as it is widely known, is the seventh to be added in this category30.

According to the document published by MoHFW31, Govt. of India in coherence with WHO guidelines, the disease presents itself in asymptomatic, mild to severe forms. The common symptoms range from flu like cough, cold, fever to non-specific flu like pneumonia to life threatening severe acute respiratory illness (SARI). It’s a droplet borne infection spreading through direct contact with the patient or through fomites. The lesser common symptoms includes production of sputum, headache, GI symptoms like diarrhoea, nausea, vomiting1,5, thus exhibiting gut- lung crosstalk. Some studies have reported diarrhoea in the range of 1-3.8% patients1,32-34 and other have observed a greater incidence of these symptoms i.e. nausea in 10.1% and vomiting in 3.6%5. These reports highlight the occurrence of gastrointestinal disorders in COVID-19 patients. This was proved by observing viral nucleic acid in anals swabs and fecal samples of COVID-19 patients2,3,6 as well as in fecal samples of patients who had recovered from COVID-19 infections, 11 days ago35.

Earlier studies have reported angiotensin-converting enzyme (ACE-2) as the receptor for binding of SARS-CoV in lung epithelia36,37. This receptor is also found on the cholangiocytes in liver and patients of COVID-19 have shown presence of SARS-CoV-2 in liver38indicating that this virus is also using ACE-2 as receptor for binding host cell39-41. As this receptor is found in intestinal epithelia as well2,3,42-46,thus increasing the possibility of its infection by COVID-19. ACE-2 mutants have shown a decrease in expression of antimicrobial peptides in gut and have shown dysbiosis. Thus, it can be inferred that COVID-19 infection may be related to gut microbiota and its dysbiosis47.

Yet another study found that cellular serine protease known as transmembrane protease serine 2 (TMPRSS-2) is also necessary for entry of COVID -19 in cells along with ACE- 2 receptor48. This expression of TMPRSS- 2 was found in lung alveolar type 2 cells, ileum, oesophageal upper epithelial cells and colon. Therefore, COVID-19 can easily gain entry into these enterocytes and cause infection.

Probiotics and Viral Respiratory Tract Infections

According to FAO/WHO49, probiotics are defined as “live microorganisms, which when administered in adequate amounts confer a health benefit to the host”. Probiotic microorganisms suppress pathogens in host and stimulate the proliferation of epithelial cells and hence provide health benefits to the host. They also regulate the gut microbiota and play an important role in immunomodulation50. Relation between gut microbiota dysbiosis and metabolic disorders and chronic low-grade inflammation has been established in different studies51,52. Beneficial effect of probiotics in alleviating gastrointestinal diseases has been reported by different randomized clinical trials53,50. These benefits may be due to alteration of diversity of gut microbiota by modulating the intestinal immunity, producing growth substrates and by competing for nutrients54.

Viral respiratory tract infections are a major cause of severe morbidity and mortality in human adults worldwide. Both innate55,56 and adaptive22 immune response play an important role for defence against influenza virus infection. Under in vivo conditions, the innate system recognizes the influenza virus through pattern recognition receptors (PRRs), and lead to generation of adaptive immune response. Ichinohe et al57reported reduced influenza virus-specific antibody titre and CD4 T-cell response in antibiotic treated mice along with diminished cytokine secretion and influenza virus specific CTLs. Synthesis of pro IL-1b and pro IL-18 and NLRPs was also found to be diminished.

Oral administration of probiotic microorganisms have been shown to reduce duration and severity of viral infections58,59. During influenza infection in mice L. plantarum has shown to stimulate type-I IFN responses and reduced viral titers in lung60. In another study, Lactobacillus spp. stimulated production of TNF-α and IFN-γ in nasal lymphocytes during influenza infection has been reported61. Ingestion of probiotic cocktail containing Lactobacillus has been shown to stimulate the signal pathways when infected with single-stranded RNA virus62.

Similarly,Bifidobacterium breve YIT 4064 stimulates production of anti- influenza IgG in children63. Bifidobacterium spp. has also lead to enhanced B-cell and T-cell immunity, IFN release and NK cells response64. Even L. rhamnosus GG (ATCC 53103) consumption in children decreased incidence of respiratory tract infections during winter season65. In a study by de Vrese et al66inclusion of L. gasseri PA 16/8, B. longum SP 07/3, B. bifidum MF 20/5 in daily diet reduced the duration of common cold infection. This may be due to immunomodulation by the test organism owing to release of anti-inflammatory cytokines67-69 and stimulation of cytotoxic T cells and T-suppressor cells (CD8+)66.

Amongst the elderly, the fourth most common cause of death is influenza and pneumonia70,71, while 77% deaths are due to infection in gastrointestinal tract72whereas as reportedly ninety percent due to respiratory tract infections73. This age-related diminution of innate and acquired immune system can be controlled by inclusion of functional foods like probiotics in daily diet. L. casei DN 114001 provided through a fermented dairy product reduced the duration of infection of gastrointestinal tract and respiratory tract, especially for upper respiratory tract infection like rhinopharyngitis. Others like L. paracasei and L. johnsonii reduced incidence of infection and improved systems of symptoms of respiratory tract infections74,75.

Probiotics can also regulate the immune system of the intestine as they produce many factors and metabolites which aid in the immunomodulation of the intestine53. Under in vitro conditions,L. reuteri 100-23 has been shown to reduce IL-2 production in bone marrow derived dendritic cells (BMDCs) and increase production of transforming growth factor beta (TGF-b) in mice76.L. reuteri 100-23 colonization has shown to increase number of FoxP3 positive cells in spleen and mesenteric lymph nodes. This suggests that L. reuteri 100-23 regulates inflammation of the gastrointestinal tract by recruiting immune cells and it also regulates recruitment of T-cells to gut epithelium.

Bacteria of genus Bacillus are one of the largest known producers of antimicrobials, out of which more than 795 have been identified77. These peptides have shown antibacteria78, antifungal79 and antiviral propert80. Some species of this genus have also shown probiotic properties81-83. In one such study, probiotic B. subtilis 3 was able to inhibit influenza virus replication under in vitro conditions and saved 30% of mice from death due to the same virus12. It also produced a peptide,P18 which showed homology to Influenza A neutralizing antibody.It had the ability to inhibit the virus completely in vitro from concentrations ranging from 12.5- 100 µg/ml.In mice, it proved as a better treatment by preventing 80% of mice from death due to Influenza as compared to oseltamivir phosphate treatment i.e. Tamiflu,which provided protection to 70% of mice.Overall, it was found more effective than oseltamivir phosphate for elimination of virus after its infection in mice.

Probiotics And COVID-19

Many different studies have shown that ventilator-associated pneumonia and enteritis can be reduced by modulating the gut microbiota48. As of now there is absence of data on whether gut microbiota modulation can help in alleviating symptoms of COVID-19. However, according to guideline of China’s National Health Commission and National Administration of Traditional Chinese Medicine, probiotics may prove useful in treating dysbiosis and preventing secondary bacterial infections and thus treating COVID-19 patients successfully84.

Lactobacillus rhamnosus GG, a probiotic bacterium, has shown its role in improving gut/lung barrier and intestinal homeostasis. It has further shown to down-regulate pro-inflammatory cytokines, up-regulate regulatory T cells and also to better anti-viral defense in respiratory infections85,86. These immunomodulatory actions of Lactobacillus rhamnosus GG can certainly help individuals with COVID-19, or persons at risk of contracting the disease.

Conclusion

The review of literature done suggests that probiotic bacterial genera Lactobacillus, Bifidobacterium and Bacillus have shown great impact on the reinforcement of the immune system and at the same time have balanced the intestinal dysbiosis to ensure improved gut-lung crosstalk. The use of these probiotics for prevention and treatment of COVID-19 requires in-depth scientific study using metaanalysis and randomized clinical trials. At the same time, they can be used as supportive or alternative therapeutic agents that can build good immune responses for better prognosis of COVID-19.

Acknowledgments

The authors wish to thank management of IPS Academy, Indore and Acropolis Institute, Indore for their encouragement and timely help in this review.

Financial Support and Sponsorship

Not applicable

Conflicts of Interest

There are no conflicts of interest among authors

References

  1. Chen N., Zhou M., Dong X., Qu J., Gong F., Han Y., Qiu Y., Wang J., Liu Y., Wei Y., Xia J., Yu T., Zhang X., Zhang L. Epidemiological and clinical characteristics of 99 cases of 2019 novel coronavirus pneumonia in Wuhan, China: a descriptive study. Lancet. 2020; 395(10223): 507-513.
  2. Jin X., Lian J.S., Hu J.H., Jin X., Lian J.S., Hu J.H., Gao J., Zheng L., Zhang Y.M., Hao S.R., Jia H.Y., Cai H., Zhang X.L., Yu G.D., Xu K.J., Wang X.Y., Gu J.Q., Zhang S.Y., Ye C.Y., Jin C.L., Lu Y.F., Yu X., Yu X.P., Huang J.R., Xu K.L., Ni Q., Yu C.B., Zhu B., Li Y.T., Liu J., Zhao H., Zhang X., Yu L., Guo Y.Z., Su J.W., Tao J.J., Lang G.J., Wu X.X., Wu W.R., Qv T.T., Xiang D.R., Yi P., Shi D., Chen Y., Ren Y., Qiu Y.Q., Li L.J., Sheng J., Yang Y. Epidemiological, clinical and virological characteristics of 74 cases of coronavirus-infected disease 2019 (COVID-19) with gastrointestinal symptoms. 2020; 69(6): 1002–1009.
  3. Lin L., Jiang X., Zhang Z., Huang S., Zhang Z., Fang Z., Gu Z., Gao L., Shi H., Mai L., Liu Y. Gastrointestinal symptoms of 95 cases with SARS-CoV-2 infection. Gut. 2020; 69(6): 997-1001.
  4. Pan Y., Zhang D., Yang P., Poon L.L.M., Wang Q. Viral load of SARS CoV-2 in clinical samples. Lancet Infect. Dis. 2020; 20(4): 411–412.
  5. Wang D., Hu B., Hu, C., Zhu, F., Liu, X., Zhang, J., Wang, B., Xiang, H., Cheng, Z., Xiong, Y., Zhao, Y. Clinical characteristics of 138 hospitalized patients with 2019 novel coronavirus–infected pneumonia in Wuhan, China. Jama. 2020; 323(11): 1061-1069.
  6. Zhang W., Du R.H., Li B., Zheng X.S., Yang X.L., Hu B., Wang Y.Y., Xiao G.F., Yan B., Shi Z.L., Zhou P. Molecular and serological investigation of 2019-nCoV infected patients: implication of multiple shedding routes. Microbes Infect.2020; 9(1): 386-389.
  7. Caballero-Franco C., Keller K., De Simone C., Chadee K. The VSL#3 probiotic formula induces mucin gene expression and secretion in colonic epithelial cells. J. Physiol. Gastrointest. Liver Physiol. 2007; 292(1): G315–G322.
  8. Suskovic J., Kos B., Beganovic J., Pavunc A.L., Habjanic K., Matoic S. Antimicrobial activity – the most important property of probiotic and starter lactic acid bacteria. Food Technol. Biotechnol. 2010; 48(3): 296 –307.
  9. Sorokulova I. Modern status and perspectives of Bacillus bacteria as probiotics. Probiotics Health.2013; 1(4): 1-5.
  10. Aureli P., Capurso L., Castellazzi A.M., Clerici M., Giovannini M., Morelli L., Poli A., Pregliasco F., Salvini F., Zuccotti G.V. Probiotics and health: an evidence-based review. Res. 2011; 63(5): 366-376.
  11. Reid G., Younes J.A., Van der Mei H.C., Gloor G.B., Knight R., Busscher H.J. Microbiota restoration: natural and supplemented recovery of human microbial communities. Rev. Microbiol. 2011; 9(1): 27–38.
  12. Starosila D., Rybalko S., Varbanetz L., Ivanskaya N., Sorokulova I. Anti-influenza activity of a Bacillus subtilis probiotic strain. Agents Chemother. 2017; 61(7): 1-11.
  13. Horosheva T., Vodyanoy V., Sorokulova I. Efficacy of Bacillus probiotics in prevention of antibiotic-associated diarrhoea: a randomized, double-blind, placebo-controlled clinical trial. JMM Case Rep. 2014; 1(3): 1-6.
  14. Szajewska H., Kolodziej M. Systematic review with meta-analysis: Lactobacillus rhamnosus GG in the prevention of antibiotic-associated diarrhoea in children and adults. Pharmacol. Ther. 2015; 42(10): 1149 –1157.
  15. Sanders M.E., Guarner F., Guerrant R., Holt P.R., Quigley E.M.M., Sartor R.B., Sherman P.M., Mayer E.A. An update on the use and investigation of probiotics in health and disease. 2013; 62: 787–796.
  16. Reid G. The growth potential for dairy probiotics. Dairy J. 2015; 49: 16 –22
  17. Smith P.M., Howitt M.R., Panikov N., Michaud M., Gallini C.A., Bohlooly-Y M., Glickman J.N., Garrett W.S. The microbial metabolites, short-chain fatty acids, regulate colonic Treg cell homeostasis. Sci. 2013; 341(6145): 569-573.
  18. Khosravi A., Yáñez A., Price J. G., Chow A., Merad M., Goodridge H. S., Mazmanian S.K. Gut microbiota promote hematopoiesis to control bacterial infection. Cell Host Microbe. 2014; 15(3): 374-381.
  19. Erny D., de Angelis A.L.H., Jaitin D., Wieghofer P., Staszewski O., David E., Keren-Shaul H., Mahlakoiv T., Jakobshagen K., Buch T., Schwierzeck V., Utermöhlen O., Chun E., Garrett W.S., McCoy K.D., Diefenbach A., Staeheli P., Stecher B., Amit I., Prinz M. Host microbiota constantly control maturation and function of microglia in the CNS. Neurosci. 2015; 18(7): 965–977.
  20. Mariño E., Richards J.L., McLeod K.H., Stanley D., Yap Y.A., Knight J., McKenzie C., Kranich J., Oliveira A.C., Rossello F.J., Krishnamurthy B. Gut microbial metabolites limit the frequency of autoimmune T cells and protect against type 1 diabetes. Immunol. 2017; 18(5): 552-562.
  21. Haase S., Haghikia A., Wilck N., Müller D.N., Linker R.A. Impacts of microbiome metabolites on immune regulation and autoimmunity. Immunology. 2018; 154(2): 230–238.
  22. Ichinohe T., Lee H.K., Ogura Y., Flavell R., Iwasaki A. Inflammasome recognition of influenza virus is essential for adaptive immune responses. Exp. Med. 2009; 206(1): 79–87.
  23. Abt M.C., Osborne L.C., Monticelli L.A., Doering T.A., Alenghat T., Sonnenberg G.F., Paley M.A., Antenus M., Williams K.L., Erikson J., Wherry E.J., Artis D. Commensal bacteria calibrate the activation threshold of innate antiviral immunity. 2012; 37(1): 158–170.
  24. Wang J., Li F., Wei H., Lian Z-X., Sun R., Tian Z. Respiratory influenza virus infection induces intestinal immune injury via microbiota-mediated Th17 cell-dependent inflammation. Exp. Med.2014; 211(12): 2397–2410.
  25. Deriu E., Boxx G.M., He X., Pan C., Benavidez S.D., Cen L. Influenza virus affects intestinal microbiota and secondary Salmonella infection in the gut through type I interferons. PLoSPathog. 2016; 12(5): 1-26.
  26. Bartley J.M., Zhou X., Kuchel G.A., Weinstock G.M., Haynes L. Impact of age, caloric restriction, and influenza infection on mouse gut microbiome: an exploratory study of the role of age-related microbiome changes on influenza responses. Immunol. 2017; 8: 1-11
  27. Yildiz S., Mazel-Sanchez B., Kandasamy M., Manicassamy B., Schmolke M., Influenza A virus infection impacts systemic microbiota dynamics and causes quantitative enteric dysbiosis. 2018; 6(1): 1-17.
  28. Groves H.T., Cuthbertson L., James P., Moffatt M.F., Cox M.J., Tregoning J.S. Respiratory disease following viral lung infection alters the murine gut microbiota. Immunol. 2018; 9: 1-12.
  29. Marin I.A., Goertz J.E., Ren T., Rich S.S., Onengut-Gumuscu S., Farber E., Wu M., Overall C.C., Kipnis J., Gaultier A. Microbiota alteration is associated with the development of stress-induced despair behaviour. Rep. 2017; 7: 1-10.
  30. Gao Q.Y., Chen Y.X., Fang J.Y. 2019 novel coronavirus infection and gastrointestinal tract. Dig. Dis.2020; 21(3): 125-126.
  31. Ministry of Health & Family Welfare, Government of India, Directorate General of Health Services (EMR Division). Guidelines on Clinical Management of COVID – 19. 2020; 2-5.
  32. Zhu N., Zhang D., Wang W., Li X., Yang B., Song J., Zhao X., Huang B., Shi W., Lu R., Niu P. A novel coronavirus from patients with pneumonia in China, 2019. Engl. J. Med. 2020; 382:727–733.
  33. Guan W.J., Ni Z.Y., Hu Y., Liang W., Ou C., He J., Liu L., Shan H., Lei C., Hui D.S.C., Du B., Li L., Zeng G., Yuen K.Y., Chen R., Tang C., Wang T., Chen P., Xiang J., Li S., Wang J.L., Liang Z., Peng Y., Wei L., Liu Y., Hu Y.H., Peng P., Wang J.M., Liu J., Chen Z., Li G., Zheng Z., Qiu S., Luo J., Ye C., Zhu S., Zhong N. Clinical characteristics of coronavirus disease 2019 in China. Engl. J. Med. 2020; 382(18): 1708-1720.
  34. Huang C., Wang Y., Li X., Ren L., Zhao J., Hu Y., Zhang L., Fan G., Xu J., Gu X., Cheng Z., Yu T., Xia J., Wei Y., Wu W., Xie X., Yin W., Li H., Liu M., Xiao Y., Gao H., Guo L., Xie J., Wang G., Jiang R., Gao Z., Jin Q., Wang J., Cao B. Clinical features of patients infected with 2019 novel coronavirus in Wuhan, China. 2020; 395(10233): 497–506.
  35. Wu Y., Guo C., Tang L., Hong Z., Zhou J., Dong X., Yin H., Xiao Q., Tang Y., Qu X., Kuang L. Prolonged presence of SARS-CoV-2 viral RNA in faecal samples. Lancet Gastroenterol. Hepatol. 2020; 5(5): 434-435.
  36. Anand K., Ziebuhr J., Wadhwani P., Mesters J.R., Hilgenfeld R. Coronavirus main proteinase (3CLpro) structure: basis for design of anti-SARS drugs. 2003; 300(5626): 1763–1767.
  37. Perlman S., Netland J. Coronaviruses post-SARS: update on replication and pathogenesis. Rev. Microbiol. 2009; 7(6): 439–450.
  38. Lu R., Zhao X., Li J, Niu P., Yang B., Wu H., Wang W., Song H., Huang B., Zhu N., Bi Y. Genomic characterisation and epidemiology of 2019 novel coronavirus: implications for virus origins and receptor binding. Lancet. 2020; 395(10224): 565-574.
  39. Wan Y., Shang J., Graham R., Baric R. S., Li F. Receptor recognition by the novel coronavirus from Wuhan: an analysis based on decade-long structural studies of SARS coronavirus. Virol. 2020; 94(7): 1-9.
  40. Wan Y., Shang J., Sun S., Tai W., Chen J., Geng Q., He L., Chen Y., Wu J., Shi Z., Zhou Y. Molecular mechanism for antibody-dependent enhancement of coronavirus entry. Virol, 2020; 94(5): 1-15.
  41. Zhou P., Yang X.L., Wang X.G., Hu B., Zhang L., Zhang W., Si H.R., Zhu Y., Li B., Huang C.L., Chen H.D. A pneumonia outbreak associated with a new coronavirus of probable bat origin. Nature. 2020; 579(7798): 270-273.
  42. Liang W., Feng Z., Rao S., Xiao C., Xue X., Lin Z., Zhang Q., Qi W. Diarrhoea may be underestimated: a missing link in 2019 novel coronavirus. Gut. 2020; 69(6): 1141-1143.
  43. Mazza S., Sorce A., Peyvandi F., Vecchi M., Caprioli F. A fatal case of COVID-19 pneumonia occurring in a patient with severe acute ulcerative colitis. Gut. 2020; 69(6): 1148-1149.
  44. Ong J., Young B.E., Ong S. COVID-19 in gastroenterology: a clinical perspective. Gut. 2020; 69(6): 1144–1145.
  45. Song Y., Liu P., Shi X.L., Chu Y.L., Zhang J., Xia J., Gao X.Z., Qu T., Wang M.Y. SARS-CoV-2 induced diarrhoea as onset symptom in patient with COVID-19. Gut. 2020; 69(6): 1143-1144.
  46. Zhang H., Kang Z., Gong H., Xu D., Wang J., Li Z., Li Z., Cui X., Xiao J., Zhan J., Meng T. Digestive system is a potential route of COVID-19: an analysis of single-cell coexpression pattern of key proteins in viral entry process. Gut. 2020; 69(6): 1010-1018.
  47. Hashimoto T., Perlot T., Rehman A., Trichereau J., Ishiguro H., Paolino M., Sigl V., Hanada T., Hanada R., Lipinski S., Wild B., Camargo S.M.R., Singer D., Richter A., Kuba K., Fukamizu A., Schreiber S., Clevers H., Verrey F., Rosenstiel P., Penninger J.M. ACE2 links amino acid malnutrition to microbial ecology and intestinal inflammation. 2012; 487(7408): 477-481.
  48. Bradley K.C., Finsterbusch K., Schnepf D., Crotta S., Llorian M., Davidson S., Fuchs S.Y., Staeheli P., Wack A. Microbiota-driven tonic interferon signals in lung stromal cells protect from influenza virus infection. Cell Rep. 2019; 28(1): 245-256.
  49. FAO/WHO. Health and Nutritional Properties of Probiotics in Food including Powder Milk with Live Lactic Acid Bacteria, Cordoba, Argentina: Report of a Joint FAO/WHO Expert Consultation. 2001; pp 5.
  50. Thomas C., Versalovic J. Probiotics-host communication: modulation of signaling pathways in the intestine. Gut Microbes. 2010; 1(3): 148–163.
  51. Cani P., Delzenne N. Interplay between obesity and associated metabolic disorders: new insights into the gut microbiota. Opin. Pharmacol.2009; 9(6): 737–743.
  52. Jumpertz R., Le D.S., Turnbaugh, P.J., Trinidad C., Bogardus C., Gordon J I., Krakoff J. Energy-balance studies reveal associations between gut microbes, caloric load, and nutrient absorption in humans. J. Clin. Nutr. 2011; 94(1): 58-65.
  53. Preidis G., Versalovic J. Targeting the human microbiome with antibiotics, probiotics, and prebiotics: gastroenterology enters the metagenomics era. 2009; 136(6): 2015–2031.
  54. O’Toole P., Cooney J. Probiotic bacteria influence the composition and function of the intestinal microbiota. Perspect. Infect. Dis. 2008; 1-9
  55. Allen I.C., Scull M.A., Moore C.B., Holl E.K., McElvania-TeKippe E., Taxman D.J., Guthrie E.H., Pickles R.J., Ting J.P.Y. The NLRP3 inflammasome mediates in vivo innate immunity to influenza A virus through recognition of viral RNA. Immunity. 2009; 30(4): 556–565.
  56. Thomas P.G., Dash P., Aldridge Jr J.R., Ellebedy A.H., Reynolds C., Funk A.J., Martin W.J., Lamkanfi M., Webby R.J., Boyd K.L., Doherty P.C. The intracellular sensor NLRP3 mediates key innate and healing responses to influenza A virus via the regulation of caspase-1. 2009; 30(4): 566-575.
  57. Ichinohe T., Pang I.K., Kumamoto Y., Peaper D.R., Ho J. H., Murray T.S., Iwasaki A. Microbiota regulates immune defense against respiratory tract influenza A virus infection. Nat. Acad. Sci. USA.2011; 108(13): 5354-5359.
  58. De Vrese M., Winkler P., Rautenberg P., Harder T., Noah C., Laue C., Ott S., Hampee J., Schreiber S., Heller K., Schrezenmeir J. Probiotic bacteria reduced duration and severity but not the incidence of common cold episodes in a double blind, randomized, controlled trial. 2006; 24(44-46): 6670–6674.
  59. Vouloumanou E.K., Makris G.C., Karageorgopoulos D.E., Falagas M.E. Probiotics for the prevention of respiratory tract infections: a systematic review. J. Antimicrob. Agents. 2009; 34(3): 1-10.
  60. Maeda N., Nakamura R., Hirose Y., Murosaki S., Yamamoto Y., Kase T., Yoshikai Y. Oral administration of heat-killed Lactobacillusplantarum L-137 enhances protection against influenza virus infection by stimulation of type I interferon production in mice. Immunopharmacol. 2009; 9(9): 1122-1125.
  61. Hori T., Kiyoshima J., Shida K., Yasui H. Augmentation of cellular immunity and reduction of influenza virus titer in aged mice fed Lactobacillus casei strain Shirota. Diagn. Lab. Immunol. 2002; 9(1): 105–108.
  62. Wu S., Jiang Z.Y., Sun Y.F., Yu B., Chen J., Dai C.Q., Wu X.L., Tang X.L., Chen X.Y. Microbiota regulates the TLR7 signaling pathway against respiratory tract influenza A virus infection. Microbiol. 2013; 67(4): 414-422.
  63. Yasui H., Kiyoshima J., Hori T., Shida K. Protection against influenza virus infection of mice fed Bifidobacterium breve Clin. Diagn. Lab. Immunol. 1999; 6(2): 186-192.
  64. Lykova E.A., Vorob’ev A.A., Bokovoĭ A.G., Pobedinskaia I.N., Gevondian V.S., Gevondian N.M., Mitrokhin S.D., Minaev V.I., Dzis N.B., Makkaveeva L.F., Kovalev I.V. Disruption of microbiocenosis of the large intestine and the immune and interferon status in children with bacterial complications of acute viral infections of the respiratory tract and their correction by high doses of bifidumbacterin forte. AntibiotKhimioter= Antibiotics and chemotherapy [sic]. 2000; 45(10): 22-27.
  65. Hatakka K., Savilahti E., Pönkä A., Meurman J. H., Poussa T., Näse L., Saxelin M., Korpela R. Effect of long term consumption of probiotic milk on infections in children attending day care centres: double blind, randomised trial. Med. J. 2001; 322: 1-5
  66. De Vrese M., Winkler P., Rautenberg P., Harder T., Noah C., Laue C., Ott S., Hampee J., Schreiber S., Heller K., Schrezenmeir J. Effect of Lactobacillus gasseri PA 16/8, Bifidobacterium longum SP 07/3, bifidum MF 20/5 on common cold episodes: a double blind, randomized, controlled trial. Clin. Nutr. 2005; 24(4): 481-491
  67. Hessle C., Hanson L. Å., Wold A.E. Lactobacilli from human gastrointestinal mucosa are strong stimulators of IL-12 production. Exp. Immunol.1999; 116(2): 276-282.
  68. Christensen H.R., Frøkiær H., Pestka J.J. Lactobacilli differentially modulate expression of cytokines and maturation surface markers in murine dendritic cells. Immunol. 2002; 168(1): 171-178.
  69. Borruel N., Casellas F., Antolın M., Llopis M., Carol M., Espı́in E., Naval J., Guarner F., Malagelada J. R. Effects of nonpathogenic bacteria on cytokine secretion by human intestinal mucosa. J. Gastroenterol. 2003; 98(4): 865-870.
  70. LaCroix A.Z., Lipson S., Miles T.P., White L. Prospective study of pneumonia hospitalizations and mortality of US older people: the role of chronic conditions, health behaviors, and nutritional status. Public Health Rep. 1989; 104(4): 350-360.
  71. Yoshikawa T.T. Epidemiology and unique aspects of aging and infectious diseases. Infect. Dis. 2000; 30: 931–933.
  72. Djuretic T., Ryan M.J., Fleming D.M., Wall P.G. Infectious intestinal disease in elderly people. Communicable disease report, CDR review. 1996; 6(8): R107-12.
  73. Mouton C.P., Bazaldua O.V., Pierce B., Espino, D.V. Common infections in older adults. Fam. Physician. 2001; 63(2): 257-262.
  74. Bunout D., Barrera G., Hirsch S., V Gattas., de la Maza  , Haschke F., Steenhout P.,  Klassen P., Hager C., Avendano M., Petermann M., Munoz C. Effects of a nutritional supplement on the immune response and cytokine production in free-living Chilean elderly. J. Parenter. Enteral. Nutr. 2004; 28(5): 348–354.
  75. Fukushima Y., Miyaguchi S., Yamano T., Kaburagi T., Iino H., Ushida K., Sato K. Improvement of nutritional status and incidence of infection in hospitalised, enterally fed elderly by feeding of fermented milk containing probiotic Lactobacillus johnsonii La1 (NCC533). J. Nutr. 2007; 98(5): 969-977.
  76. Livingston M., Loach D., Wilson M., Tannock G., Baird M. Gut commensal Lactobacillusreuteri 100–23 stimulates an immunoregulatory response. Cell Biol. 2009; 88(1): 99–102.
  77. Berdy J. Bioactive microbial metabolites. A personal view. Antibiot. (Tokyo). 2005; 58: 1–26.
  78. Ambalam P., Prajapati J.B., Dave J.M., Nair B.M., Ljungh A., Vyas B.R.M. Isolation and characterization of antimicrobial proteins produced by a potential probiotics strain of human Lactobacillusrhamnosus 231 and its effect on selected human pathogens and food spoilage organisms. Ecol. Health Dis. 2009; 21(3-4): 211-220.
  79. Luz C., Saladino F., Luciano F.B., Manes J., Meca G. In vitro antifungal activity of bioactive peptides produced by Lactobacillus plantarum against Aspergillusparasiticus and Penicilliumexpansum. LWT-Food Sci. Technol. 2017; 81: 128-135.
  80. Al Kassaa I., Hober D., Hamze M., Chihib N.E., Drider D. Antiviral potential of lactic acid bacteria and their bacteriocins. Probiotics Antimicrob. Proteins. 2014; 6(3-4): 177-185.
  81. Belapurkar P., Goyal P., Kar A. In vitro evaluation of bioremediation capacity of a commercial probiotic, Bacillus coagulans, for chromium (VI) and lead (II) toxicity. Pharm. Bioallied Sci. 2016; 8(4): 272-276.
  82. Belapurkar P., Goyal P., Kar A. Potential assessment of Bacillus coagulans for bioremediation of Zn (II) and Ni (II): an in vitro Eur. J. Biomed. Pharm. Sci. 2018; 5(1): 627-632.
  83. Goyal P., Belapurkar P., Kar A. In vitro assessment of chromium, lead, cadmium and nickel tolerance of Clausii, a prospective probiotic microorganism for in vivo bioremediation. Biosci. Biotech. Res. Asia. 2020; 17(2): 255-266.
  84. National Health Committee of the People’s Republic of China, National Administration of Traditional Chinese Medicine. Diagnostic and therapeutic guidance for 2019 novel coronavirus disease. 2020; Version 5: 1-11
  85. Harata G., He F., Hiruta N., Kawase M., Kubota A., Hiramatsu M., Yasui H. Intranasal administration of Lactobacillus rhamnosus GG protects mice from H1N1 influenza virus infection by regulating respiratory immune responses.  Appl. Microbiol.2010; 50(6): 597–602
  86. Liu S., Hu P., Du X., Zhou T., Pei X. Lactobacillus rhamnosus GG supplementation for preventing respiratory infections in children: a meta-analysis of randomized, placebo-controlled trials. Indian Pediatr.2013;50(4):377–381

In–Silico Visualization of Gene-Gene Interactions in Autism Spectrum Disorder Genes

$
0
0

Introduction

Autism spectrum disorder (ASD) are known to have an exceedingly complex multigenic neuro-developmental disorder. It manifests as impairments in growth and differentiation of central nervous system which ultimately results in difficulty in speech, communication and social behavior, abnormal response to stimuli, poor eye contact, and repetitive behavior in kids (Bonnet-Brilhault 2017; Hagerman, Rivera, and Hagerman 2008; Kaufmann et al. 2004; Rogers, Wehner, and Hagerman 2001). Autism spectrum disorder shows prevalence of 1 in 68 children affecting male more than females (1 in 42 boys and 1 in 189 girls). Male to female gender ratio came out to be 4:1, as reported for Autism spectrum disorder (Fombonne 2009). The phenotypic variations in Autism spectrum disorder are inherited unlike the environmental factors (Abrahams and Geschwind 2008). It has been reported to be associated with parental hereditary factors, stress, improper uterine environment and other biological causes. These factors have also been correlated with various other disorders such as schizophrenia, fragile X syndrome and mitochondrial disorders.

Several genomic studies were conducted worldwide on the autistic families to discover the genetic association of ASD (Beaudet and Arthur 2007). The studies highlight the baffling genetic as well as phenotypic heterogeneity in ASD.  Genome-wide association studies involve screening to identify deletions, duplications, CNV (copy number variations) and SNPs (Single Nucleotide Polymorphism) that could be correlated with ASD phenotype. Genetic linkage and mutation studies have reported multiple mutations responsible for ASD (Sykes and Lamb 2007). This was seen in a great number of autistic individuals accompanied with their unaffected family members. It could have been a consequence of a sum of variations and impetuous changes in the genetic material during meiosis (Beaudet 2007; Gai et al. 2012). Non-syndromic autism has been shown to be connected to a large number of earlier unknown rare mutations and gene number variations. This was made possible through extensive Genome-wide association studies and other genetic analyses which have been instrumental in throwing light on various associations between these mutations and the pathology. However, the complete mechanisms and cure still remain elusive to the scientific world.

Previous studies indicated a significant amplification in ASD as seen in Mendelian disorders of the Ras/MAPK pathway or (RASopathies). They have all the upregulated typical symptoms of ASD (Zuk et al. 2012) (Consortium and The International Schizophrenia Consortium 2009). In a recent study, RASopathy gene SNPs testified for presence in the Autism Spectrum Disorder patient with GWAS through various pairwise interlinkages of genes that met the standards of genome wide criteria for significance (Shihab, Dawood, and Kashmar 2020). Lastly, an orthogonal approach provided confirmation for the influence of epistasis in Autism spectrum disorder which revealed that the Ras/MAPK pathway plays a pivotal role in idiopathic Autism Spectrum Disorder (Mitra et al. 2017).

Receptor tyrosine kinase is an enzyme responsible for transmitting signals from adjacent cells, particularly activate RAS activity. This successively promotes rapid events leading to energize one or more isoforms of the RAF kinase, accompanied by MEK and ERK kinases activation and, eventually, the expression of target genes. Naturally, this ‘linear’ pathway is submerged in a web of other pathways, as well as enzymes such as mTOR and PI3K. As such, changes in the activity of this matrix affect the product of the ‘canonical’ or standard, RAS pathway. Mutation in the network is an elementary syndromic form of autism, the first suggestive evidence showing that the RAS pathway might be essential in autism.

Recently, string of discoveries has shown that ASD is distinguished by mutations in various genes in the RAS pathway, each of which leads to a gain-of-function of ERK signaling their review of these disorders. Gary Landreth and his fellow workers observed that the collection of phenotypes linked with 16p11.2 deletion — obstruction in the central nervous system, heart and brain, along with facial dysmorphology — is also seen in the RASopathies, comprising DiGeorge syndrome that is caused by the 22q11.2 chromosomal region 4 deletions. If 16p11.2 deletion results in a RASopathy, then one would say the classical RASopathies to demonstrate a high liability to autism (Samuels, Saitta, and Landreth 2009).

Neuronal transcription factor family PAS (Per-Arnt-Sim) domain has two distinct PAS domains that are protein 1 (NPAS1) and NPAS3. These are highly conserved structural sites of multi-ligand binding, responsible for physiological and potential pharmacological modulation in the brain (Zhou et al. 1997; E. W. Brunskill et al. 1999; Rutter et al. 2001; Dudley et al. 2003; Taylor and Zhulin 1999; Wu et al. 2016). Several studies have stated that gene NPAS3 is responsible for human evolution since it comprises of a huge number of human-specific, conserved, fast-evolving and non-coding elements (Kamm, Pisciottano, et al. 2013; Kamm, López-Leal, et al. 2013). It was found to be one of the 27 potent genes revealing repetitive double-stranded DNA break clusters into the neural stem cells. (Wei et al. 2016). The FGFR1 regulates the proliferation of hippocampal granule neurons in the mature hippocampal region of the brain in mouse where NPAS3 regulates the expression (Pieper et al. 2005). On the contrast, we understood from our study that NPAS1 prevents augmentation and plays a pivotal role in MAPK signaling in CGE and MGE progenitors, except not in the regulation of FGF receptor expression, but the process is not yet well known. Preclinical models illustrated the strong inclination towards NPAS3 and NPAS1 which had affected physiologic functioning of the neurons in the brain (Eric W. Brunskill et al. 2005; Erbel-Sieler et al. 2004; Yang et al. 2016). It also revealed the postnatal hippocampal neurogenesis by NPAS3 (Pieper et al. 2005) and significant impediment by NPAS1 (Pieper et al. 2005; Stanco et al. 2014). Many neuropsychiatric conditions are responsible due to several variations in Postnatal hippocampal neurogenesis (Nurnberger et al. 2014; Pieper et al. 2005; Kempermann, Krebs, and Fabel 2008). Studies have shown that mutations in NPAS1 in a set of individuals resulted in autism spectrum disorder (McKnight 2007). Whereas, NPAS3 anomalies were possibly implicated in several neuropsychiatric conditions, including neurological conditions like schizophrenia (Gonzalez-Penas et al.2015; Macintyre et al. 2010; B. S. Pickard et al. 2009; Ben S. Pickard et al. 2005; Kamnasaran et al. 2003; Benjamin S. Pickard et al. 2006), bipolar disorder (B. S. Pickard et al. 2009; Huang et al. 2010; Nurnberger et al. 2014), severe depression (Huang et al. 2010; Weber et al. 2011), attention deficit hyperactivity disorder (ADHD)(Weber et al. 2011) and hindrance in intellectual disability (Ben S. Pickard et al. 2005; Visser et al. 2010; Phelps et al. 2017).

In an experiment of the gene expression using microarray samples, it was seen that NPAS3 was overexpressed in HEK293 cells. HEK293 cell line had an unusual upregulation of NPAS3 which revealed that transcriptional targets differed according to two main factors; circadian rhythm context and Subsequent C-terminal deletion. Ultimately, the NPAS3 gene is highly overexpressed. After processing, The VGF and secretory peptides are known to have roles in neurogenesis and neuroplasticity which is related to learning, memory, cognition, depression, and schizophrenia (Sha et al. 2012). The Pathophysiology of NPAS can be noticeable as it perhaps triggered by an entirely new molecular pathway or maybe by a combinative effect of upsetting original pathways that are related to neuropsychiatric disorders.

Our present work focuses on visualization of gene-gene interactions of Neuronal Per Arnt Sim domain protein (NPAS) which is known to be associated with basic helix-loop-helix family, which is characterized as Npas1, Npas2, Npas3, and Npas4 (Ooe et al. 2004). This Neuronal family has been implicated to play a pivotal role in the epistasis of Autism Spectrum Disorder. Neuronal transcription factor family PAS (Per-Arnt-Sim) are mainly expressed in the brain Neuronal transcription factor family PAS (Per-Arnt-Sim) has two distinct PAS domains protein 1(NPAS1) and NPAS3. These genes have been identified to play a critical role in the development and maintenance of neurons in the brain (Jain 1999, Brunskill et al. 1999) Therefore, substantial studies were conducted using the UCSC browser as a filtering tool in which the top 24 high interacting genes with NPAS3 were identified. Among which only 8 genes showed maximum interlinkage with NPAS3. NPAS3 is known to have a role in Autism Spectrum Disorder and many other neurological diseases. The highly repeating interactions were screened. This study revealed that NPAS3 might not be the only one responsible but instead gene-gene interactions with CRKL might hold the key.  The CRKL gene had the highest interacting gene among all the genes. Therefore, the CRKL gene emerged as the best possible candidate gene for ASD. Deletion or duplication of the CRKL gene can affect multiple genes leading to various birth defects such as Autism Spectrum Disorder, schizophrenia, heart, hearing, or autoimmune defects (Walz, Fonseca, and Lupski 2004). CRKL is a type of substrate created by BCR-ABL tyrosine kinase which is accountable for oncogenic transformations in fibroblast transformation. Computational tools had been used to predict a strong coherence for CRKL and its mutations, which later proposed that CRKL defects in the deleted region of 22q11. 2 of the human chromosome 22 hold the main key for several birth defects. It can change the development of the brain along with the behavior and cognitive functions leading to neuro-developmental disorders like autism spectrum disorder or schizophrenia, which might turn on a particular region of the gene and can cause further changes. The Action-Mechanism of the same is still not known. Homology search was performed using the human protein sequence of CRKL and it showed maximum homology with the horse (Figure 5).

Methodology

Top 24 interacting genes were efficiently screened by UCSC browser and several genes associated with such as- RPH3AL, SP1, TLX3, PATZ1, LEPREL4, PKN2, CFHR4, WWP2, MAP2K6, ADIPOR1, REST, SLC5A12, AMHR2, MED12, JARID2, ZNF787, RBBP7, PDLIM5, PINK1, CARD6, ARHGAP26, CCNE2, INHBE, and CRKL.

The workflow has been explained in Figure 1 and the gene-gene interactions have been visualized in Figure 2.

Figure 1: Graphical illustration of the workflow in the Visualization of Gene-gene Interactions in Autism Spectrum Disorder Genes. Figure 1: Graphical illustration of the workflow in the Visualization of Gene-gene Interactions in Autism Spectrum Disorder Genes.

Click here to view figure

Results And Discussion

Through UCSC browser, these eight genes were known to be related to NPAS3 that are involved in neurodevelopment and other anomalies. They have been stated for its direct or indirect  connection with Autism Spectrum Disorder- SYN1 (Paonessa et al. 2013b), TLX3 (Hernandez-Miranda et al. 2017) (Storm et al. 2009) (Qian 2001) , WWP2 (Kishimoto-Suga 2011), REST (Paonessa et al. 2013a), MED12 (Graham and Schwartz 2013), CRKL (Rapin and Katzman 1998)(Haller et al. 2017)  , JARID2 (Ramos et al. 2012), PDLIM5 (Barh, Blum, and Madigan 2016)(Herrick et al. 2010) (Figure 2 and Table 1).

 Figure 2: Visualization by UCSC Browser of the highest interacting 24 genes and their Gene-Gene Interactions with NPAS3. The nodes are the hub protein with multiple interactions the edges show the interactions. Figure 2: Visualization by UCSC Browser of the highest interacting 24 genes and their Gene-Gene Interactions with NPAS3. The nodes are the hub protein with multiple interactions the edges show the interactions.

Click here to view figure


Table 1: The significance of highly interacting genes in neurological disorders.

Sl.NO Genes Role in Neuropathology  References
1 SYN1 Idiopathic epilepsy and autism (Paonessa et al. 2013b)
2 TLX3 Tlx3 mutations shown to affect the expansion of mostly non-overlapping neuronal populations. (Hernandez-Miranda et al. 2017) (Storm et al. 2009) (Qian 2001)
3 WWP2 WWP1/2performs various roles in synaptic function and development of neurons in the mammalian brain. Impairment of function can lead to neurological disorder (Kishimoto-Suga 2011
4 REST It has as an important element connecting neuronal intrinsic homeostasis and re-establishing a physiological level of activity in the complete neuronal web. Dysfunction is published cause for neurological disorders. Paonessa et al. 2013a)
5 MED12 Member of the large Mediator complex which synchronizes signals involved in cell growth, development, and differentiation.

Extra neuronal gene silencing.

(Graham and Schwartz 2013)
6 CRKL CRKL has a crucial role in the growth of embryo, kidneys and testes development. Deletions or duplication cause multiple birth abnormalities. (Rapin and Katzman 1998) (Haller et al. 2017)
7 JARID2 Formation of neural tube

Necessary for normal heart function.

(Ramos et al. 2012),
8 PDLIM5 Bipolar disorder, schizophrenia and major depression PDLIM5 exists in the postsynaptic density, where it encourages reduced size of dendritic spine head and longer, filopodia-like morphology. (Barh, Blum, and Madigan 2016) (Herrick et al. 2010)


Table 2: The Prominent eight genes and their gene-gene interactions using UCSC browser.

GENES ASSOCIATED WITH OTHER GENES
SYN1 SPTAN1, CALM2, MAPK4, REST, MAPK8, CALM1, MAPK7, CALM3, CA2, EPHB2, MAPK14, CYFIP1, MAPK12, MAPK3, MAPK1, MAPK11, MAPK13, MAPK6, BDNF, MAPK10, MAPK9, SLC6A4, MAPK15, NCF1
TLX3 TLE1, NUDT21, ETS1, SF3B5, HIST1H2BJ, CCNE2, SF3A3, PTPN14, RBBP6, CFHR4, WWP2, TLE2, MAP2K6, ING4, SYNE1, CRKL, AMHR2, ADIPOR1, MOCS3, TEKT2, JARID2, LEPREL4, PINK1, GTF2A1L
WWP2 MIB2, HIST1H4A, HSPA6, HSPA8, TUBB4B, PTEN, MYL12A, DYNLL1, BYSL, CRKL, POU5F1, WDR5, ANP32B, SMARCC1, SLC5A12, SQRDL, DHX8, LEMD3, OPA1, PSPC1, ANP32A, USP34, RNF11, UBE4A
REST KCNIP2, SP140, BARHL1, CAMTA1, ZNF444, BARHL2, MYT1, BDNF, EGR4, VSX1, MEIS3, NEUROG3, SF1, DAXX, GTF21, HIST1H4A, NR1H4, SIX6, GSX1, ONECUT2, MNX1, LHX4, SHOX2
MED12 POLR2J, RPAP1, POLR2B, SELP, ITGA2B, POLR2H, GTF2F1, POLR2C, LEP, POLR2A, INS, CTDP1, POLR2I, BDNF, EPHB2, POLR2D, POLR2E, TNFSF11, POLR2L, GTF2F2, GTF2B, POLR2G, POLR2F, POLR2F, POLR2K
CRKL ITGAX, ITGA1, ITGAV, ITGAE, ITGA2, ITGA9, ITGA3, ITGA7, ITGAD, ITGA6, PIK3CG, JAK3, CBLC, PIK3CA, PIK3CD, JAK1, LAT, PIK3CB, ITGAM, RAP1B, ITGA8, ITGAL, MAP3K1, DBNL
JARID2 ELL, AP1M1, WWP2, BCLAF1, CRKL, AGA, NPAS3, HIST1H3A, STK38, MORC3, EZH2, SUZ12, H3F3A, EED, HIST2H3A, TRIM35, HIST1H4A, HDAC2, MYL4, SETD1A, SOX17, RBBP7, RBBP4, QTRTD1
PDLIM5 HNRNPDL, ACYL, ANP32B, PKM, SUMO1, DIMT1, YBX1, RPS25, NAPG, RSU1, TUBB4B, SNAP23, DIAPH1, ANP32A, CAPZB, DDX47, SUPT5H, NAPA, ELAVL1, HSPA5, CRKL, NCBP1, DLG5, PDCD1O

Interestingly notable, gene CRKL came out to be most interacting (4 out of 8 genes) among the highlighted genes (Table 2). The table marks the involvement of CRKL with TLX3, WWP2, JARID2, and PDLIM5. Hence, it clarifies the direct or indirect connection with neurological disorders as these eight genes are highly susceptible for neurological disorders especially with Autism Spectrum Disorder. Although its proper mechanism is not yet understood, the involvement of these genes cannot go unnoticed in neurological disorders.

Table 3: Gene-Gene interaction between screened out genes and most frequently interacting genes with them (black in color).

Table 3: Gene-Gene interaction between screened out genes and most frequently interacting genes with them (black in color).

Click here to view Table

*Tables 2 and 3, show that CRKL is the gene, which interacts most with the highlighted genes. These results strongly point out to the involvement of direct or indirect connection with neurological disorders especially with Autism Spectrum Disorder. Further work on this gene is to see its physiological effects in Autistic patients.

The CRKL gene is situated in the typically deleted region of 22q11. 2. This region of human chromosome 22 holds the main possibility for many of the birth defects. It was observed that deletion of this region occurs in about 1 in 4,000 births, triggering the loss or duplication of up to 40 genes. Micro deletion or micro duplication in the chromosome can cause a number of developmental disorders that can differ in contrasting severity between the affected individuals. This region of the genes is not well understood, but the consequence of deleted or duplication in the set of these genes can create disruption in the development and function of the cognitive and behavioral functions along with heart, immune system, and craniofacial features. This condition is termed as 22q11.2 deletion syndrome or DiGeorge syndrome.

CRKL is expressed in a diversity of fetal tissues, including heart, spleen, thymus, brain, kidney as well as in liver, lung, and skeletal muscle which is relevant to DiGeorge syndrome. This gene is expressed moderately throughout developmental stages, including in the development of the genitourinary tract in mouse and human.

To decode the functioning of CRKL, scientists prepared model of genetically engineered mice with one copy of CRKL gene. Another group of mice received one copy from the mother and the other gene passed on by the father, lacking both copies of CRKL gene can be fatal for the developing embryos. This highlights the importance of CRKL in embryonic growth. The male mice lacked one copy of CRKL, had a failure of testicular descent into the scrotum which caused cryptorchidism in less-than-normal number of offsprings per litter, and when added with the aging process this subfertility grew into male infertility.

The research conclusions imply that patients with birth defects due to 22q11.2 abnormalities in the gene can give rise to other potential birth defects as seen in patients with DiGeorge syndrome which can affect future health. The influence of CRKL in the gene’s region 22q11.2 affect brain development and behavior and cognitive function, responsible for neurodevelopmental disorders such as bipolar disorder autism spectrum disorder, schizophrenia, heart, hearing or autoimmune defects depending on which particular gene in this region is affected (Haller et al. 2017).

Sequence Retrieval

In the sequence retrieval, we used CRKL (UNIPROT ID P46109) as a query sequence in further BLASTp searches. Precisely, it showed that BLASTp analysis against the non-redundant (nr) and PDB protein database results that the gene CRKL shares significant substantial sequence individuality and resemblance to mammalian proteins. [Table 4]

 Figure 3: Sequence of Human CRKL protein collected from Uniprot Database. Figure 3: Sequence of Human CRKL protein collected from Uniprot Database.

Click here to view figure

Table 4: Analysis of Primary Features – Amino acid composition

Amino acid Symbol No. %
Ala (A) 20 6.6%
Arg (R) 18 5.9%
Asn (N) 16 5.3%
Asp (D) 16 5.3%
Cys (C) 2 0.7%
Gln (Q) 12 4.0%
Glu (E) 19 6.3%
Gly (G) 21 6.9%
His (H) 8 2.6%
Ile (I) 15 5.0%
Leu (L) 20 6.6%
Lys (K) 14 4.6%
Met (M) 6 2.0%
Phe (F) 11 3.6%
Pro (P) 30 9.9%
Ser (5) 24 7.9%
Thr (1) 15 5.0%
Trp (W) 4 1.3%
Tyr (Y) 12 4.0%
Val (V) 20 6.6%
Pyl (0) 0 0.0%
Sec (U) 0 0.0%
(B) 0 0.0%
(2) 0 0.0%
(X) 0 0.0%

Number of amino acids: 303

Molecular weight:  33776.99

Theoretical PI: 6.26

Total number of negatively charged residues (Asp + Glu): 35

Total number of positively charged residues (Arg + Lys):  32

Atomic Compositions

Carbon                 c              1504

Hydrogen            H             2321

Nitrogen              N             419

Oxygen                 O             453

Sulphur                 S                 8

Total                      4705

Formula: C1504H2321N419045358

Extinction coefficients:  4005

Abs 0.1% (=1 g/l) 1.184, assuming all pairs of Cys residues form from Cystines

Extinction coefficients:  39880

Abs 0.1% (=1 g/l) 1.181, assuming all pairs of Cys residues are reduced

The estimated half-life

Mammalian reticulocytes, in vitro: 30 hours

Yeast, in vivo: >20 hours

Escherichia coli, in vivo: >10 hours

Stability

The instability index (II) is computed to be 58.66 This classifies the protein as unstable.

Aliphatic Index: 70.79

Grand average of hydrophobicity: -0.582

Figure 4: Physical Chemical feature of CRKL protein using Protparam Sequence Similarity Analyses. Figure 4: Physical Chemical feature of CRKL protein using Protparam Sequence Similarity Analyses.

Click here to view figure

Expasy (protparam) were used to predict physiological and chemical features of CRKL (Table 4 and Figure 4). It states about the molecular weight, theoretical pI, atomic composition, amino acid composition, aliphatic index, grand average of hydropathicity, instability index, estimated half-life and extinction coefficient of query protein.

The BLASTp query analyses the sequence of CRKL for genomes of related mammals. The results showed that at least one protein shared a consequential sequence uniqueness and likeness as well as significant values, the final outcome was identified in 100% of the queried. While the number of CRKL genes per genome can differ according to species (Table 5)

Table 5: Homology of CRKL with other sequences using BLAST

Selection Description Max Score Total core Query Cover E Value Per.Ident % Accession
ü    Crk-Like Protein [Macau Mulatto]


631 631 100% 0.0 100.00 NP_0012444121
  PREDICTED: Crk-Like Protein [Chlorocebus Sabaeus] 630 630 100% 0.0 99.67 P_007978127.1
ü    Chain A, Crk-Like Protein [Homo Sapiens] 628 628 100% 0.0 99.67 2 L OW_A
ü    Crk-Like Protein [Callithrix Jacchus] 627 627 100% 0.0 99.34 X P_017833667 .1
  PREDICTED: Crk-Like Protein [Saimiri Boliviensis Boliviensis] 626 626 100% 0.0 99.01 XP_003942698.1
ü    Crk-Like Protein [Tupaia Chinensis] 625 625 100% 0.0 98.35 XP_006140254.2
ü    Crk-Like Protein [Aotus Nancymaae] 625 525 100% 0.0 99.01 XP_01 2321931.1
CRIB Like Proto-Oncogene, Adaptor Protein [Molossus Molossus] 624 624 100% 0.0 98.68 KAF6403223.1
ü    Crk-Like Protein [Sapajus Apella] 624 624 100% 0.0 98.68 X P_032127229.1
  PREDICTED: Crk-Like Protein [Cebus Capucinus Imitator] 624 624 100% 0.0 98_35 XP_017374120.1
  PREDICTED: Crk-Like Protein [Miniopterus Natalensis] 623 523 100% 0.0 98_35 P_01 6059814.1
ü    Crk-Like Protein [Tupaia Chinensis] 622 622 100% 0.0 98.35 ELVV72575.1
ü    Crk-Like Protein [Ailuropoda Melanolouca] 621 621 100% 0.0 98.02 XP_002926331.1
ü    Crk-Like Protein [Fukomys Damarensis] 621 621 100% 0.0 98.35 P_01 0619076.1
  PREDICTED: Crk-Like Protein [Mustela Putorius Furo] 621 621 100% 0.0 98.02 X P_004742614.1
  Crk-Like Protein Isoform X1 [Castor Canadensis] 621 621 100% 0.0 98.02 XP_02001 6330.1
ü    Crk-Like Protein [Desmodus Rotundus] 620 620 100% 0.0 98_02 XP_024413072.1
  Crk-Like Protein Isoforni X1 [Eptesicus Fuscus] 620 620 100% 0.0 97.69 X P_008140855.1
ü    Crk-Like Protein [Rhinolophus Ferrumequinum] 620 620 100% 0.0 97.36 X P_032953699.1
  PREDICTED: Crk-Like Protein [Erinaceus Europaeus] 620 620 100% 0.0 98.02 X P_007533835.1
ü    Crk-Like Protein [Suricato Suricatta] 620 620 100% 0.0 97.69 X P_029778460. 1

Multiple Sequence Alignment

The primary sequence of CRKL was equated to a model of mammalian CRKLs by multiple sequence alignments and queries to recognize the conserved protein domains and to form a phylogenetic tree. From which we concluded that the human CRKL sequence is very similar to Horse CRKL sequence (Figure 5).

Figure 5: Phylogenetic trees constructed from homologous sequence. Figure 5: Phylogenetic trees constructed from homologous sequence.

Click here to view figure

Protein-Protein Interactions

The UCSC browser tool was used to identify protein interactions that CRKL interacts in vivo by Using default parameters of the browser. The result from the string clearly indicates that the CRKL gene is clearly connected to NPAS3 gene and along with its interacting genes which is directly or indirectly connected to the Autism Spectrum Disorder as its proper mechanism is not yet understood. CRKL has a strong influence in the fetal tissue which gives rise to a number of birth defects and chromosomal disorders. Autism can only be detected when the offspring is born which makes it difficult to detect the abnormalities. Notably CRKL can be a good target for detecting as it has been a hotspot for a variety of birth defects. Possible understanding and gene decoding can throw some light in the field of autism spectrum disorder. (Figure 6).

Figure 6: Gene-Gene interactions of CRKL using STRING tool. Figure 6: Gene-Gene interactions of CRKL using STRING tool.

Click here to view figure

Conclusion

This study has brought focus on computational analysis to predict gene-gene interactions that were responsible for Autism Spectrum Disorder. The suspected genes seen after several filters showed that CRKL is the key gene responsible for the flaws in interaction. During the analysis of the interactions between the genes CRKL along with other highlighted genes which are responsible for autism spectrum disorder and other neurological diseases. CRKL interacted most with 4 out of 8 highlighted genes like TLX3, WWP2, JARID2, and PDLIM5. This interaction can play a pivotal role directly or indirectly in the disorder. CRKL is a substrate formed by BCR-ABL tyrosine kinase which is responsible for fibroblast transformation by BCR-ABL, that might be oncogenic in behavior. It encodes for a protein kinase that consists of two main domains SH2 and SH3 (src homology). There are mainly two signaling pathways, the RAS and JUN kinase. They are known to be triggered, consequently resulting in the formation as changes in fibroblasts in a RAS-dependent form. Evidence indicating RAS signaling in autism attain from the effective studies of particular genes and from comparisons between autism and condition due to hyperactivation of the RAS pathway — the RASopathies. Gary Landreth and his fellow workers observed that the collection of phenotypes linked with 16p11.2 deletion — obstruction in the central nervous system, heart and brain, along with facial dysmorphology — is also seen in the RASopathies, comprising DiGeorge syndrome that is caused by the 22q11.2 chromosomal region 4 deletions. Various Bioinformatics tools were used that predict strong coherence for CRKL and its mutations it suggested that CRKL defects in the deleted region of 22q11. 2 of the human chromosome 22 hold the main potential for several of the birth defects.  It can hamper the development of brain along with behavior and cognitive function leading to neurodevelopmental disorders like autism spectrum disorder or schizophrenia, depending on which particular region of the gene is affected. After performing homology study using human protein sequence of CRKL it surprisingly showed maximum homology with the horse genome. The role of CRKL during prenatal stages is vital for the growth and development of the embryo. Therefore, identifying any mutations during these phases can be a potential therapeutic intervention in Autism Spectrum Disorder and other neurological disorders. CRKL gene can be a potential biomarker for several birth defects.  Future studies are required to characterize and understand the mechanism of action of the CRKl gene and the biological roles via wet lab and dry lab studies for deeper understanding.

References

  1. Abrahams, Brett S., and Daniel H. Geschwind. 2008. “Advances in Autism Genetics: On the Threshold of a New Neurobiology.” Nature Reviews. Genetics 9 (5): 341–55.
  2. Barh, Debmalya, Kenneth Blum, and Margaret A. Madigan. 2016. OMICS: Biomedical Perspectives and Applications. CRC Press.
  3. Beaudet, Arthur L. 2007. “Autism: Highly Heritable but Not Inherited.” Nature Medicine. https://doi.org/1038/nm0507-534.
  4. Bonnet-Brilhault, F. 2017. “Autism: An early neurodevelopmental disorder.” Archives of pediatrics 24 (4): 384–90.
  5. Brunskill, E. W., D. P. Witte, A. B. Shreiner, and S. S. Potter. 1999. “Characterization of npas3, a Novel Basic Helix-Loop-Helix PAS Gene Expressed in the Developing Mouse Nervous System.” Mechanisms of Development 88 (2): 237–41.
  6. Brunskill, Eric W., David P. Witte, Andrew B. Shreiner, and S. Steven Potter. 1999. “Characterization of Npas3 , a Novel Basic Helix-Loop-Helix PAS Gene Expressed in the Developing Mouse Nervous System.” Mechanisms of Development. https://doi.org/1016/s0925-4773(99)00182-3.
  7. Brunskill, Eric W., Lisa A. Ehrman, Michael T. Williams, Justin Klanke, Daniel Hammer, Tori L. Schaefer, Renu Sah, Gerald W. Dorn 2nd, S. Steven Potter, and Charles V. Vorhees. 2005. “Abnormal Neurodevelopment, Neurosignaling and Behaviour in Npas3-Deficient Mice.” The European Journal of Neuroscience 22 (6): 1265–76.
  8. Consortium, The International Schizophrenia, and The International Schizophrenia Consortium. 2009. “Common Polygenic Variation Contributes to Risk of Schizophrenia and Bipolar Disorder.” Nature. https://doi.org/1038/nature08185.
  9. Drgon, Tomas, Ivan Montoya, Catherine Johnson, Qing-Rong Liu, Donna Walther, Dean Hamer, and George R. Uhl. 2009. “Genome-Wide Association for Nicotine Dependence and Smoking Cessation Success in NIH Research Volunteers.” Molecular Medicine. https://doi.org/2119/molmed.2008.00096.
  10. Dudley, Carol A., Claudia Erbel-Sieler, Sandi Jo Estill, Martin Reick, Paul Franken, Sinae Pitts, and Steven L. McKnight. 2003. “Altered Patterns of Sleep and Behavioral Adaptability in NPAS2-Deficient Mice.” Science 301 (5631): 379–83.
  11. Erbel-Sieler, Claudia, Carol Dudley, Yudong Zhou, Xinle Wu, Sandi Jo Estill, Tina Han, Ramon Diaz-Arrastia, Eric W. Brunskill, S. Steven Potter, and Steven L. McKnight. 2004. “Behavioral and Regulatory Abnormalities in Mice Deficient in the NPAS1 and NPAS3 Transcription Factors.” Proceedings of the National Academy of Sciences of the United States of America 101 (37): 13648–53.
  12. Fombonne, Eric. 2009. “Epidemiology of Pervasive Developmental Disorders.” Pediatric Research. https://doi.org/1203/pdr.0b013e31819e7203.
  13. Gai, X., H. M. Xie, J. C. Perin, N. Takahashi, K. Murphy, A. S. Wenocur, M. D’arcy, et al. 2012. “Rare Structural Variation of Synapse and Neurotransmission Genes in Autism.” Molecular Psychiatry 17 (4): 402–11.
  14. González-Peñas, Javier, Manuel Arrojo, Eduardo Paz, Julio Brenlla, Mario Páramo, and Javier Costas. 2015. “Cumulative Role of Rare and Common Putative Functional Genetic Variants at NPAS3 in Schizophrenia Susceptibility.” American Journal of Medical Genetics. Part B, Neuropsychiatric Genetics: The Official Publication of the International Society of Psychiatric Genetics 168 (7): 528–35.
  15. Graham, John M., Jr, and Charles E. Schwartz. 2013. “MED12 Related Disorders.” American Journal of Medical Genetics. Part A 161A (11): 2734–40.
  16. Hagerman, Randi, Susan Rivera, and Paul Hagerman. 2008. “The Fragile X Family of Disorders: A Model for Autism and Targeted Treatments.” Current Pediatric Reviews. https://doi.org/2174/157339608783565770.
  17. Haller, Meade, Qianxing Mo, Akira Imamoto, and Dolores J. Lamb. 2017. “Murine Model Indicates 22q11.2 Signaling Adaptor CRKL Is a Dosage-Sensitive Regulator of Genitourinary Development.” Proceedings of the National Academy of Sciences. https://doi.org/1073/pnas.1619523114.
  18. Haller, Meade, Qianxing Mo, Akira Imamoto, and Dolores J. Lamb. 2017. “Murine Model Indicates 22q11.2 Signaling Adaptor CRKL Is a Dosage-Sensitive Regulator of Genitourinary Development.” Proceedings of the National Academy of Sciences. https://doi.org/1073/pnas.1619523114.
  19. Hernandez-Miranda, Luis Rodrigo, Pierre-Louis Ruffault, Julien C. Bouvier, Andrew J. Murray, Marie-Pierre Morin-Surun, Niccolò Zampieri, Justyna B. Cholewa-Waclaw, et al. 2017. “Genetic Identification of a Hindbrain Nucleus Essential for Innate Vocalization.” Proceedings of the National Academy of Sciences of the United States of America 114 (30): 8095–8100.
  20. Herrick, Scott, Danielle M. Evers, Ji-Yun Lee, Noriko Udagawa, and Daniel T. S. Pak. 2010. “Postsynaptic PDLIM5/Enigma Homolog Binds SPAR and Causes Dendritic Spine Shrinkage.” Molecular and Cellular Neurosciences 43 (2): 188–200.
  21. Huang, Jie, Roy H. Perlis, Phil H. Lee, A. John Rush, Maurizio Fava, Gary S. Sachs, Jeffrey Lieberman, et al. 2010. “Cross-Disorder Genomewide Analysis of Schizophrenia, Bipolar Disorder, and Depression.” The American Journal of Psychiatry 167 (10): 1254–63.
  22. Jain, Sanjay. 1999. Characterization of BHLH-PAS Superfamily of Transcription Factors.
  23. Kamm, Gretel B., Francisco Pisciottano, Rafi Kliger, and Lucía F. Franchini. 2013. “The Developmental Brain Gene NPAS3 Contains the Largest Number of Accelerated Regulatory Sequences in the Human Genome.” Molecular Biology and Evolution 30 (5): 1088–1102.
  24. Kamm, Gretel B., Rodrigo López-Leal, Juan R. Lorenzo, and Lucía F. Franchini. 2013. “A Fast-Evolving Human NPAS3 Enhancer Gained Reporter Expression in the Developing Forebrain of Transgenic Mice.” Philosophical Transactions of the Royal Society of London. Series B, Biological Sciences 368 (1632): 20130019.
  25. Kamnasaran, D., W. J. Muir, M. A. Ferguson-Smith, and D. W. Cox. 2003. “Disruption of the Neuronal PAS3 Gene in a Family Affected with Schizophrenia.” Journal of Medical Genetics 40 (5): 325–32.
  26. Kaufmann, Walter E., Ranon Cortell, Alice S. M. Kau, Irena Bukelis, Elaine Tierney, Robert M. Gray, Christiane Cox, George T. Capone, and Pia Stanard. 2004. “Autism Spectrum Disorder in Fragile X Syndrome: Communication, Social Interaction, and Specific Behaviors.” American Journal of Medical Genetics. Part A 129A (3): 225–34.
  27. Kempermann, Gerd, Julia Krebs, and Klaus Fabel. 2008. “The Contribution of Failing Adult Hippocampal Neurogenesis to Psychiatric Disorders.” Current Opinion in Psychiatry 21 (3): 290–95.
  28. Kishimoto-Suga, Mika. 2011. “The Role of the HECT-Type Ubiquitin Ligases WWP1 and WWP2 in Nerve Cell Development and Function.” Doctor of Philosophy (PhD), Georg August University Göttingen. https://d-nb.info/1043999159/34.
  29. Macintyre, Georgina, Tyler Alford, Lan Xiong, Guy A. Rouleau, Philip G. Tibbo, and Diane W. Cox. 2010. “Association of NPAS3 Exonic Variation with Schizophrenia.” Schizophrenia Research 120 (1-3): 143–49.
  30. McKnight, Steven. 2007. “Relevance of NPAS1/3 Balance to Autism and Schizophrenia.” SFARI, October. https://www.sfari.org/funded-project/relevance-of-npas13-balance-to-autism-and-schizophrenia/.
  31. Mitra, Ileena, Alinoë Lavillaureix, Erika Yeh, Michela Traglia, Kathryn Tsang, Carrie E. Bearden, Katherine A. Rauen, and Lauren A. Weiss. 2017. “Reverse Pathway Genetic Approach Identifies Epistasis in Autism Spectrum Disorders.” PLoS Genetics 13 (1): e1006516.
  32. Nurnberger, John I., Daniel L. Koller, Jeesun Jung, Howard J. Edenberg, Tatiana Foroud, Ilaria Guella, Marquis P. Vawter, and John R. Kelsoe. 2014. “Identification of Pathways for Bipolar Disorder: A Metaanalysis.” JAMA Psychiatry 71 (6): 657.
  33. Ooe, Norihisa, Koichi Saito, Nobuyoshi Mikami, Iwao Nakatuka, and Hideo Kaneko. 2004. “Identification of a Novel Basic Helix-Loop-Helix-PAS Factor, NXF, Reveals a Sim2 Competitive, Positive Regulatory Role in Dendritic-Cytoskeleton Modulator Drebrin Gene Expression.” Molecular and Cellular Biology. https://doi.org/1128/mcb.24.2.608-616.2004.
  34. Paonessa, Francesco, Shahrzad Latifi, Helena Scarongella, Fabrizia Cesca, and Fabio Benfenati. 2013. “Specificity Protein 1 (Sp1)-Dependent Activation of the Synapsin I Gene (SYN1) Is Modulated by RE1-Silencing Transcription Factor (REST) and 5′-Cytosine-Phosphoguanine (CpG) Methylation.” Journal of Biological Chemistry. https://doi.org/1074/jbc.m112.399782.
  35. Paonessa, Francesco, Shahrzad Latifi, Helena Scarongella, Fabrizia Cesca, and Fabio Benfenati. 2013a. “Specificity Protein 1 (Sp1)-Dependent Activation of the Synapsin I Gene (SYN1) Is Modulated by RE1-Silencing Transcription Factor (REST) and 5′-Cytosine-Phosphoguanine (CpG) Methylation.” Journal of Biological Chemistry. https://doi.org/1074/jbc.m112.399782.
  36. Phelps, Randall, Anne Tsai, Arlene Hagen, Joseph Pinter, Raegan Smith, and Martin T. Stein. 2017. “The Curse of the Dolphins: Cognitive Decline and Psychosis.” Journal of Developmental and Behavioral Pediatrics: JDBP 38 Suppl 1: S16–18.
  37. Pickard, B. S., A. Christoforou, P. A. Thomson, A. Fawkes, K. L. Evans, S. W. Morris, D. J. Porteous, D. H. Blackwood, and W. J. Muir. 2009. “Interacting Haplotypes at the NPAS3 Locus Alter Risk of Schizophrenia and Bipolar Disorder.” Molecular Psychiatry 14 (9): 874–84.
  38. Pickard, Ben S., M. P. Malloy, D. J. Porteous, D. H. R. Blackwood, and W. J. Muir. 2005. “Disruption of a Brain Transcription Factor, NPAS3, Is Associated with Schizophrenia and Learning Disability.” American Journal of Medical Genetics Part B: Neuropsychiatric Genetics. https://doi.org/1002/ajmg.b.30204.
  39. Pickard, Benjamin S., Andrew A. Pieper, David J. Porteous, Douglas H. Blackwood, and Walter J. Muir. 2006. “TheNPAS3gene—emerging Evidence for a Role in Psychiatric Illness.” Annals of Medicine 38 (6): 439–48.
  40. Pieper, Andrew A., Xinle Wu, Tina W. Han, Sandi Jo Estill, Quyen Dang, Leeju C. Wu, Sarah Reece-Fincanon, et al. 2005. “The Neuronal PAS Domain Protein 3 Transcription Factor Controls FGF-Mediated Adult Hippocampal Neurogenesis in Mice.” Proceedings of the National Academy of Sciences of the United States of America 102 (39): 14052–57.
  41. Qian, Y. 2001. “Formation of Brainstem (nor)adrenergic Centers and First-Order Relay Visceral Sensory Neurons Is Dependent on Homeodomain Protein Rnx/Tlx3.” Genes & Development. https://doi.org/1101/gad.921501.
  42. Ramos, Paula S., Satria Sajuthi, Carl D. Langefeld, and Stephen J. Walker. 2012. “Immune Function Genes CD99L2, JARID2 and TPO Show Association with Autism Spectrum Disorder.” Molecular Autism 3 (1): 4.
  43. Rapin, Isabelle, and Robert Katzman. 1998. “Neurobiology of Autism.” Annals of Neurology. https://doi.org/1002/ana.410430106.
  44. Rogers, S. J., D. E. Wehner, and R. Hagerman. 2001. “The Behavioral Phenotype in Fragile X: Symptoms of Autism in Very Young Children with Fragile X Syndrome, Idiopathic Autism, and Other Developmental Disorders.” Journal of Developmental and Behavioral Pediatrics: JDBP 22 (6): 409–17.
  45. Rutter, J., M. Reick, L. C. Wu, and S. L. McKnight. 2001. “Regulation of Clock and NPAS2 DNA Binding by the Redox State of NAD Cofactors.” Science 293 (5529): 510–14.
  46. Samuels, Ivy S., Sulagna C. Saitta, and Gary E. Landreth. 2009. “MAP’ing CNS Development and Cognition: An ERKsome Process.” Neuron. https://doi.org/1016/j.neuron.2009.01.001.
  47. Sha, L., L. MacIntyre, J. A. Machell, M. P. Kelly, D. J. Porteous, N. J. Brandon, W. J. Muir, et al. 2012. “Transcriptional Regulation of Neurodevelopmental and Metabolic Pathways by NPAS3.” Molecular Psychiatry 17 (3): 267–79.
  48. Shihab, Ammar I., Faten A. Dawood, and Ali H. Kashmar. 2020. “Data Analysis and Classification of Autism Spectrum Disorder Using Principal Component Analysis.” Advances in Bioinformatics 2020 (January): 3407907.
  49. Stanco, Amelia, Ramón Pla, Daniel Vogt, Yiran Chen, Shyamali Mandal, Jamie Walker, Robert F. Hunt, et al. 2014. “NPAS1 Represses the Generation of Specific Subtypes of Cortical Interneurons.” Neuron 84 (5): 940–53.
  50. Storm, R., J. Cholewa-Waclaw, K. Reuter, D. Brohl, M. Sieber, M. Treier, T. Muller, and C. Birchmeier. 2009. “The bHLH Transcription Factor Olig3 Marks the Dorsal Neuroepithelium of the Hindbrain and Is Essential for the Development of Brainstem Nuclei.” Development. https://doi.org/1242/dev.027193.
  51. Sykes, Nuala H., and Janine A. Lamb. 2007. “Autism: The Quest for the Genes.” Expert Reviews in Molecular Medicine 9 (24): 1–15.
  52. Taylor, B. L., and I. B. Zhulin. 1999. “PAS Domains: Internal Sensors of Oxygen, Redox Potential, and Light.” Microbiology and Molecular Biology Reviews: MMBR 63 (2): 479–506.
  53. Visser, Remco, Antoinet Gijsbers, Claudia Ruivenkamp, Marcel Karperien, H. Maarten Reeser, Martijn H. Breuning, Sarina G. Kant, and Jan M. Wit. 2010. “Genome-Wide SNP Array Analysis in Patients with Features of Sotos Syndrome.” Hormone Research in Paediatrics 73 (4): 265–74.
  54. Walz, Katherina, Patricia Fonseca, and James R. Lupski. 2004. “Animal Models for Human Contiguous Gene Syndromes and Other Genomic Disorders.” Genetics and Molecular Biology. https://doi.org/1590/s1415-47572004000300001.
  55. Weber, Heike, Sarah Kittel-Schneider, Alexandra Gessner, Katharina Domschke, Maria Neuner, Christian P. Jacob, Henriette N. Buttenschon, et al. 2011. “Cross-Disorder Analysis of Bipolar Risk Genes: Further Evidence of DGKH as a Risk Gene for Bipolar Disorder, but Also Unipolar Depression and Adult ADHD.” Neuropsychopharmacology: Official Publication of the American College of Neuropsychopharmacology 36 (10): 2076–85.
  56. Wei, Pei-Chi, Amelia N. Chang, Jennifer Kao, Zhou Du, Robin M. Meyers, Frederick W. Alt, and Bjoern Schwer. 2016. “Long Neural Genes Harbor Recurrent DNA Break Clusters in Neural Stem/Progenitor Cells.” Cell 164 (4): 644–55.
  57. Wu, Dalei, Xiaoyu Su, Nalini Potluri, Youngchang Kim, and Fraydoon Rastinejad. 2016. “NPAS1-ARNT and NPAS3-ARNT Crystal Structures Implicate the bHLH-PAS Family as Multi-Ligand Binding Transcription Factors.” eLife 5 (October). https://doi.org/7554/eLife.18790.
  58. Yang, Dongxue, Wenbo Zhang, Arshad Padhiar, Yao Yue, Yonghui Shi, Tiezheng Zheng, Kaspar Davis, et al. 2016. “NPAS3 Regulates Transcription and Expression of VGF: Implications for Neurogenesis and Psychiatric Disorders.” Frontiers in Molecular Neuroscience 9 (November): 109.
  59. Zhou, Y. D., M. Barnard, H. Tian, X. Li, H. Z. Ring, U. Francke, J. Shelton, J. Richardson, D. W. Russell, and S. L. McKnight. 1997. “Molecular Characterization of Two Mammalian bHLH-PAS Domain Proteins Selectively Expressed in the Central Nervous System.” Proceedings of the National Academy of Sciences of the United States of America 94 (2): 713–18.
  60. Zuk, O., E. Hechter, S. R. Sunyaev, and E. S. Lander. 2012. “The Mystery of Missing Heritability: Genetic Interactions Create Phantom Heritability.” Proceedings of the National Academy of Sciences. https://doi.org/10.1073/pnas.1119675109.

Comparison of Various Diagnostic Techniques Used to Identify the Presence of Anti-SARS-CoV-2 Immunoglobulin G

$
0
0

Background

In 2019 a new strain of the coronavirus disease, now dubbed COVID-19, was first transmitted to humans. COVID-19 can lead to serious and even life-threatening infectious respiratory disease. This disease is principally triggered by severe acute respiratory syndrome coronavirus 2 (SARS-CoV-2), which has been found to be highly transmissible between humans [1-3].

COVID-19 shares many symptoms of the common flu, but it has extrapulmonary manifestations, including pneumonia and acute respiratory distress syndrome. Other effects of COVID-19 infections include acute kidney injury and detrimental impacts on other organ systems, particularly the neurologic, hepatic, cardiac, endocrine, and gastrointestinal systems; it may also cause thromboembolisms [4,5].

Accurately diagnosing SARS-CoV-2 is essential so that patients with the virus can be quickly quarantined to stop the spread of the disease, thus saving people’s lives. Polymerase chain reaction (PCR) testing remains the standard approach used by healthcare workers to directly detect viral RNA in suspected COVID-19 cases in the early stage of contagion [6]. The human antibody response is an altered technique that is often used to assess a patient’s viral exposure and detect the formed immunity to COVID-19 infection. Any antibodies to COVID-19 developed following infection may be detectable in a patient’s blood within a few days. Such antibodies may provide some protection to the human body, but at present there is no clear evidence of how long this formed immunity lasts or the possibility of reinfection [7,8].

Antibody testing may identify certain forms of antibodies linked to COVID-19 infections, including binding antibodies and neutralizing antibodies. Binding antibodies are developed in any response to COVID-19, while neutralizing antibodies are effective in blocking the virus. Although COVID-19 antibody testing is still not fully understood, it could help significantly in identifying people who may possibly be protected from reinfection with the virus [9].

In this study we present the overall experience of a serological test for COVID-19 patients by comparing the various diagnostic techniques used to identify the presence of SARS-CoV-2 Immunoglobulin G, which will benefit the healthcare system.

Materials and Method

Serum was collected from COVID-19 patients of various ages and genders being treated at the Security Forces Hospital in Riyadh, Saudi Arabia, whose results were confirmed by PCR. A total of 20 serum samples were examined for SARS-COV-2 IgG antibody following a minimum of 3 days from the confirmed PCR result. The tested samples were drawn from 10 male and 10 female patients in total; the mean age for both genders was 36.85 years. Four different techniques were applied to determine the presence of SARS-COV-2 antibodies: Chemiluminescence immunoassay (CLIA), enzyme-linked immunosorbent assay (ELISA), electro-chemiluminescence immunoassay (ECLIA), and rapid testing.

CLIA was used to identify specific IgG antibodies to SARS-CoV-2 (COVID-19) in the human serum samples. This technique comprises a “flash” chemiluminescence technology with paramagnetic microparticle solid phase. The patient, controls, and calibrators were measured by a photomultiplier as relative light units. The anti-SARS-COV-2 ELISA (IgG) uses the plate-based assay technique ELISA to detect and quantify peptides, proteins, and antibodies. In this method an antigen must be immobilized on a solid surface and then complexed with an antibody linked to an enzyme. The patient, controls, and calibrator are then measured by photometric based on color intensity. ECLIA testing is based on a ruthenium complex and tripropylamine. The chemiluminescence reaction used to detect the reaction complex is initiated by applying a voltage to the sample solution. Rapid testing is a one-step method of determining SARS-CoV-2 IgG: A lateral flow immunochromatographic assay is used to detect the presence of IgG specific to SARS-CoV-2 virus in human serum. The reaction forms an antigen-antibody-antibody-gold particle complex and the results are interpreted using the color band at the T-line area.

Results

In the current study examining the 20 selected patients for SARS-CoV-2 IgG antibodies using four different methods produced different outcomes depending on the technique used (See Table 1). The CLIA test indicated that 18 of the 20 patients were producing SARS-CoV-2 IgG; the other two patients tested negative, one of whom had contracted the virus more than 14 days previously and the other only 3 days before. The ELISA test produced results identical to those of the CLIA method, and the same patients were found to be positive and negative for antibodies, respectively. The ECLIA technique revealed the presence of SARS-CoV-2 IgG in the samples of 16 out of 20 patients. Of the four patients who tested negative, two of them were the same patients who tested negative using the CLIA and ELISA tests; of the two remaining patients, one had contracted the virus 14 days previously and the other more than 21 days previously. Finally, rapid testing showed clearly inconsistent results in terms of determining SARS-CoV-2 IgG in the examined patients. A total of six patients tested negative for SARS-CoV-2 IgG: The two patients who showed no detectable antibodies in any of the methods used, the two patients who were also found to be negative using the ECLIA method, and two more patients who tested positive using the other methods. Correspondingly, analysis of the data obtained using the CLIA technique revealed SARS-CoV-2 IgG in 90 percent of all of the examined patients, which was confirmed using the ELISA technique. The ECLIA method revealed an immune response in 80 percent of the examined patients, while rapid testing detected antibodies in only 70 percent of the patients (Fig.1).

Figure 1: The presented data illustrate the percentage of detectable SARs-CoV-2 IgG in four different methods. Figure 1: The presented data illustrate the percentage of detectable SARs-CoV-2 IgG in four different methods.

Click here to view figure

Table 1: The presented data illustrate the determination of SARs-CoV-2 IgG using different techniques. Age and gender is presented.

Patient NO# Sex Age (years) Period of Serum Collection (days) CLIA


ELISA ECLIA RAPID TEST
PATIENT 1 F 38 17 + + + +
PATIENT 2 M 39 11 + + + +
PATIENT 3 F 44 29 + + + +
PATIENT 4 F 37 13
PATIENT 5 M 19 14 + +
PATIENT 6 F 43 25 + + + +
PATIENT 7 F 31 23 + + + +
PATIENT 8 M 33 27 + + + +
PATIENT 9 F 50 30 + + + +
PATIENT 10 F 35 36 + + + +
PATIENT 11 F 38 34 + + + +
PATIENT 12 F 33 36 + + + +
PATIENT 13 M 40 25 + + + +
PATIENT 14 M 34 24 + + + +
PATIENT 15 M 36 24 + + + +
PATIENT 16 M 33 22 + +
PATIENT 17 F 35 15 + + +
PATIENT 18 M 45 20 + + +
PATIENT 19 F 29 24 + + + +
PATIENT 20 M 45 3

Discussion

The antibodies known as immunoglobulins are produced by lymphocytes and act as a protective proteins to counteract the expression of a foreign body (antigen), such as a pathogen. Testing for serological antibodies is often used diagnoses and to determine whether a person has been exposed to a particular virus [6,9]. Antibody tests for COVID-19 could play a key role in diagnosing SARS-CoV-2 infections, but this issue is still not clear and further research is unquestionably needed. In the current study, four methods (CLIA, ELISA, ECLIA, and rapid testing) were applied to investigate the immune response following exposure to SARS-CoV-2; however, the results were inconsistent. The CLIA and ELISA techniques detected SARS-CoV-2 antibodies in all excluding two of the examined serum specimens, indicating that the immune systems of 18 patients had produced antibodies to the SAR-CoV-2 antigen and that these individuals could be immune to reinfection. Both the CLIA and ELISA techniques revealed that those patients tested only 3 days after exposure to the virus were negative for SARS-CoV-2 IgG, which seems to be normal given that the human body requires time to generate antibodies when first infected. Neither the CLIA nor the ELISA method detected SARS-CoV-2 IgG in the patients who had been exposed 13 days prior to testing, which could indicate the importance of the timing of the tests. The production of IgG begins within 21 days of the onset of symptoms, which could be another reason for the negative immune response results. Comparing ECLIA technique to the CLIA and ELISA methods indicated that fewer number patients had generated IgG; only 16 patients tested positive, while the other four tested negative. Two of these four had also tested negative using the CLIA and ELISA methods, as discussed above, and the other two had been exposed to the virus 14 days and 22 days, respectively, prior to testing. The reason that no immunoglobulin was detected in these patients using this method could be the sensitivity of the technique. Using rapid testing to investigate SARS-CoV-2 IgG in the selected patients revealed obvious inconsistencies with the other three methods. In this case, six of the 20 patients were found to be negative for IgG. In addition to the two patients found to be negative using CLIA and ELISA tests and the further two patients identified using the ECLIA test, the additional two patients had been exposed more than 14 days before testing. Rapid testing was limited in terms of detecting IgG antibodies compared to the other three techniques, which is a disadvantage and could indicate that this technique is not ideal for assessing the presence of SARS-CoV-2 IgG in the human body. More importantly, various factors can affect testing for antibodies, including the amount of antibodies present in the sample, the time since exposure to the virus, and the sensitivity of the technique used [8].

Concluding Remarks

Antibody testing is valuable when performed appropriately with sensitive techniques. Accurate serological testing methods are needed to determine the immune response to SARS-COV2 infection and subsequent, aiding in diagnosis. More importantly, it is essential that further studies be conducted to elucidate the remaining mysteries of COVID-19 antibody testing.

Acknowledgements

We acknowledge our colleagues in nursing department in security forces hospital for sustenance and Blood sample Collection from COVID19 patients.

Conflict of Interest

The authors declare there are no conflict of interest

Funding Sources

No funding to declare

References

  1. Fauci, A.S., H.C. Lane and R.R. Redfield, Covid-19 – Navigating the Uncharted. N Engl J Med, 2020. 382(13): p. 1268-1269.
  2. Bai, Y., L. Yao, T. Wei, F. Tian, D.Y. Jin, L. Chen and M. Wang, Presumed Asymptomatic Carrier Transmission of COVID-19. JAMA, 2020. 323(14): p. 1406-1407.
  3. Kucharski, A.J., T.W. Russell, C. Diamond, Y. Liu, J. Edmunds, S. Funk, R.M. Eggo and C.-w.g. Centre for Mathematical Modelling of Infectious Diseases, Early dynamics of transmission and control of COVID-19: a mathematical modelling study. Lancet Infect Dis, 2020. 20(5): p. 553-558.
  4. Gupta, A., M.V. Madhavan, K. Sehgal, N. Nair, S. Mahajan, T.S. Sehrawat, B. Bikdeli, N. Ahluwalia, J.C. Ausiello, E.Y. Wan, et al., Extrapulmonary manifestations of COVID-19. Nat Med, 2020. 26(7): p. 1017-1032.
  5. Rothan, H.A. and S.N. Byrareddy, The epidemiology and pathogenesis of coronavirus disease (COVID-19) outbreak. J Autoimmun, 2020. 109: p. 102433.
  6. Xiang, F., X. Wang, X. He, Z. Peng, B. Yang, J. Zhang, Q. Zhou, H. Ye, Y. Ma, H. Li, et al., Antibody Detection and Dynamic Characteristics in Patients with COVID-19. Clin Infect Dis, 2020.
  7. Lu, H., C.W. Stratton and Y.W. Tang, An evolving approach to the laboratory assessment of COVID-19. J Med Virol, 2020.
  8. Jacofsky, D., E.M. Jacofsky and M. Jacofsky, Understanding Antibody Testing for COVID-19. J Arthroplasty, 2020. 35(7S): p. S74-S81.
  9. Deshpande, G.R., G.N. Sapkal, B.N. Tilekar, P.D. Yadav, Y. Gurav, S. Gaikwad, H. Kaushal, K.S. Deshpande, O. Kaduskar, P. Sarkale, et al., Neutralizing antibody responses to SARS-CoV-2 in COVID-19 patients. Indian J Med Res, 2020.

Production of Rhamnolipids by Pseudomonas aeruginosa AP029-GLVIIA and Application on Bioremediation and as a Fungicide

$
0
0

Introduction

Surfactants are an important class of chemical compounds synthesized in large part by petroleum derivatives (Gudiña et al., 2015a; Padilha et al., 2015) They are formed by hydrophobic and hydrophilic portions, which are distributed at the interface between liquid phases causing the decrease of surface and interfacial tensions ( Akbari et al., 2018; Ehinmitola et al., 2018; Gudiña et al., 2016; Grüninger et al., 2019; Mondal et al., 2015; Mondal et al., 2016, Mondal et al., 2017a). The surfactant production is expected to increase to 24 million tons and be worth approximately $ 120 million by 2020 (Jiang et al., 2020).

Currently, the studies about biosurfactants have been expanded due to the high environmental impact caused by some chemical surfactants. In addition to having similar properties to chemical surfactants, these amphiphilic bioproducts have advantages such as biodegradability, low toxicity and stability under extreme conditions of pH, temperature and salinity (França et al., 2015). Surfactants have potential to be applied in numerous products or fields, such as, detergents, paints, paper products, pharmaceuticals, cosmetics, petroleum, food, and water treatment (Costa et al., 2010; Mondal et al., 2017b).

Biosurfactants can be produced by different strains of microorganisms (bacteria, filamentous fungi and yeasts) using renewable raw materials with low cost as a substrate (Abdel-Mawgoud et al., 2010; Araújo et al., 2013). These molecules are classified into five major groups: lipopeptides, glycolipids, fatty acids, phospholipids and polymeric biosurfactants (Geetha et al., 2018).

Among the glycolipids there are the rhamnolipids, composed of rhamnose molecules and one or two units of β-hydroxydecanoic acid, which are present mainly in four isoforms (Mulligan, 2005). The production of these molecules occurs predominantly by Pseudomonas aeruginosa and the z is classified as mono and di-rhamnolipids according to the amount of rhamnose present in the structure. In addition, the proportion of these two forms can be influenced by nutritional and environmental conditions of microbial growth (Oluwaseun et al., 2017; Varjani and Upasani, 2017). Mono-rhamnolipids congeners show increase emulsification and antimicrobial properties in comparison to di-rhamnolipids (Sood et al., 2020). Other species of Pseudomonas have also been reported as producing rhamnolipids, such as P. chlororaphis, P. plantarii, P. putida and P. fluorescens (Randhawa and Rahman, 2014). The main characteristics of these biosurfactants are related to their ability to reduce the surface tension of water to between 28 and 30 mN/m, reduce interfacial tension between water and hydrocarbons, and have a critical micelle concentration (CMC) between 10 and 200 mg/L (França et al., 2015; Gudiña et al., 2015a).

Although can be applied in different areas, the production of biosurfactant on a large scale is not yet totally feasible, since the cost with the production and recovery of this product is relatively high (Souza et al., 2018). However, an alternative to reduce production costs would be the use of low-cost raw materials such as frying oils, sugarcane and beet molasses and cassava wastewater (Banat et al., 2014). But, even with some limitations it is estimated that in 2023 approximately 524 tons of biosurfactant will be traded, which will be responsible for a turnover of US$ 2.7 billion (Felipe and Dias, 2017).

In this context, the objective of this study was to evaluate the production of rhamnolipids by Pseudomonas aeruginosa AP029-GLVIIA by varying the carbon/nitrogen ratio (C/N), based on a simple and affordable source of carbon and energy (glucose), and the percentage of inoculum. Thus, the produced rhamnolipids were characterized in terms of CMC, emulsification index, bioremediation and antifungal activity against the species Candida albicans and Candida tropicalis.

Material and Methods

Chemical

The main chemicals used during this study were corn oil (Cargil Co. – SP, Brazil), D-glucose (Synth Co. – SP, Brazil), hexadecane (Sigma Co., USA), iron sulfate II heptahydrate (Synth Co. – SP, Brazil), kerosene (Líder Co. – RN, Brazil), magnesium sulfate heptahydrate (Synth Co. – SP, Brazil), monobasic potassium phosphate (Synth Co. – SP, Brazil), motor oil (Petronas Co.-MG, Brazil), peptone (BD Co. – SP, Brazil), sodium chloride (Cinética Co. – PR, Brazil), sodium nitrate (Cinética Co. – PR, Brazil), sodium phosphate dibasic heptahydrate (Synth Co. – SP, Brazil), soybean oil (Bunge Co. – SP, Brazil), and yeast extract (BD Co. – SP, Brazil) they were all of analytical grade.

Microorganism and Maintenance

Pseudomonas aeruginosa AP029-GLVIIA was isolated from an oil well in the city of Mossoró (Rio Grande do Norte, Brazil) and deposited in the culture collection of the Department of Antibiotics in the Federal University of Pernambuco (UFPE – Brazil). The microorganism was maintained in petri dish with PCA (Plate Count Agar) at 5 °C (Araújo et al., 2017).

Inoculum and Culture Medium

For inoculum the microorganism was transferred from the petri dish to 250 mL conical flasks containing 100 mL of medium consisting of 3.0 g/L yeast extract, 5.0 g/L sodium chloride and 5.0 g/L peptone at pH 7.0 then after 24 hours of cultivation at 38 °C and 200 rpm, aliquots were transferred to the production medium (Peng et al., 2012). The production medium (pH 6.5) consisted of a saline solution of MgSO4.7H2O (1.0 g/L), Na2HPO4.7H2O (1.1 g/L), KH2PO4 (1.5 g/L), NaNO3 (2.0 g/L), FeSO4.7H2O (0.1 g/L) and glucose. The influence of glucose on the production of rhamnolipids was evaluated by varying its concentration for 10.0, 18.0 and 26.0 g/L.

Five runs were performed in order to evaluate different culture conditions. The percentage of inoculum was 3.0, 10.0 and 17.0% (v/v) and the C/N ratio was 5, 9 and 13. All experiments were assayed in duplicate at 38 °C and 200 rpm for 72 hours using 100 mL of solution (production medium and inoculum) in 250 mL flasks. The pH of the crude broth was measured by potentiometer mPA 210 (Tecnopon, Brazil) and adjusted to 8.0. Then the medium containing the rhamnolipids was centrifuged (centrifuge 5804 R, Eppendorf, USA) at 1370 x g for 10 minutes and the supernatant obtained was used for further analysis.

Analytical Methods

Determination of Biomass

The biomass quantification was performed by the dry mass method as described by Bezerra et al. (2012). The crude broth was centrifuged (centrifuge 5415 D, Eppendorf, Germany) at 15700 x g for 15 minutes. Each point was measured in triplicate and the cell concentration (g/L) was estimated according to Equation 1:

Cbiomass = ((mass of the tube with biomass-Empty tube mass) / 2)  x 1000              (1)

Determination of Glucose

Glucose quantification was evaluated by the 3,5 dinitro-salicylic acid (DNS) method according to Miller (1959). The analyses were performed in triplicate.

Avaliation of Total Proteins

Measurement of total proteins was performed according to Bradford (1976). The assays were performed in duplicate.

Recovery and Quantification of the Rhamnolipids

The recovery of the rhamnolipids was performed first by acid precipitation of the supernatant I obtained from the centrifugation as commented in topic 2.2. The cell-free broth was acidified to pH 2.0 using HCl (6M) and stored at 4 °C overnight. The sample was then centrifuged at 1370 x g for 10 minutes. The supernatant from that centrifugation was discarded and 5 mL of distilled water and petroleum ether in the ratio of 1: 1 (v/v) were added to the precipitate. This procedure was repeated three times and at each repetition the emulsion formed by the ether and the rhamnolipids were removed and stored. Finally, the organic phase obtained from the last step was taken to the rotary evaporator V-850 (Büchi, Switzerland). Ten mL of distilled water was added to the obtained concentrate and stored (Peng et al., 2012). The quantification of the rhamnolipids was performed by the thioglycolic colorimetric method according to Oliveira et al. (2013).

Properties of the Biosurfactant

Critical Micellar Concentration (CMC)

Different dilutions of a 100 mg/L crude rhamnolipids mixture (1.65, 4.96, 6.20, 9.92, 24.82, 33.08, 49.63 and 100 mg/mL) were performed to determine the CMC. The surface tension for each defined concentration was measured using the Phoenix 150 SEO tensiometer and the CMC values were obtained in triplicate (Araújo et al., 2017).

Emulsification Index

The emulsification index was determined by the method of Cooper and Goldenberg (1987). In this case 2.0 mL of supernatant I was added to a tube containing 2.0 mL of the working solvent: hexadecane, toluene, kerosene, soybean oil, corn oil and motor oil. After 24 hours, the emulsification index (E) was measured according to Equation 2, described by Wei et al. (2005). These measurements were repeated every 15 days until completing 90 days and were performed in triplicate.

E (%) = (height of the emulsion/ total height)100                                                (2)

Assessment of Potential for Bioremediation

The evaluation for oil recovery was carried out using sand from a beach (Praia do Meio) of Natal (RN) – Brazil, containing 10% (w/w) of oil in Erlenmeyers of 250 mL. The mixture was allowed to stand for 24 hours and, subsequently, 40 mL of rhamnolipids (1.0 g/L) were added to each flask. Samples were incubated at 40 °C and 100 rpm for 24 h. Then the water/oil mixture was centrifuged at 5000 rpm for 25 minutes in order to quantify the mass of purified oil. The control assay was performed using distilled water under the same conditions and all experiments were performed in triplicate (Gudiña et al., 2015a; Pereira et al., 2013).

Evaluation of Antifungal Activity

The tests to evaluate the antifungal activity of the biosurfactant were carried out following the methodology described by the Clinical and Laboratory Standards Institute (CLSI) with modifications (Cockerill et al., 2012). The antifungal action of purified and unpurified rhamnolipids was evaluated against two yeast strains: Candida albicans ATCC 90028 and Candida tropicalis ATCC 13803. In a 96-well plate, 50.0 μL of the fungal suspension with 105 CFU/mL in Müeller Hinton broth (MH), supplemented with 0.2% glucose, were added to the rhamnolipids (7.425, 3.71, 1.85 , 0.93 and 0.46 μg/mL) and fluconazole (0.58 μg/mL) and then incubated at 35.0 ± 2.0 °C, under agitation of 200 rpm. The optical density at 595 nm was evaluated using a microplate reader (Epoch Biotek, Winooski) at zero time and after 24 hours.

Statistical Analysis

The analysis of the emulsification index and the antifungal activity were performed in triplicate and evaluated by the Tukey test using the software Statistica 7.0 (StatSoft Co, USA) and GraphPad Prism 5.0 (La Jolla California, USA).

Results and Discussion

Production of Rhamnolipids

Rhamnolipid production by Pseudomonas aeruginosa AP029-GLVIIA using glucose as substrate was evaluated by changing the C/N ratio and the percentage of inoculum added to the culture medium. In the five conditions studied, the concentrations of biomass, glucose, rhamnolipid and total proteins were analyzed, as well as pH variation.

According to Table 1, it can be seen that as the C/N ratio increased there was an increase in both biomass formation and rhamnolipid production. Indeed, it is known that these metabolites formation is favored under nitrogen limiting conditions Santos et al. (2002). The highest production of biosurfactant occurred for a ratio C/N of 13 with percentage of inoculum of 3.0%. It should be highlighted that Sousa et al. (2014) found a similar result producing rhamnolipids using glycerol as the carbon source. But, comparing the runs 2, 4 and 5, in which there was an increase in the amount of inoculum, it was observed that the product and the biomass had their values decreased and increased, respectively. The decrease in the amount of biosurfactant produced may be associated with the Quorum Sensing (QS) shown by Pseudomonas aeruginosa. The QS consists of a bacterial communication system capable of coordinating functions as motility and virulence agents, as well as controlling the levels of important compounds for biofilms formation, such as rhamnolipids, lectin A and siderophores (Kariminik et al., 2017). In general, the production of rhamnolipids was favored by using a higher C/N ratio and a lower percentage of inoculum.

During the cultivation, glucose consumption varied from 82.5 to 90.4%, then showing good assimilation of the substrate by the microorganism. In addition, the highest consumption occurred for the first 24 hours of each experiment. The values are of the same magnitude as shown by Bezerra et al. (2012); Sousa et al. (2014) that obtained substrate uptake of 91.9 and 50.8%, respectively, when used cassava wastewater and glycerol as substrate. Different carbon sources have been used for the production of rhamnolipids, for instance, Ramírez et al. (2015) investigated the olive-mill waste and Varjani and Upasani (2016) evaluated crude oil, nonane, decane, dodecane, N-paraffins, kerosene, diesel, xylene, glucose and glycerol, with glucose being the substrate that presented the highest yield in production of rhamnolipids. Additionally, Mondal et al. (2017) used different carbon sources and observed that glucose provided the best result for the biosurfactant synthesis.

According to Table 1, the concentration of total proteins increased in proportion to the increase in the amount of rhamnolipid, probably because these metabolites are capable of increasing the permeability of the cell membrane, and consequently, the concentration of proteins in the medium (Shao et al., 2017). However, the decrease in the protein concentration as shown in the runs 4 and 5 may be associated with the production of proteases but the rhamnolipids production was almost unchanged due to the QS (Bouyahya et al., 2017).

With regard to pH during cultivation it ranged from 5.88 to 8.20 when considering all runs performed, however for the maximum rhamnolipids concentration it ranged between 6.28 and 6.58. Similar results were shown by Varjani and Upasani (2017) that reported that rhamnolipids synthesis by Pseudomonas sp. is favored by pH between 6.0 and 6.5. In addition, the production of total proteins showed an interesting relationship with pH. It can be seen that as protein concentration increases there was an increase in the pH value, as shown in Figure 1, indicating metabolism for proteins formation with ammonium formation that affected pH by increasing it (Santos et al., 2002).

Table 1: Effect of C/N ratio and percentage of inoculum on rhamnolipid production, cell growth, pH and total protein production.

Run C/N Ratio Inoculum

(%)

Biomass

(g/L)

Time1

(h)

Rhamnolipid

(g/L)

Time2

(h)

pH3 Total proteins

(g/L)

1 5 3 1.33 0.02 12 0.30  0.00 4 6.52  0.03 0.149  0.01
2 9 3 1.57  0.06 24 0.78  0.01 60 6.28  0.05 0.248  0.01
3 13 3 2.50  0.04 24 0.84  0.06 24 6.44  0.05 0.426  0.00
4 9 10 2.03  0.20 12 0.39  0.03 12 6.58  0.03 0.233 0.00
5 9 17 1.93  0.14 10 0.40  0.01 48 6.46  0.00 0.123  0.00

1,2 Time at which maximum values of biomass and product were reached, respectively.

3pH corresponding to the highest concentration of rhamnolipids obtained in the assay.

Figure 1: Cell growth profile, substrate consumption, rhamnolipid production and pH as a function of time for run 3 (C/N of 13 and 3% inoculum). Figure 1: Cell growth profile, substrate consumption, rhamnolipid production and pH as a function of time for run 3 (C/N of 13 and 3% inoculum).

Click here to View Figure

Characterization of Biosurfactant

Critical Micellar Concentration (CMC)

In the present study the CMC of the unpurified (crude) rhamnolipids produced by P. aeruginosa AP029-GLVIIA was evaluated. The CMC determination was performed by measuring the surface tension of the cell free broth corresponding to the point of greatest rhamnolipid concentration (24 hours, run 3). The rhamnolipids produced were able to reduce the surface tension of water from 71.94 ± 1.07 to 29.42 ± 1.41 mN/m with a CMC of 49.63 mg/L. It is emphasized that the CMC depends on the pH, temperature, ionic strength and surfactant structure. But, as the rhamnolipids were synthesized in ionic medium, the influence of pH will be more significant when compared to the other mentioned parameters. An interesting fact concerns the variation in the value of CMC when considering the different isoforms adopted by rhamnolipids (Kłosowska-Chomiczewska et al., 2017). Samadi et al. (2012) observed that for a mixture of rhamnolipids (RLs), CMC was 22 mg/L and surface tension of 26 mN/m. However, when it was applied only mono-rhamnolipids (RL1), the CMC decreased to 15 mg/L while the tension reached 25 mN /m. Finally, for a mixture of di-rhamnolipids (RL2) the CMC reached 30 mg/L and tension of 29.5 mg/L. Gogoi et al., (2016) when studying rhamnolipid production obtained CMC values of 110 and 72 mg/L for crude and purified rhamnolipid, respectively. Regarding the surface tension, the purified rhamnolipid reached 29.5 mN/m. In contrast, Sodium Dodecyl Sulphate (SDS), a chemical surfactant widely used in industry, has CMC values of up to 2890 mg/L and surface tension of 37 mN/m. Thus, when comparing these values with those of the rhamnolipids, it can be seen that the the latter has higher efficiency, since the values obtained are smaller (Bognolo, 1999).

Emulsification index

The formation of the emulsion occurs when a liquid phase is dispersed in the form of droplets in a continuous liquid phase (Desai and Banat, 1997). Emulsification tests were performed with the cell-free supernatant (24 hours, run 3) and they were determined using six organic solvents: hexadecane, toluene, kerosene, soybean oil, corn oil and motor oil. In order to evaluate the stability of the emulsion formed, the indices were measured every 15 days until to complete 90 days.

Figure 2 shows the results of the emulsion formed in the first 24 hours: corn oil (57.47%), toluene (58.62%), soybean oil (59.32%), kerosene (62.07%), hexadecane (66.30%) and motor oil (77.55%). There were oscillations over time, but the emulsification index values remained above 50% for the hydrocarbons, except for the toluene which kept the emulsion for only 24 hours. In relation to the oils only the corn was unable to maintain the emulsion higher than 50% in the last 30 days. In all solvents the emulsion formed at the top of the system, indicating that the rhamnolipids are responsible for forming water-in-oil (W/O) emulsions (Nguyen and Sabatini, 2011)

Figure 2: Emulsification index determined at different times in oils (A) and hydrocarbons (B). Letters or set of equal letters did not present a statistically significant difference (p <0.05). Figure 2: Emulsification index determined at different times in oils (A) and hydrocarbons (B).

Click here to View Figure

Table 2 presents a comparison among the present study and of the emulsification indexes of some biosurfactants shown by reports on literature about the solvents herein assayed.

Table 2: Comparison of emulsification indexes of different biosurfactants

Microorganisms Carbon Sources Solvents Emulsification index References
Pseudomonas aeruginosa AP029/GLVIIA Glucose Hexadecane, toluene, kerosene, soybean oil, corn oil and motor oil 57.47 to 77.55% This study
Pseudomonas aeruginosa LBI Natural oils Kerosene and toluene 70 to 100% Costa et al. (2006)
Pseudomonas aeruginosa AP029/GLVIIA Cassava Kerosene 65% (Bezerra et al. (2012)
Pseudomonas aeruginosa #112 Corn steep liquor and molasse Hexadecane 60% Gudiña et al. (2016)
Pseudomonas

aeruginosa UCP0992

Corn steep liquor Soy, corn and motor oil 62.5 to 100% Rufino et al. (2016)
Pseudomonas aeruginosa NCIM 5514 Glucose Hidrophobic solvents 17.1 to 82.3% Varjani and Upasani (2016)
Bacillus subtilis ICA56 Glucose Motor oil 79% França et al. (2015)

Assessment of Potential for Bioremediation

In this study, a previous test for the recovery of contaminated sand oil was carried out. From the experiment it was possible to determine that the rhamnolipids were able to remove 16.8 ± 1.6% of the petroleum when compared to the control test (sand/ petroleum/distilled water). When studying different surfactins produced by species of Bacillus subtilis, Pereira et al. (2013) achieved oil removal results between 19.0 and 22.0% using a 1.0 g/L rhamnolipid solution. In similar work, Gudiña et al. (2015b) obtained values of 15.0, 26.3 and 25.1% when using 1.0, 2.5 and 5.0 g/L surfactin. On the other hand, Gudiña et al. (2015a) produced rhamnolipids and used them to removal of petroleum showing values of 22.1; 43.7 and 55.0% for the same concentrations of rhamnolipids presented in the present study. Recently, Das and Kumar (2019) demonstrated that biosurfactant was able to recover 46.5% of the crude oil present at a sand pack column.

Evaluation of Antifungal Activity

Analyses of antimicrobial activity were performed using purified and unpurified rhamnolipids, however, only the purified one was able to inhibit the growth of the microorganisms Candida albicans ATCC 90028 and Candida tropicalis ATCC 13803. Figure 3 shows the inhibition of fungi versus the concentrations of rhamnolipids (7.42, 3.71, 1.85, 0.93 and 0.46 μg/mL) and the applied control, fluconazole, (0.58 μg / mL). According to the results, the concentration of rhamnolipid showing higher antifungal activity was 7.42 μg/mL for the two yeasts assayed. In addition, to Candida tropicalis the biosurfactant concentration of 3.71 μg/mL did not show statistical difference when compared with the control (fluconazole) while for yeast Candida albicans all tested concentrations have similar action to fluconazole.

Figure 3: Evaluation of the antifungal activity of the purified rhamnolipid incubated against the fungi Candida albicans (Ca) and Candida tropicalis (Ct). Figure 3: Evaluation of the antifungal activity of the purified rhamnolipid incubated against the fungi Candida albicans (Ca) and Candida tropicalis (Ct).

Click here to View Figure

The present study demonstrates that the rhamnolipids produced by P. aeruginosa AP029-GLVIIA have potential to act as antifungal agents.

Abalos et al. (2001) used rhamnolipids to inhibit the growth of the following microorganisms: Aspergillus niger and Gliocadium virens (16 μg/mL), Chaetomium globosum, Penicillium chrysogenum and Aureobasidium pullulans (32 μg/mL), Botrytis cinerea and Rhizoctonia solani (18 μg/mL). The values presented in parentheses correspond to the Minimum Inhibitory Concentration (MIC).

In addition to antifungal activity, rhamnolipids also have a high potential to inhibit bacterial growth. Tedesco et al. (2016) applied biosurfactants against the bacteria Staphylococcus aureus and Burkholderia cepacia obtaining values MIC of 1.56 and 3.12 μg/mL. Oluwaseun et al. (2017) evaluated the antimicrobial activity of rhamnolipids, produced by Pseudomonas aeruginosa C1501, against various microorganisms (Staphylococcus aureus, Bacillus cereus, Escherichia coli, Saccharomyces cerevisiae, Aspergillus flavus and Aspergillus niger). The results showed that this bioproduct has the capacity to be used at industrial, food and biomedical applications. On the other hand, Ndlovu et al. (2017) studied the antibacterial and antifungal activity of biosurfactant extracts by Bacillus amyloliquefaciens and Pseudomonas aeruginosa against antibiotic resistant (Staphylococcus aureus, Escherichia coli) and fungal pathogens (Candida abicans, Cryptococcus neoformans). The biosurfactant presented antimicrobial action about all microorganisms analyzed.

Recently, Ferreira et al. (2019) investigated the antimicrobial activity of rhamnolipids against Gram-positive and Gram-negative food pathogens (Bacillus cereus, Listeria monocytogenes and Staphylococcus aureus) under different pH. The study suggests that the biosurfactant can be enhanced in acid food.

Conclusion

The Pseudomonas aeruginosa AP029-GLVIIA was able to produce rhamnolipids using glucose as the carbon source. The best condition for rhamnolipids production and biomass formation was using a C/N ratio and inoculum percentage of 13.0 and 3.0%, respectively. The rhamnolipids were able to form stable emulsions in different organic solvents, besides presenting satisfactory responses in relation to surface tension (29.42 ± 1.41 mN/m) and critical micellar concentration (49.63 mg/L). In addition, the tests of oil removal and antifungal activity showed that this kind of biosurfactant has potential for interesting biotechnological applications.

Acknowledgements

The authors thank CAPES and CNPq (Grant: 305251/2017-1) for the financial support for this work.

Compliance with Ethical Standards

Conflict of Interest

Authors declare there is no conflict of interest.

Funding Source

The authors thank CAPES and CNPq (Grant: 305251/2017-1) for the financial support for this work.

References

  1. Padilha C. E. A., Padilha C. A. A., Souza D. F. S. et al. Prediction of rhamnolipid breakthrough curves on activated carbon and Amberlite XAD-2 using Artificial Neural Network and Group Method Data Handling models . J. Mol. Liq. 2015; 206:293–299.
  2. Gudiña E. J., Rodrigues A. I., Alves E. et al. Bioconversion of agro-industrial by-products in rhamnolipids toward applications in enhanced oil recovery and bioremediation. Bioresour. Technol. 2015; 177:87–93.
  3. Gudiña E. J., Rodrigues A. I., Freitas V. et al. Valorization of agro-industrial wastes towards the production of rhamnolipids. Bioresour. Technol. 2016; 212:144–50.
  4. Jiang J., Zu Y., Li X. et al. Recent progress towards industrial rhamnolipids fermentation: process optimization and foam control. Bioresour. Technol. 2020; 298:1–10.
  5. França I. W. L., Lima A. P., Lemos J. A. M. et al. Production of a biosurfactant by Bacillus subtilis ICA56 aiming bioremediation of impacted soils. Catal. Today. 2015; 255:10–15.
  6. Akbari S., Abdurahman N. H., Yunus R. M., Fayaz F., Alara O. R. Biosurfactants—a new frontier for social and environmental safety: a mini review. Biotechnology Research and Innovation. 2018; 2: 81-90.
  7. Costa S. G. V. A. O., Nitschke M., Lépine F. et al. Structure, properties and applications of rhamnolipids produced by Pseudomonas aeruginosa L2-1 from cassava wastewater. Process Biochem. 2010; 45:1511–16.
  8. Abdel-Mawgoud A. M., Lépine F., Déziel E. Rhamnolipids: Diversity of structures, microbial origins and roles. Applied Microbiology and Biotechnology. 2010; 86:1323–36.
  9. Araújo L. V., Freire D. M. G., Nitschke M. Biossurfactantes: propriedades anticorrosivas, antibiofilmes e antimicrobianas. Quim. Nova. 2013; 3:848–58.
  10. Grüninger J., Delavault A., Ochsenreither K. Enzymatic glycolipid surfactant synthesis from renewables. Process Biochemistry. 2019; 87: 45-54.
  11. Geetha S. J., Banat I. M., Joshi S. J. Biosurfactants: Production and Potential applications in Microbial Enhanced Oil Recovery (MEOR). Biocatal. Agric. Biotechnol. 2018; 14:1–30.
  12. Mulligan C. N. Environmental applications for biosurfactants. Environ. Pollut. 2005; 133:183–98.
  13. Oluwaseun A. C., Kola O. J., Mishra P. et al. Characterization and optimization of a rhamnolipid from Pseudomonas aeruginosa C1501 with novel biosurfactant activities. Sustain. Chem. Pharm. 2017; 6:26–36.
  14. Varjani S. J., Upasani V. N. Critical review on biosurfactant analysis, purification and characterization using rhamnolipid as a model biosurfactant. Bioresour. Technol. 2017; 232:389–97.
  15. Sood U., Singh D. N., Hira P. et al. Rapid and solitary production of mono-rhamnolipid biosurfactant and biofilm inhibiting pyocyanin by a taxonomic outlier Pseudomonas aeruginosa strain CR1. J. Biotechnol. 2020; 307:98–106.
  16. Randhawa K. K. S., Rahman P. K. S. M. Rhamnolipid biosurfactants-past, present, and future scenario of global market. Front. Microbiol. 2014; 5:1–7.
  17. Souza K. S. T., Gudiña E. J., Schwan R. F. et al. Improvement of biosurfactant production by Wickerhamomyces anomalus CCMA 0358 and its potential application in bioremediation. J. Hazard. Mater. 2018; 346:152–58.
  18. Banat I. M., Satpute S. K., Cameotra S. S. et al. Cost effective technologies and renewable substrates for biosurfactants’ production. Front. Microbiol. 2014; 5:1–18.
  19. Felipe L. D. O., Dias S. D. C. Surfactantes sintéticos e biossurfactantes : vantagens e desvantagens. Química Nov. na Esc. 2017; 39:228–36.
  20. Araújo C. K. C., Campos A. O., Padilha C. E. A. et al. Enhancing enzymatic hydrolysis of coconut husk through Pseudomonas aeruginosa AP 029/GLVIIA rhamnolipid preparation. Bioresour. Technol. 2017; 237:20–26.
  21. Peng X., Yuan X. Z., Zeng G. M. et al. Extraction and purification of laccase by employing a novel rhamnolipid reversed micellar system. Process Biochem. 2012; 47:742–48.
  22. Bezerra M. S., Holanda V. C. D., Amorim J. A. et at. Produção de biotensoativo utilizando Pseudomonas aeruginosa (P.A.) e resíduo agroindustrial (manipueira) como substrato. Holos 2012; 1:14–27.
  23. Miller G. L. Use of Dinitrosalicylic Acid Reagent for Determination of Reducing Sugar. Anal. Chem. 1959; 31:426–28.
  24. Bradford M. M. A. Rapid and sensitive method for the quantitation of microgram quantities of protein utilizing the principle of protein-dye binding. Anal. Biochem. 1976; 72:248–54.
  25. Oliveira A. C. S. M., Bezerra M. S., Padilha C. E. A. et al. Recovery of Rhamnolipids Produced by Pseudomonas aeruginosa Using Acidic Precipitation, Extraction, and Adsorption on Activated Carbon. Sep. Sci. Technol. 2013; 48:2852–59.
  26. Cooper D. G., Goldenberg B. G. Surface-active agents from two Bacillus species. Appl. Environ. Microbiol. 1987; 53:224–29.
  27. Wei Y. H., Chou C. L., Chang J. S. Rhamnolipid production by indigenous Pseudomonas aeruginosa J4 originating from petrochemical wastewater. Biochem. Eng. J. 2005; 27:146–54.
  28. Pereira J. F. B., Gudiña E. J., Costa R. et al. Optimization and characterization of biosurfactant production by Bacillus subtilis isolates towards microbial enhanced oil recovery applications. Fuel 2013; 111:259–68.
  29. Cockerill F. R., Wikler M. A., Alder J. et al. (Clinical and Laboratory Standards Institute): Methods for Dilution Antimicrobial Susceptibility Tests for Bacteria That Grow Aerobically. Methods for Dilution Antimicrobial Susceptibility Tests for Bacteria That Grow Aerobically, 9th Wayne, Pennsylvania. 2012; pp 1–32.
  30. Ehinmitola E. O., Aransiola E. F., Adeagbo O.P. Comparative study of various carbon sources on rhamnolipid production. South African Journal of Chemical Engineering. 2018; 26: 42-48.
  31. Santos A. S., Sampaio A. P. W., Vasquez G. S. et al. Evaluation of different carbon and nitrogen sources in production of rhamnolipids by a strain of Pseudomonas aeruginosa. Appl. Biochem. Biotechnol. 2002; 98:1025–35.
  32. Sousa J. R., Correia J. A. C., Melo V. M. M. et al. Cinética e caracterização de ramnolipídeos produzidos por Pseudomonas aeruginosa MSIC02 utilizando glicerol como fonte de carbono. Quim. Nova 2014; 37:431–41.
  33. Kariminik A., Baseri-Salehi M., Kheirkhah B. Pseudomonas aeruginosa quorum sensing modulates immune responses: An updated review article. Immunol. Lett. 2017; 190:1–6.
  34. Ramírez I. M., Tsaousi K., Rudden M. et al. Rhamnolipid and surfactin production from olive oil mill waste as sole carbon source. Bioresour. Technol. 2015; 198:231–36.
  35. Varjani S. J., Upasani V. N. Carbon spectrum utilization by an indigenous strain of Pseudomonas aeruginosa NCIM 5514: Production, characterization and surface active properties of biosurfactant. Bioresour. Technol. 2016; 221:510–16.
  36. Mondal M. H., Sarkar A., Maiti T. K. et al. Microbial assisted (Pseudomonas sp.) production of novel bio-surfactant rhamnolipids and its characterisation by different spectral studies. J. Mol. Liq. 2017; 242:873–78.
  37. Shao B., Liu Z., Zhong H. et al. Effects of rhamnolipids on microorganism characteristics and applications in composting: A review. Microbiol. Res. 2017; 200:33–44.
  38. Bouyahya A., Dakka N., Et-Touys A. et al. Medicinal plant products targeting quorum sensing for combating bacterial infections. Asian Pac. J. Trop. Med. 2017; 10:729–43.
  39. Kłosowska-Chomiczewska I. E., Mędrzycka K., Hallmann E. et al. Rhamnolipid CMC prediction. Journal of Colloid and Interface Science. 2017; 488:10–19.
  40. Samadi N., Abadian N., Ahmadkhaniha R. et al. Structural characterization and surface activities of biogenic rhamnolipid surfactants from Pseudomonas aeruginosa isolate MN1 and synergistic effects against methicillin-resistant Staphylococcus aureus. Folia Microbiol. (Praha). 2012; 57:501–08.
  41. Gogoi D., Bhagowati P., Gogoi P. et al. Structural and physico-chemical characterization of a dirhamnolipid biosurfactant purified from Pseudomonas aeruginosa: application of crude biosurfactant in enhanced oil recovery. RSC Adv. 2016; 6:70669–81.
  42. Bognolo G. Biosurfactants as emulsifying agents for hydrocarbons. Colloids Surfaces A Physicochem. Eng. Asp. 1999; 152:41–52.
  43. Desai J. D., Banat I. M. Microbial production of surfactants and their commercial potential. Microbiol Mol Biol Rev. 1997; 38:47-64.
  44. Nguyen T. T., Sabatini D. A. Characterization and emulsification properties of rhamnolipid and sophorolipid biosurfactants and their applications. Int. J. Mol. Sci. 2011; 12:1232–44.
  45. Costa S. G. V. A. O., Nitschke M., Haddad R. et al. Production of Pseudomonas aeruginosa LBI rhamnolipids following growth on Brazilian native oils. Process Biochem. 2006; 41:483–88.
  46. Rufino R. D., Neves G., Luna J. M. et al. Conservation of the Biosurfactant Produced by Pseudomonas aeruginosa for Environmental Applications. Chem. Eng. Trans. 2016; 49:535–40.
  47. Gudiña E. J., Fernandes E. C., Rodrigues A. I. et al. Biosurfactant production by Bacillus subtilis using corn steep liquor as culture medium. Front. Microbiol. 2015b; 6:1–7.
  48. Das A. J., Kumar R. Production of biosurfactant from agro-industrial waste by Bacillus safensis J2 and exploring its oil recovery efficiency and role in restoration of diesel contaminated soil. Environ. Technol. Innov. 2019; 16:1–10.
  49. Abalos A., Pinazo A., Infante M.R. et al. Physicochemical and antimicrobial properties of new rhamnolipids produced by Pseudomonas aeruginosa AT10 from soybean oil refinery wastes. Langmuir. 2001; 17:1367–71.
  50. Tedesco P., Maida I., Esposito F. P. et al. Antimicrobial activity of monoramnholipids produced by bacterial strains isolated from the Ross Sea (Antarctica). Mar. Drugs. 2016; 14:1–14.
  51. Ndlovu T., Rautenbach M., Vosloo J. A. et al. Characterisation and antimicrobial activity of biosurfactant extracts produced by Bacillus amyloliquefaciens and Pseudomonas aeruginosa isolated from a wastewater treatment plant. AMB Express. 2017; 7:1–19.
  52. Ferreira J. F., Vieira E.A., Nitschke M. The antibacterial activity of rhamnolipid biosurfactant is pH dependent. Food Research International. 2019; 116: 737-744.
  53. Mondal M. H., Malik S., Roy A. et al. Modernization of surfactant chemistry in the age of gemini and nio-surfactants – a review. RSC Advances. 2015; 5(112): 92707-92718.
  54. Mondal M. H., Roy A., Malik S., et al. Review on chemical bonded geminis with cationic heads: second generation interfactants. Res. Chem. Intermed. 2016; 42(3): 1913-1928.
  55. Mondal M. H., Sakar A., Maitini T. K. et al. Microbial assisted (pseudomonas sp.) production of novel bio-surfactant rhamnolipids and its characterisation by different spectral studies. J. Mol. Liq. 2017a; 242: 873-878.
  56. Mondal M. H., Malik S., Garain A., et al. Extraction of natural surfactant saponin from soapnut (Sapindus mukorossi) ans its utilization in the remediation of hexavalent chromium from contaminated water. Tenside Surfact. Det. 2017b; 54(6): 519-529.

Genotype-Dependent in Vitro Regeneration Assessment from Decapitated Embryonal Axis and Stem-Node Explants among Selected Pigeonpea Varieties

$
0
0

Introduction

Pigeonpea (Cajanu scajan L) is economically and nutritionally important legume of tropical and subtropical regions serving as a major source of proteins1,2 (Saxena et al., 2010; Sekhon et al., 2017). Sequencing of pigeonpea genome3,4 (Singh et al., 2012; Varshney et al., 2012) has provided an opportunity for developing appropriate strategies for overcoming the limitations of enhancing crop productivity owing to its narrow genetic base and adverse effect of biotic and abiotic stresses. Conventional plant breeding, molecular breeding, genomics assisted breeding and tissue culture based technologies together could be used to enhance the productivity of pigeonpea5-8 (Pazhamala et al., 2015; ChandaVenkata et al., 2018; Pratap et al., 2018;  Bohra et al., 2020).

Transgenic technologies have immense potential for legume improvement but limited successes have been reported owing to the fact that highly efficient regeneration protocols are lacking 9,7 (Chandra and Pental 2003; Pratap et al., 2018). Studies on developing regeneration methods and genetic transformation using different genotypes of pigeonpea are recently reviewed10 (Krishna et al., 2010).

In pigeonpea, direct organogenesis has been preferred over somatic embryogenesis as method of in-vitro regeneration and is often genotype-specific.  Efforts have been made to use diverse explants for direct organogenesis using different genotypes. Leaf explants have been reported for organogenesis11-18 (Eapen and George 1993; Kumar et al., 1983; George and Eapen 1994; Eapen et al., 1998; Tyagi et al., 2001; Yadav and Padmaja, 2003; Villiers et al., 2008; Kashyap et al., 2011). Cotyledonary nodes have been preferred as explants with several genotypes of pigeonpea for direct organogenesis19-23 (Franklin et al., 1998; Geetha et al., 1998; Singh et al., 2003; Shiva Prakash et al., 1994; Nalluri and Karri, 2019).

Direct organogenesis using different explants like cotyledons24-26,13,27,20,28 (Mehta and Mohan Ram, 1980; Kumar et al., 1984; Sarangi and Gleba, 1991; George and Eapen 1994; Naidu et al., 1995; Geetha et al., 1998; Chandra et al., 2003), hypocotyls29,30,20 (Shama Rao and Narayanaswamy, 1975;Cheema and Bawa, 1991; Geetha et al., 1998;), epicotyls25,13,27,20 (Kumar et al., 1984; George and Eapen 1994;  Naidu et al., 1995; Geetha et al., 1998), apical meristem30,19,31 (Cheema and Bawa, 1991; Franklin et al., 1998; Parekh et al., 2014), leaf petiole32,23 (Srinivasan et al., 2004; Nalluri and Karri, 2019), distal cotyledonary segments33 (Mohan and Krishnamurthy, 1998), root13,15 (George and Eapen 1994; Tyagi et al., 2001) and seed29,13,20 (Shama Rao and Narayanaswamy, 1975; George and Eapen 1994; Naidu et al., 1995) have also been reported.

Expanding the range of genotypes amenable to the requisite tissue culture processes for complete plant regeneration provides opportunity for developing efficient genetic transformation systems for transgenic production. In order to achieve this goal, in vitro process development, including refinement of the existing regeneration processes, is a task of primarily importance. The existing regeneration protocols are optimized for few selected varieties. Therefore, screening of different varieties could reveal the variability in the inherent regeneration ability, which could be further targeted for developing appropriate regeneration and transformation protocols.  Thus, the present study was an attempt to investigate the variability in regeneration ability of selected eleven varieties of pigeonpea exclusively for decapitated embryonal axis and stem node explants for direct organogenesis.

Materials and Methods

Seeds of Pigeonpea Varieties 

The pigeonpea varieties IPA-2013, IPA-3088, Pusa-9, IPA-34, IPA-204, IPA-242, T-7, IPA-61, IPA-337, IPA-341 and IPA-98-3  of  ICAR-Indian Institute of Pulses Research, Kanpur, India was used in the present study as reported earlier18,34 (Kashyap et al., 2011; Kashyap et al., 2014).

Preparation of Explants

Prior to culture, the pigeonpea seeds were sterilized using 1% cetrimide solution, 70% ethanol and 0.2% HgCl2 as reported earlier18,34 (Kashyap et al., 2011; Kashyap et al., 2014). Murashige and Skoog (MS) medium35 (Murashige and Skoog 1962) was used for culture and temperature of 25±20C with 16 hours light and 8 hour dark interval was maintained in tissue culture lab. For preparation of stem-node explants, 10 days germinated seedlings was used while for decapitated embryonal axis explants 2 days sprouted seed were used and after removing seed coat, epicotyl and hypocotyls regions were dissected carefully and about 2mm in length was taken as explants. The MS media with different concentration of three growth regulators i.e. BAP, kinetin and TDZ were used for multiple shoot bud induction while for rooting NAA, IAA and IBA were used. A total of 10 explants were used for each type of treatment for all the varieties. The statistical analyses was carried out by ANOVA test and treatment means were compared.

Results and Discussion

More than 50 genotypes of pigeonpea have been used for developing regeneration protocols, some of which were used for genetic transformation and production of transgenics10 (Krishna et al., 2010). Important factors which influence organogenesis includes selection of genotypes/cultivars, explants tissue, media composition and growth regulators. In an attempt to develop reliable in-vitro regeneration protocol by direct organogenesis amenable to genetic transformation, selected eleven Indian varieties of pigeonpea were studied using embryonal axis and stem node tissue explants under variable concentration of common growth regulators.

Regeneration using Decapitated Embryonal Axis Explants

The direct organogenesis using decapitated embryonal axis with different concentration of BAP ranging from  0.5-4.0 mgL-1 revealed variability resulting from 3 to 10 shoot buds among different varieties. The variety IPA-242 with 10 buds was found to be most amenable for in-vitro regeneration via direct organogenesis when cultured on MS media with BAP at 2.0 mgL-1. The variability in the formation of shoot buds among these varieties with growth regulator BAP is shown in Table-1 and Figure-1a.

Figure 1a: Multiple shoot bud induction from decapitated embryonal axis explants of eleven cultivars of pigeon pea (Cajanus cajan (L) Millsp.) Figure 1a: Multiple shoot bud induction from decapitated embryonal axis explants of  eleven cultivars of pigeon pea (Cajanus cajan (L) Millsp.)

Click here to View Figure

Table 1: Number of Shoots formed per explants among eleven cultivars of pigeonpea under the influence of different concentration of BAP (0.5-4.0 mgL-1) during in vitro multiple shoot bud induction and regeneration by decapitated embryonal axis explants. Data recorded after 4 weeks of culture with an average of 10 replicates. Means followed by the same letter are not significantly different by ANOVA test while different letters denoted as a,b,c differ significantly at p=0.05.

Conc. of BAP

(mgL-1)

0.5 1.0 1.5 2.0 2.5 3.0 3.5 4.0
Cultivars Number of shoots (Mean±S.D.)


IPA-2013 1.0±0.0a


3.1±0.3b 3.2±0.5b 3.2±0.4b 3.4±0.4b 3.4±0.4b 3.9±0.7ab 1.5±0.3a
IPA-3088 5.0±0.0 ab


3.9±0.5a 2.8±0.4a 2.0±0.0 1.0±0.0 1.0±0.0 4.2±0.7b 1.0±0.0
Pusa-9 2.7±0.4ab


1.0±0.0a 0.0±0.0a 0.0±0.0a 0.0±0.0a 2.1±0.3b 0.0±0.0a 0.0±0.0a
IPA-34 1.1±1.0b


0.0±0.0a 0.4±0.5b 1.2±1.1b 0.0±0.0a 1.8±0.9ab 0.9±1.1b 0.0±0.0a
IPA-204 3.3±0.7b


4.1±1.3b 2.7±1.1b 4.5±1.4b 1.0±0.8a 5.6±2.5ab 1.1±1.1a 3.1±1.7b
IPA-242 3.7±1.2b


4.1±1.3b 5.6±3.9b 6.3±3.1b 1.9±0.7b 3.9±1.4b 1.8±0.6b 3.8±2.3b
T-7 3.0±0.0a


2.8±1.0b 4.7±1.0ab 2.0±0.6b 0.8±0.0a 1.0±0.5a 1.3±0.9a 1.5±1.3a
IPA-61 1.6±0.4b


2.6±1.2ab 1.9±0.7b 1.4±0.4b 1.0±0.0b 0.5±0.3a 0.5±0.3a 1.0±0.0b
IPA-337 1.3±0.4a


1.3±0.4a 1.9±0.8a 1.8±0.7a 2.0±0.0a 2.3±0.6a 2.5±0.5c 4.3±1.1ac
IPA-341 2.7±0.6b


2.7±1.0b 4.1±0.9b 4.3±2.1b 2.8±1.0b 2.5±1.0b 2.4±1.1b 1.6±0.6b
IPA-98-3 1.0±0.0


2.1±0.7b 2.1±0.7b 2.6±0.4b 3.0±0.0ab 2.1±1.5b 2.1±1.8b 1.4±0.4a

Direct organogenesis using mature and immature embryo axes using BAP growth regulator either individually or in combination with NAA and kinetin has been reported earlier for different genotypes like BDN-2, CO5, ICPL 161, ICPL 87N-290-21, PT 22, SA1, T-21,T-Visakha-1, VBN1 and VBN226,14,27,19 (Sarangi and Gleba, 1991; George and Eapen, 1994; Naidu et al., 1995; Franklin et al., 2000).

The response of kinetin was comparatively poor than BAP for inducing multiple shoot bud formation with a maximum of only 3 shoot buds. The varieties IPA-337, IPA-2013 and IPA-204 showed better regeneration ability with 0.5, 1.5 and 3.5 mgL-1 kinetin. The best response of variable concentration of kinetin among these varieties for multiple shoot bud formation is shown in Figure-1b. Shoot buds ranging from 2 to 10 were observed with TDZ at concentration from 0.05 to 0.40 mgL-1. Pusa-9 and IPA-61 varieties revealed 10 and 7 shoot buds respectively at 0.15 mgL-1 of TDZ.  In case of other varieties namely IPA-204, IPA-242 and T-7 4-6 shoot buds were observed at 0.1 mgL-1 of TDZ growth regulator. The most suitable concentration of TDZ for direct organogenesis among these varieties is shown in Figure-1c. Comparative assessment of these varieties for multiple shoot buds formation at variable concentration of BAP, kinetin and TDZ is depicted in Figure-2.

Figure 1b: Multiple shoot bud induction from decapitated embryonal axis explants of eleven cultivars of pigeon pea (Cajanus cajan (L) Millsp.) Figure 1b: Multiple shoot bud induction from decapitated embryonal axis explants of eleven cultivars of pigeon pea (Cajanus cajan (L) Millsp.) 

Click here to View Figure

Figure 1c: Multiple shoot bud induction from decapitated embryonal axis explants of eleven cultivars of pigeon pea (Cajanus cajan (L) Millsp.) Figure 1c: Multiple shoot bud induction from decapitated embryonal axis explants of eleven cultivars of pigeon pea (Cajanus cajan (L) Millsp.)

Click here to View Figure

Figure 2: Pictorial representation for the response of different growth regulators (a) BAP (b) kinetin (c) TDZ individually and (d) comparative effect of growth regulators on multiple shoot induction from decapitated embryonal axis explants. Figure 2: Pictorial representation for the response of different growth regulators (a) BAP (b) kinetin (c) TDZ individually and (d) comparative effect of growth

Click here to View Figure

Overall, BAP seems to be promising as compared to kinetin and TDZ for direct organogenesis. Plantlet regenerated from decapitated embryonal axes under BAP and IAA has been reported36 (Rathore and Chand, 1999). Similarly genotype response of two cultivars namely UPAS-120 and Bahar under the influence of different growth regulators has also been reported37 (Yadav and Chand, 2001). A reliable regeneration protocol from decapitated mature embryo axes using genotype T-15-15 has been reported using combination of BAP and IAA growth regulators38 (Mohan and Krishnamurthy, 2003).  Similar study of organogenesis with pigeopea variety JKR105 revealed greater regeneration of shoot buds in the presence of BAP39 (Krishna et al., 2011). Recently, efficient shoot regeneration of pigeonpea genotype Durga NTL-30 has been reported using embryonic axis using combination of zeatin and kinetin growth regulators along with silver nitrate40 (Raut et al., 2015).

Rooting Response in Decapitated Embryonal Axis Derived Plantlets

The rooting of shoot buds from decapitated embryonal axis was attempted  with full strength MS basal medium along with NAA, IAA and IBA growth regulator at 0.1, 0.2 and 0.3 mgL-1 as reported earlier18,34 (Kashyap et al., 2011; Kashyap et al., 2014). In most of the cases 0.1 mgL-1 of NAA was found to be effective resulting in 80-100% rooting (Table-2).

Table 2: Rooting responses of in- vitro regenerated shoots from decapitated embryonal axis explants under different concentrations of NAA. Data was recorded after 4 weeks of culture with 10 replicates for each treatment and experiment was repeated twice.

Cultivars NAA (0.1 mgL-1) NAA (0.2 mgL-1) NAA0.3 (mgL-1)
% of rooting Number of primary roots Mean±S.D. % of rooting Number of primary roots Mean±S.D % of rooting Number of primary roots Mean±S.D
IPA-2013 100 6.2±0.4 100 2.0±0.0 70 1.4±0.9
IPA-3088 80 6.4±3.2 50 1.4±0.4 50 1.6±1.9
Pusa-9 80 7.2±2.2 50 4.0±1.8 70 3.6±3.2
IPA-34 100 2.8±1.2 40 1.4±0.4 80 1.4±0.48
IPA-204 100 3.0±0.8 60 2.0±0.8 40 NR
IPA-242 100 11.4±1.7 80 11.8±1.5 80 2.4±0.4
T-7 80 3.2±0.97 40 2.8±1.6 40 4.4±1.9
IPA-61 80 3.2±1.6 40 5.2±1.6 100 4.4±1.0
IPA-337 80 6.2±1.4 60 2.0±0.8 40 1.2±0.4
IPA-341 80 5.4±0.6 50 2.6±1.8 40 2.0±0.9
IPA-98-3 90 6.0±1.1 60 1.8±0.7 50 1.0±0.0

The number of primary roots formed was highest in IPA-242 subjected to 0.2 mg/l of NAA, though the percentage of rooting was only 80%, while 0.1 mgL-1 of NAA resulted in 100% rooting with more or less similar number of primary roots formed. The root formation observed with shoot buds of IPA-2013, IPA- 3088, Pusa-9 and IPA-242 is shown in Figure-3.

 Figure 3: Rooting response of in-vitro regenerated shootlets derived from decapitated embryonal axis explants of selected cultivars of pigeon pea viz. IPA-2013, IPA-3088, Figure 3: Rooting response of in-vitro regenerated shootlets derived from decapitated embryonal axis explants of selected cultivars of pigeon pea viz.

Click here to View Figure

The rooting response in the presence of IAA was comparatively poor than NAA with overall 60-100% rooting in only few varieties. It was also observed that 0.3 mg L-1 of IAA was comparatively better for rooting. The percentage of root formation and number of primary roots was found to be best for IPA-34. Only few of the varieties responded to rooting in the presence of IBA, though overall 50-100% rooting frequency was attained. Pusa-9 with 100% rooting and with a maximum number of primary roots was achieved with 0.2 mgL-1 of IBA, while in case of other varieties IBA at 0.1 mgL-1 showed better response.

In-Vitro Regeneration using Stem-Node Explants

An in vitro grown plant of 10 day old was used for stem node explants preparation. For each treatment 10 explants were used with all varieties and explants were vertically inoculated in respective media for multiple shoot bud formation. Effect of BAP, kinetin and TDZ growth regulators at different concentration for direct organogenesis among these varieties were assessed. Variability in regeneration ability among different varieties was observed with BAP at variable concentration ranging from 0.5 to 4.0 mgL-1 and shoot buds formed were recorded as shown in Table-3. IPA-3088 revealed 17 shoot buds while in case of IPA-341 a minimum of 5 buds were observed. Further, it was also observed that BAP at 4 mgL-1 gave better regeneration ability for IPA-3088 revealing the fact that higher concentration of BAP is comparatively better for direct organogenesis as reported earlier10 (Krishna et al., 2010)  (Figure-4a).

Table 3: Number of Shoots formed per explants among eleven cultivars of pigeonpea under the influence of different concentration of BAP (0.5-4.0 mgL-1) during in vitro multiple shoot bud induction and regeneration by stem-node explants. Data recorded after 4 weeks of culture with an average of 10 replicates. Means followed by the same letter are not significantly different by ANOVA test while different letters denoted as a,b,c differ significantly at p=0.05.

Con. of BAP

(mgL-1)

0.5 1.0 1.5 2.0 2.5 3.0 3.5 4.0
Cultivars Number of Shoots (Mean±S.D.) 
IPA-2013 2.9±0.7a 6.0±1.1ab 5.5±1.1b 5.2±1.2b 5.0±0.8b 5.0±1.5b 5.7±0.7b 5.4±0.4b
IPA-3088 5.8±0.8a 5.0±2.1c 9.3±1.6b 9.7±2.7b 7.9±1.3b 8.6±2.3b 11.3±3.1b 11.4±3.1abc
Pusa-9 7.2±0.9ab 3.4±0.4b 5.4±0.6a 3.6±1.1a 4.8±0.4a 2.6±0.4a 4.4±0.4a 2.2±0.4a
IPA-34 4.0±0.6ab 2.5±0.5a 4.0±0.7a 2.4±0.4a 3.4±0.4b 3.4±0.9b 3.9±0.8b 3.0±0.0b
IPA-204 3.6±0.4a 3.6±0.8a 4.7±0.4a 5.2±0.6a 5.1±0.3a 5.2±0.4a 4.6±0.6a 6.6±0.4a
IPA-242 3.1±0.3b 2.2±0.4a 3.5±0.6b 2.3±0.4b 4.0±1.1ab 3.6±0.4b 3.1±0.53b 2.5±0.5b
T-7 2.0±0.0a 3.1±0.3c 4.2±0.8b 3.5±0.5a 4.5±0.6b 3.7±0.9b 5.1±0.3abc 4.0±0.6a
IPA-61 2.2±0.4a 3.0±0.6a 3.9±0.7a 4.4±0.4b 3.7±0.4a 3.4±0.4a 3.3±0.4a 5.4±0.6ab
IPA-337 2.0±0.0a 2.0±0.0a 2.0±0.0a 2.0±0.0a 2.9±0.3a 2.4±0.0b 3.6±0.4b 4.4±1.6ab
IPA-341 1.9±0.4a 2.0±0.0a 2.0±0.0a 3.6±0.9ab 3.5±0.8b 3.3±0.4b 3.2±0.4b 3.0±0.0b
IPA-98-3 2.0±0.0a 4.1±1.0ab 3.8±0.6b 2.9±0.5b 3.3±0.7b 3.4±0.6b 3.4±0.8b 3.0±0.0b
Figure 4a: Multiple shoot bud induction from stem-node explants of eleven cultivars of pigeon pea (Cajanus cajan (L) Millsp.) Figure 4a: Multiple shoot bud induction from stem-node explants of eleven cultivars of pigeon pea (Cajanus cajan (L) Millsp.)

Click here to View Figure

With variable concentration of kinetin, IPA 3088 formed 8 shoot buds and was found to be best among these varieties. In general, lower concentration of kinetin showed better resposnse for direct organogenesis, though IPA-2013 and IPA-34 were exceptions revealing better response at higher concentration of kinetin.  As compared to BAP, lower percentage of multiple shooting was observed with kinetin. Mulitple shoot bud formation among these varieties under the best responsive concentration of kinetin is shown in Figure-4b. Similary genotype based variability among these varieties for in vitro regneration was also observed under the influence of different concentration of TDZ growth regulator. Pusa-9 was found to be most suitable for direct organogenesis among these varieties with 10 shoot buds when treated with TDZ (0.25 mgL-1).  It was also observed that TDZ in the range of 0.25 to 0.30 mgL-1 revealed better response for direct organogenesis from stem-node explants in most of the varieties.  The lower concentration of TDZ was exceptionally better for IPA-3088 and IPA-61 while TDZ at 0.40 mgL-1 was found to be most effective for shoot bud induction in IPA-242 and IPA-337 (Figure-4c).

Figure 4b: Multiple shoot bud induction from stem-node explants of eleven cultivars of pigeon pea (Cajanus cajan (L) Millsp.) Figure 4b: Multiple shoot bud induction from stem-node explants of eleven cultivars of pigeon pea (Cajanus cajan (L) Millsp.)

Click here to View Figure

Figure 4c: Multiple shoot bud induction from stem-node explants of eleven cultivars of pigeon pea (Cajanus cajan (L) Millsp.) Figure 4c: Multiple shoot bud induction from stem-node explants of eleven cultivars of pigeon pea (Cajanus cajan (L) Millsp.)

Click here to View Figure

Comparative assessment of growth regulators revealed BAP to be most promising compared to TDZ and kinetin. Substantial variability in regeneration potential for direct organogenesis with different concentration of these growth regulators was observed with pigeopea varieties as shown in Figure 5.

Figure 5: Pictorial representation for the response of different growth regulators (a) BAP (b) kinetin (c) TDZ individually and (d) Figure 5: Pictorial representation for the response of different growth regulators (a) BAP (b) kinetin (c) TDZ individually and (d)

Click here to View Figure

Rooting Response in Stem-Node Derived Plantlets

As attempted for root formation from shoot buds derived with leaf and plumule junction explants18, 34 (Kashyap et al., 2011; Kashyap et al., 2014) of these varieties, growth regulators namely  NAA, IAA and IBA at 0.1, 0.2 and 0.3 mg/l was also used with stem-node explants.  The root formation was found to be better with 0.1 mgL-1 NAA resulting with a maximum number of primary roots as shown in Figure-6. The root formation in terms of percentage ranged from 50 to 80% and comparative response of these varieties for root formation from shoots derived from stem-node explants is shown in Table-4. IPA-2013 was found to be the best variety for root formation though the best variety showing direct organogenesis with stem-node explants IPA-3088 also revealed good root formation when treated with 0.1 mgL-1 of NAA.

Table 4: Rooting responses of in- vitro regenerated shoots; stem-node explants under different concentrations of NAA. Data was recorded after 4 weeks of culture with 10 replicates for each treatment and experiment was repeated twice.

Cultivars NAA 0.1 mgL-1 NAA 0.2 mgL-1 NAA0.3 mgL-1
% of rooting Number of primary roots Mean±S.D. % of rooting Number of primary roots Mean±S.D % of rooting Number of primary roots Mean±S.D
IPA-2013 80 9.5±4.8 80 8.1±4.0 70 3.4±2.2
IPA-3088 80 8.2±4.1 50 1.0±1.0 50 1.0±1.0
Pusa-9 80 5.4±0.9 50 2.8±2.5 NR NR
IPA-34 50 6.6±6.6 50 0.8±0.9 NR NR
IPA-204 NR NR NR NR NR NR
IPA-242 50 0.5±0.5 80 3.2±1.6 50 1.5±1.5
T-7 NR NR 80 1.6±0.8 NR NR
IPA-61 50 2.1±2.1 80 3.3±1.7 60 1.8±1.5
IPA-337 NR NR 80 4.1±2.1 NR NR
IPA-341 50 1.0±1.0 80 3.2±1.6 NR NR
IPA-98-3 NR NR 80 2.8±1.6 NR NR
Figure 6: Rooting response of in-vitro regenerated shootlets derived from stem-node explants of selected cultivars of pigeon pea in MS media supplemented with 0.1 mgL-1 NAA. Figure 6: Rooting response of in-vitro regenerated shootlets derived from stem-node explants of selected cultivars of pigeon pea in MS media supplemented with 0.1 mgL-1 NAA.

Click here to View Figure

Similarly variable response was observed for the plantlets derived from stem-node explants of these varieties for rooting under the influence of different concentration of IAA namely 0.1, 0.2 and 0.3 mgL-1. The concentration of IAA at 0.1 mgL-1 revealed 50-70% rooting with IPA-2013 being most responsive for root formation. As compared to NAA and IAA, the response of rooting was poor with IBA. In most of the cultivars there were no response to variable concentration of IBA for rooting.

There are only few reports of multiple shoot bud induction using stem node explants.30 Cheema and Bawa, 1991 has reported multiple shoot bud induction using stem node along with the apical meristem in the MS media supplemented with kinetin ranging from 0.1 to 9.0 mgL-1. The lower concentration in the range of 0.5 to 3.0 mgL-1 revealed healthy shoots while higher concentration resulted in the formation of clusters.

Comprehensive analysis of more than 50 cultivars/genotypes of pigeonpea for in vitro regeneration with diverse explants revealed variability both for organogenesis and somatic embryogenesis10 (Krishna et al., 2010) and hence there is great potential for screening of genotypes to develop efficient regeneration protocols for transgenic development.

Hardening and Acclimatization of Plantlets Derived from Decapitated Embryonal Axis and Stem-Node Explants

Genotype dependent variability was also observed during acclimatization of plantlets derived from both decapitated embryonal axis and stem-node explant sources.  The percentage acclimatization of multiple shoot buds derived from decapitated embryonal axis explants with proper rooting in soil ranged from 55 to 80% with cultivar IPA-242 showing maximum percentage of acclimatization while cultivars IPA-3088, IPA-204 and IPA-61 showed 75% acclimatization. In case of stem-node explants derived plantlets, the percentage acclimatization of multiple shoot buds with proper rooting in soil ranged from 25 to 70% with cultivar IPA-2013, IPA-3088 and IPA-61 showing 70 and 65% acclimatization. The overall percentage of acclimatization during hardening observed among these varieties derived from different explants is shown in Table-5.

Table 5: Percentage acclimatization of well rooted plantlets derived from embryonal axis and stem-node explants of different pigeonpea varieties.

Pigeonpea varieties Decapitated embryonal axis explants (%) Stem-node explants (%)
IPA-2013 60 70
IPA-3088 75 65
Pusa-9 65 25
IPA-34 60 25
IPA-204 75 20
IPA-242 80 20
T-7 60 25
IPA-61 75 65
IPA-337 60 50
IPA-341 55 55
IPA-98-3 60 25

Conclusion

Plantlet regeneration via organogenesis has been preferred over somatic embryogenesis for developing appropriate regeneration protocols amenable for genetic transformation in pigeonpea. Among several factors considered for developing suitable regeneration protocol by direct organogenesis, selection of genotypes/cultivars has been considered as the major factor and hence genotype-dependent response needs to be investigated. Other factors influencing regeneration are explants tissue, media composition and growth regulators. Varied concentration of growth regulators namely cytokinins, auxins, gibberellins and abscisic acid either individually or in combination has been studied for organogenesis-mediated regeneration in different pigeonpea genotypes. The selected Indian pigeonpea varieties in the present study revealed genotype dependent response for direct in vitro organogenesis in the presence of varied concentration of growth regulators exclusively for decapitated embryonal axes and stem-node explants. The varieties IPA-242 and IPA-3088 showed best response for in vitro regeneration using decapitated embryonal axes and stem-node explants respectively. The growth regulator BAP was found to be effective as compared to kinetin and TDZ for direct organogenesis irrespective of explant sources. Further, comparatively higher concentration of BAP (0.5-4.0 mgL-1), lower concentration of kinetin (0.5-4.0 mgL-1) and medium concentration of TDZ (0.05-0.40 mgL1) was found to be effective for multiple shoot bud induction. The rooting response of plantlets derived from these explants source among these varieties was found to be better with growth regulator NAA as compared to IAA and IBA and effective rooting was observed with 0.1 mgL-1 of NAA.

Acknowledgements

Authors highly acknowledge Director, ICAR-IIPR Kanpur for providing seeds of pigeonpea. The authors sincerely acknowledge the support of Director, CSIR-NEERI, Nagpur for providing Plant Tissue Culture Lab facility to carry out some part of the work in NEERI, Nagpur. Authors are also grateful to Department of Biotechnology, DDU Gorakhpur University for their support to carry out this research work.

Conflict of Interest

There is no conflict of interest.

References

  1. Saxena KB, Kumar RV and Gowda CLL. Vegetable pigeonpea-a review. J Food Legumes. 2010; 23:91-98.
  2. Sekhon J, Grewal SK, Singh I and Kaur J. Evaluation of nutritional quality and antioxidant potential of pigeonpea genotypes. J Food Sci Technol. 2017; 54(11):3598-3611.
  3. Singh NK, Gupta DK, Jayaswal PK, Mahato AK, Dutta S et al. The first draft of pigeonpea genome sequence. J Plant Biochem Biotechnol. 2012; 21(1): 98-112.
  4. Varshney et al. Draft genome sequence of pigeonpea (Cajanus cajan), an orphan legume crop of resource poor farmers. Nature Biotechnology. 2012; 30(1): 83-89.
  5. Pazhamala L, Saxena RK, Singh VK, Sameerkumar CV, Sinha P et al. Genomics-assisted breeding for boosting crop improvement in pigeonpea (Cajanus cajan). Front Plant Sci. 2015; 6:50.
  6. Chandra Venkata SK, Nadigatla Veera Prabha Ram GR, Saxena RK, Saxena K, Upadhyaya HD et al. Pigeonpea improvement: An amalgam of breeding and genomics research. Plant Breeding.2019; 138:445-454.
  7. Pratap A, Prajapati U, Singh CM, Gupta G, Rathore M et al. Potential, constraints and applications of in vitro methods in improving grain legumes. Plant Breeding. 2018; 137:235-249.
  8. Bohra A, Saxena KB, Varshney RK and Saxena RK. Genomics-assisted breeding for pigeonpea improvement. Theoretical and Applied Genetics.2020;133:1721-1737.
  9. Chandra A and Pental D. Regeneration and genetic transformation of grain legumes: An overview. Curr Sci.2003;84(3):381-387.
  10. Krishna G, Reddy PS, Ramteke PW and Bhattacharya PS. Progress in tissue culture and genetic transformation research in pigeonpea [Cajanus cajan(L.) Millsp.]. Plant Cell Rep. 2010; 29:1079-1095.
  11. Eapen S and George L. Plant regeneration from leaf disc of peanut and pigeonpea: Influence of benzyladenine, indole acetic acid and indoleacetic acid-amino-acid conjugates. Plant Cell Tiss Org Cult.1993; 5:223-227.
  12. Kumar AS, Reddy TP and Reddy GM. Plant regeneration from different callus cultures of pigeopea (Cajanus cajan ). Plant Sci Lett.1983; 32:271-278.
  13. George L and Eapen S. Organogenesis and embryogenesis from diverse explants in pigeonpea (Cajanus cajan). Plant Cell Rep.1994; 13:417-420.
  14. Eapen S, Tivarekar S and George L. Thidiazuron-induced shoot regeneration in pigeonpea (Cajanus cajan). Plant Cell Tiss Org Cult.1998; 53:217-220.
  15. Tyagi AP, Comai L and Byers B. Comparison of plant regeneration from root, shoot and leaf explants in pigeonpea (Cajanus cajan) cultivars. SABRAO J. 2001; 33:59-71.
  16. Yadav PBS and Padmaja V. Shoot organogenesis and plantlet regeneration from leaf segments of pigeonpea. Plant cell Tiss Org Cult.2003; 73:197-200.
  17. Villiers SD, Emongor Q, Njeri R, Gwata E, Hoisington D et al. Evaluation of the shoot regeneration response in tissue culture of pigeonpea (Cajanus cajan (L.) Millsp.) varieties adapted to eastern and southern Africa. Afr J Biotechnol. 2008; 7:587-590.
  18. Kashyap V, Sarangi BK, Yadav MK and Yadav D. Assessment of in vitro multiple shoot bud induction from leaf explants among eleven Indian cultivars of pigeonpea (Cajanus cajan (L) Millsp.). Biotechnology. 2011; 10(6):534-539.
  19. Franklin G, Jeyachandran R, Melchias G and Ignacimuthu S. Multiple shoot induction and regeneration of pigeonpea (Cajanus cajan(L.) Millsp.) cv. Vamban from apical and axillary meristem. Curr Sci. 1998; 74:936-937.
  20. Geetha N, Venkatachalam P, Prakash V and Lakshmi Sita G. High frequency induction of multiple shots and plant regeneration from seedling explants of pigeonpea (Cajanus cajan). Curr Sci.1998; 75:1036-1041.
  21. Singh ND, Sahoo L, Neera BS and Jaiwal PK. The effect of TDZ on organogenesis and somatic embryogenesis in pigeonpea (Cajanus cajan Millsp). Plant Sci.2003; 164:341-247.
  22. Shiva Prakash N, Pental D and Bhalla-Sarin N. Regeneration of pigeonpea (Cajanus cajan) from cotyledonary node via multiple shoot formation. Plant Cell Rep.1994; 13:623-627.
  23. Nalluri N and Karri VR. In vitro regeneration of ICP 8863 pigeonpea (Cajanus cajan (L) Millsp) variety using leaf petiole and cotyledonary node explants and assessment of their genetic stability by RAPD analysis. Indian Journal of Science and Technology.2019;12(9).
  24. Mehta U and Mohan Ram HY. Regeneration of plantlets from the cotyledons of Cajanus cajan Ind J Exp Biol.1980; 18:800-802.
  25. Kumar AS, Reddy TP and Reddy GM. Multiple shots from cultured explants of pigeonpea and Atylasia SABRAO J.1984; 16:101-105.
  26. Sarangi BK and Gleba YY. Direct multiple regeneration in Cajanus cajan (L.) Millsp. Acta Hortic. 289;149-150.
  27. Naidu RB, Kulkarni DD and Krishnamurthy KV. Genotype-dependent morphogenic potentiality of various explants of a food legume, the pigeonpea (Cajanus cajan). In Vitro Cell Dev Biol Plant. 1995; 31:26-30.
  28. Chandra A, Gupta V, Burma P and Pental D. Patterns of morphogenesis from cotyledon explants of pigeonpea. In Vitro Cell Dev Biol Plant.2003; 39:514-519.
  29. Shama Rao HK and Narayanaswamy S. Effect of gamma irradiation on cell proliferation and regeneration in explanted tissue of pigeonpea, Cajanus cajan (L.) Millsp. Radiat Bot.1975; 15:301-305.
  30. Cheema HK and Bawa J. Clonal multiplication via multiple shoots in some legumes (Vigna unguiculata and Cajanus cajan). Acta Hortic. 1991; 289:93-94.
  31. Parekh MJ, Mahatma MK and Kapadia CV. In vitro regeneration of pigeonpea (Cajaus cajan(L.) Millisp) genotype GT-102 using apical meristem. Journal of Cell & Tissue Research. 2014; 14(1): 4099-4103.
  32. Srinivasan T, Verma VK and Kirti PB. Efficient shoot regeneration in pigeonpea, Cajanus cajan (L) Millsp. Using seedling petioles. Curr Sci. 2004; 86:30-32.
  33. Mohan ML and Krishnamurthy KV. Plant regeneration in pigeonpea (Cajanus cajan (L.) Millsp.) by organogenesis. Plant Cell Rep. 1998; 17:705-710.
  34. Kashyap V, Sarangi BK, Yadav MK and Yadav D. In vitro multiple shoot bud induction and regeneration from plumule junction explants of pigeonpea (Cajanus cajan (L) Millsp.) cultivars. African Journal of Biotechnology. 2014; 13(41): 4061-4069.
  35. Murashige T and Skoog F. A revised medium for rapid growth and bioassay with tobacco tissue cultures. Physiol Plant. 1962; 15: 473–497.
  36. Rathore RS and Chand L. Plantlet regeneration from decapitated embryonic axes of pigeonpea Cajanus cajan (L.) Millsp.). Indian J Exp Biol.1999; 37(5):496-498.
  37. Yadav V and Chand L. Plantlet regeneration from decapitated embryonic axes of pigeonpea varieties. Indian Journal of Plant Physiology.2001; 6(2):208-211.
  38. Mohan ML and Krishnamurthy KV. Plant regeneration from decapitated mature embryo axis and Agrobacterium mediated genetic transformation of pigeonpea. Biologia Plantarum.2003; 46(4): 519-527.
  39. Krishna G, Reddy PS, Ramteke PW, Rambabu P, Sohrab SS, Rana D and Bhattacharya P. In vitro regeneration through organogenesis and somatic embryogenesis in pigeonpea[Cajanus cajan (L.) Millsp.] cv. JKR105. Physiol Mol Biol Plant2011; 17(4):375-385.
  40. Raut RV, Dhande GA, Rajput JC and Ingale AG. Rapid and highly competent shot regeneration of pigeonpea (Cajanus cajan) using variable explants by in vitro culture system. Journal of Pharmacognosy and Phytochemistry. 2015; 4(4):01-05.

Development of Interspecific Hybrids (Abelmoschus Esculentus × A. Tetraphyllus) in Okra Using Embryo Rescue Approach

$
0
0

Introduction

Okra [Abelmoschus esculentus (L.) Moench] also called lady’s finger or bindi is a polyploid vegetable with chromosome number 2n=130 belonging to family Malvaceae. A number of insect pests and viruses affect the production of this crop. Whitefly (Bemisia tabaci) transmitted virus complex consisting of a monopartite begomovirus, bhendi yellow vein mosaic virus (BYVMV) causing Yellow Vein Mosaic Virus (YVMV) is the most important and destructive viral disease in okra (Rana et al., 2006). The total loss due to YVMV has been reported to be 20-30%, which could rise to 80-90% if the carrier of the virus is not controlled (Richardson, 1997). The use of chemicals and culling off the infected plants is not practical and economical solution to control the virus, and therefore, development of resistant/tolerant varieties seems to be the best option to curtail the loss. Undomesticated related species are the genetic stocks of resistant genes for different pest, diseases and abiotic stresses (Rattan et. al., 2015). Lack of stable source of resistance to YVMV in cultivated species is the major constrain in developing stable resistant variety in okra.  However, some of the wild species of okra have been reported to be stable and reliable sources of resistance to YVMV. One such wild species of okra, A. tetraphyllus is an important resistance sources to YVMV (Prabu, 2005), but the sterility problems and trouble in producing subsequent generations or even to carry out back crosses hampers the transfer of resistance from wild species. Hence  for the development of YVMV resistant lines adoption of non-conventional methods of breeding like plant tissue culture mediated introgression is an urgent need. Embryo rescue technique can be efficiently used to overcome post-zygotic incompatibility which is found to operate between these species. In view of this, the investigation was undertaken with the objective to transfer resistance genes from wild species (A. tetraphyllus IC 141017) to popular okra varieties mediated through embryo rescue.

Materials and Methods

Planting Material and Interspecific Hybridization

The planting materials used in the investigation comprised of four cultivated genotypes of okra [A. esculentus L. (Moench)], viz., Arka Anamika, Parbhani Kranti, Pusa Makhmali (procured from ICAR-NBPGR, New Delhi), Jammu okra-05 (procured from SKUAST, Jammu), and a wild species, A. tetraphyllus (IC 141017) procured from ICAR-Indian Institute of Vegetable Research, Varanasi. All these genotypes were sown in the Agriculture Farm of DAV University, Jalandhar in April, 2017. Reciprocal crosses were made between the cultivated and wild genotypes.  Female flowers were selected at the balloon stage a day prior to pollination and their bagging was done to avoid undesirable crossing. Next day they were pollinated with the desirable pollen.

figure 1 Figure 1

Click here to View figure

Embryo rescue and shoot and root regeneration

Fruits of okra at immature stage were harvested at 5, 10, 15 and 20 days after pollination (DAP). The immature seeds were extracted from these fruits and they were inoculated on media composed of Murashige and Skoog (MS) medium containing different concentrations of 6-Benzyl amino purine (BAP) for embryo emergence or callogenesis. The emerged embryos (4-5 cm) were further cultured on different treatment combinations so as to study their effect on shoot emergence. These treatment combinations were MS + 0.25 mg l-1 NAA + 0.5 mg l-1 IBA; MS + 0.5 mg l-1 NAA + 0.5 mg l-1 IBA; MS + 1.0 mg l-1 NAA + 0.5 mg l-1 IBA; MS + 0.25 mg l-1  NAA + 1.0 mg l-1 IBA; MS + 0.5 mg l-1 NAA + 1.0 mg l-1 IBA; MS + 1.0 mg l-1 NAA + 1.0 mg l-1 IBA. Incubation of these cultures was done at 26±20C for 30 d after which they were sub-cultured on to freshly prepared medium for shoot multiplication. These shoots were transferred then transferred to root regeneration medium having composition of half-strength MS medium +0.25 mg l-1 IBA + 200 mg l-1 and activated charcoal, for root initiation.

Hardening of the Plantlets

Well rooted plantlets were isolated from the test tube with utmost care so that the shoots do not get damaged. After washing them with distilled water to remove the adhering agar, the plantlets were transplanted in sterilized soil less media (cocopeat: vermiculite: perlite in ratio of 1:1:1) in the small pots. Watering of these plantlets was done at every 15 days with half-strength MS medium.

Results and Discussion

Interspecific Hybridization

The four cultivated varieties started flowering in the month of May 2017, whereas, the wild species (IC 141017) started flowering in the month of Sept. 2017. The main problem in the hybridization programme of the present study was non-synchronised flowering among cultivated and wild genotypes. The wild genotype started flowering by the Sept. 2017, however the cultivated genotypes which were sown in the April, 2017 stopped flowering by August, 2017.  So, when the cultivated genotypes were in their peak period of flowering there was no flowering in the wild genotype. To overcome this problem, repeated sowings of cultivated varieties of okra was done under controlled conditions so as to get a synchronous flowering.

A total of 50 crosses were made in each cross combination, of the four cultivated genotypes, fruit setting was observed only in Arka Anamika, Parbhani Kranti and Pusa Makhmali when cultivated genotypes were used as female parents. Fruit setting failed when A. tetraphyllus (IC 14101) was used as female parent (Table 1). Similar results were observed by Mamidwar et al. (1979), Meshram and Dhapake (1981), Sheela (1986). They observed that fruit set was maximum when A. esculantus was used as female parent in an interspecific cross between A. esculentus × A. tetraphyllus. Small fruits were obtained in the all the cross combinations. The fruits appeared normal till 25 d after pollination, but after that the fruits showed splitting/cracking from the distal end. The seeds looked healthy for up to 10-15 d after pollination, after that it shrivelled and became pale yellow (Fig. 2). The findings are in time with Mamidwar et al. (1979) who also obtained seed less fruits and shrivelled seeds when crossed Abelmoschus esculentus × Abelmoschus tetraphyllus.

figure 2 Figure 2

Click here to View figure

Table 1: Cross compatibility between Abelmoschus esculentus L. (Moench) and A. tetraphyllus IC 141017   

Cross combination No. of cross attempted Fruit setting No. of fruits obtained after 25 DAP
Arka Anamika × A. tetraphyllus IC 141017 50 28 22
Parbhani Kranti × A. tetraphyllus IC 141017 50 32 26
Pusa Makhmali × A. tetraphyllus IC 141017 50 20 18
A. tetraphyllus IC 141017   × Arka Anamika 50
A. tetraphyllus IC 141017    × Parbhani Kranti 50
A. tetraphyllus IC 141017    × Pusa Makhmali 50

Sureshbabu and Datta (1990) also observed the similar results and inferred that slow pollen tube growth, abnormal pollen tube, and abortion of fertilized ovules or scarcity of pollen grains could be the reason for no seed formation in interspecific hybrids. The findings are also in time with Sindhu (1993) who obtained shrivelled seeds in interspecific hybridization which may be attributed to the poor development of endosperm. Age at which embryo is extracted for inoculation affects a lot in regeneration of plant from embryo. The excision stage of embryo varies with crop. After 5, 10, 15 and 20 d of pollination, the fruits were harvested in the present study. This could be due to the fact that the embryo of the seeds which were harvested before 15 d of pollination were quite immature for pollination however, the embryo of the seeds which were harvested after 15 d of pollination were degenerated. Similar findings were reported by Rajamany et al. (2006), who obtained interspecific hybrids o A. esculentus × A. moschatus when excised embryos at 12 and 15 d after pollination through embryo rescue technique.

Effect of Media of Embryo Emergence

The fruits of the all the cross combinations which were harvested at 5, 10 and 15 d, had seeds which were shiny and succulent yet small and white. As the number of days after pollination increased the seeds started appearing shrivelled and dull white (Fig. 2). However, the seeds remained succulent at 15 d after pollination. Inoculations of these harvested seeds were done on different treatment combinations viz., MS + 0.25 mg l-1  BAP; MS + 0.5 mg l-1  BAP; MS + 1.0 mg l-1  BAP; MS + 1.5 mg l-1  BAP. The results pertaining to this component is presented in Table 2. Cross combinations, Arka Anamika × A. tetraphyllus IC 141017 showed emergence of embryo 25 d after inoculation when inoculated media containing MS + 0.25 mg l-1  BAP. Cross combination, viz., Pusa Makhmali × A. tetraphyllus IC 141017 and Parbhani Kranti × A. tetraphyllus IC 141017 showed direct emergence of embryo 30-35 d after inoculation in the same media. Emergence of embryo was observed in all the cross combinations after 45-50 d of inoculation in the MS media containing BAP @0.5 mg l-1. No cross combinations showed embryo emergence in media comprising of MS + 1.0 mg l-1  BAP; MS + 1.5 mg l-1  BAP.

Table 2: Response of different interspecific hybrids on growth media

Cross combination Different levels of BAP (mg l-1 ) in MS Medium
0.25 0.5 1.0 1.5
Arka Anamika × A. tetraphyllus (IC 141017) embryo emergence after 25 d of inoculation embryo emergence after 45-50 d of inoculation -*
Pusa Makhmali × A. tetraphyllus (IC 141017) embryo emergence after 30-35 d of inoculation embryo emergence after 45-50 d of inoculation
Parbhani Kranti × A. tetraphyllus (IC 141017) embryo emergence after after 30-35 d of inoculation embryo emergence after 45-50 d of inoculation

Role of media is major in embryo rescue, as it acts as endosperm by providing nutrient to the excised embryo. The seeds of fruits harvested after 15 d of pollination were inoculated in MS media containing various concentrations of BAP. MS media containing 0.25 mg of BAP gave the best results in all cross combinations. These findings corroborates with the results of Kabir et al. (2008), who observed good regeneration with BAP. It was observed that lower the concentration of BAP greater were the results with early emergence of embryo. Negative effect on plant regeneration with higher concentration of BAP was also observed by earlier researchers viz.,  Kashif Waseem et al. (2011) and Zayova et al. (2012).

Regeneration and Hardening Plantlets

Shoot Regeneration

Different treatments such as MS + 0.25 mg l-1  NAA + 0.5 mg l-1  IBA; MS + 0.5 mg l-1  NAA + 0.5 mg l-1  IBA; MS + 0.5 mg l-1  NAA + 0.5 mg l-1  IBA; MS + 0.25 mg l-1  NAA + 1.0 mg l-1  IBA; MS + 0.5 mg l-1  NAA + 1.0 mg l-1IBA; MS + 1.0 mg l-1  NAA + 1.0 mg l-1  IBA were used to subculture the two true leaf stage emerged embryos. MS media supplemented with 0.5 mg l-1  NAA + 1.0 mg l-1  IBA  resulted in  the largest number of shoots per explant (0.92±0.12%) with the maximum frequency of shoot regeneration (86±0.12%) in Parbhani Kranti × A. tetraphyllus IC 141017.  The same media combination revealed maximum number of shoots/explants to the tune of 0.89±0.10 and 0.88±0.13 in cross combinations viz., Arka Anamika × A. tetraphyllus IC 141017 and Pusa Makhmali × A. tetraphyllus IC 141017 respectively. Similarly, the maximum frequency of shoot regeneration was observed in Arka Anamika × A. tetraphyllus IC 141017 (85±0.11%) and Pusa Makhmali × A. tetraphyllus IC 141017 (82±0.14%) on this media combination (Table 3).  Kabir et al. (2008) also obtained shoot differentiation in okra when MS media was supplemented with NAA and Dhande et al. (2012) who observed that MS media supplemented with IBA and NAA gave good shoot regeneration in okra.

Table 3: Shoot regeneration in different media combinations

Cross MS medium containing 1 mg l-1  IBA  MS medium containing 0.5 mg l-1  IBA
1 mg l-1  NAA 0.5 mg l-1  NAA 0.2 5mg l-1  NAA 1.0 mg l-1  NAA 0.5 mg l-1  NAA 0.25 mg l-1  NAA
Arka Anamika × A. tetraphyllus (IC 141017)
Callus formation +++ +++ +++ +++ ++ +
Avg. No. of shoots/explants 0.68 ± 0.108 0.89 ± 0.101 0.75 ± 0.113 0.62 ± 0.128 0.16 ± 0.114 0.08 ± 0.106
Shoot regeneration frequency (%) 52 ± 0.152 85 ± 0.113 70 ± 0.115 42 ± 0.110 22 ±0.156 12 ± 0.128
Parbhani Kranti × A. tetraphyllus (IC 141017)
Callus formation ++ +++ ++ ++ + +
Avg. No. of shoots/explants 0.58 ± 0.142 0.92 ± 0.126 0.64 ± 0.136 0.38 ± 0.142 0.28 ± 0.141 0.06 ± 0.128
Shoot regeneration frequency (%) 38 ± 0.126 86 ± 0.125 68 ± 0.129 29 ± 0.139 0.32 ± 0.100 0.14±0.132
Pusa Makhmali × A. tetraphyllus (IC 141017)
Callus formation ++ +++ +++ + + +
Avg. No. of shoots/explants 0.72 ± 0.109 0.88 ± 0.132 0.72 ± 0.134 0.39 ± 0.112 0.39 ± 0.112 0.10 ± 0.109
Shoot regeneration frequency (%) 46 ± 0.132 82 ± 0.136 58 ± 0.128 44 ± 0.110 41 ± 0.108 26 ± 0.121

Root Regeneration

The subculturing of regenerated shoots was done in the media containing different levels of auxins. After 10-15 days of subculturing there was initiation of roots in all cross combination and well developed roots were seen in 3 weeks. Arka Anamika × A. tetraphyllus IC 141017, Pusa Makhmali × A. tetraphyllus IC 141017, Parbhani Kranti × A. Tetraphyllus IC 141017 showed the maximum root regeneration  to the tune of 56.08, 78.28, and 48.12%, respectively in half-strength MS media containing 0.25 mg l-1  IBA + 200mg l-1 and  activated charcoal. Plantlets after proper rooting were transferred to sterilized soil less mixture (cocopeat: vermiculite: perlite in the ration of 1:1:1) in pots as presented in Figure 3.

Figure 3 Figure 3

Click here to View figure

Introduction of roots on regenerated shoots is important for establishment of plantlets in soil Kabir et al (2008). Maximum roots were observed in MS media containing 0.25mg l-1  IBA + 200mg l-1  and activated charcoal in the present study. Kabir et al. (2008) also reported good root regeneration by supplementing the MS media with IBA. Activated charcoal was used as anti browning agent. Activated charcoal stimulates nitrogen uptake by shoots and induce a dark environment resulting invitro rooting (Thomas, 2008). However, Muhammad Isshad et al. 2017 suggested that the reduced salt concentration to be effective for invitro rooting due to reduced nitrogen content rather than reduced osmotic potential.  The results also corroborates with Mohammad Irshad et al. (2017) who used 1/2 MS supplemented with IBA and AC (Activated Charcoal) for rooting in okra.

Conclusion

Interspecific hybridization using wild relatives through biotechnological interventions can be the best way to introduce desirable genes absent in the domesticated species. Present study was made with an aim to standardize a protocol of embryo rescue so to obtain the hybrids of Abelmoschus esculentus × A. tetraphyllus IC141017. Out of the four popular cultivars used in crossing, fruit set was observed only in Arka Anamika, Pusa Makhmali, Parbhani Kranti  when A. tetraphyallus IC141017 was used as a male parent. Healthy seeds can only be obtained before 15 d after pollination. Ms media containing on 0.5 mg l-1  NAA + 1.0 mg l-1  IBA  resulted in highest shoot regeneration in cross combinations, viz., Parbhani Kranti × A. tetraphyllus  IC141017, Arka Anamika × A. tetraphyllus IC141017 and Pusa Makhmali × A. tetraphyllus IC 141017. Among these Parbhani Kranti × A. tetraphyllus IC141017 showed greatest number of shoots per explant (0.92±0.12) as well as the maximum frequency of shoot regeneration (86±0.12%). On MS media supplemented with 0.5 mg l-1  NAA + 1.0 mg l-1  IBA, the maximum frequency of shoot regeneration was recorded in Arka Anamika × A. tetraphyllus IC 141017 (86±0.12%) and Pusa Makhmali × A. tetraphyllus IC 141017 (82±0.13%)

Acknowledgment

The authors are thankful to ICAR-National Bureau of Plant Genetic Resources (NBPGR), Indian Institute of Vegetable Research (IIVR), Varanasi and Sher-e- Kashmir University of Agricultural Sciences and Technology (SKUAST),-Jammu for providing the germplasm for conducting the present investigation. The authors are also highly thankful to Department of Science and Technology (DST), Ministry of Science and Technology, Govt. of India for funding the research project entitled, “Alien introgression of Yellow Vein Mossaic Virus (YVMV) resistance genes in okra (Abelmoschus esculentus L) through embryo rescue technique.” under Extra Mural Scheme.”

Conflict of Interest

There is no conflict of interest among authors for honorarium, grants, membership, employment, ownership of stock or any other interest or non‐financial interest such as personal or professional relation, affiliation and knowledge of the research topic of the present research paper.

Funding Source

The present investigation was carried out under the Extra Mural Research project funded by the Department of Science and Technology (DST), Ministry of Science and Technology, Govt. of India.

References

  1. Babu K. V. S and Dutta O. P. Cytogenetic studies of the F1 hybrid Abelmoschus esculentus X tetraphyllus and its amphidiploid. Agric. Res. J. Kerala1990; 28:22-25.
  2. Dhande G. A, Patil V. M, Raut R. V, Rajput J. C and Ingle A. G. Regeneration of okra (Abelmoschus esculentus) via apical shoot culture system. Afr. J. Biotechnol. 2012; 11 (86):15226-15230.
  3. Irshad M, He B, Liu S, Mitra S, Debnath B, Li M, and Qiu D. In vitro regeneration of Abelmoschus esculentus cv. Wufu: Influence of anti-browning additives on phenolic secretion and callus formation frequency in explants. Hortic Environ Biotechnol. 2017; 58(5): 503-513.
  4. Jose J and Usha R. Bhendi yellow vein mosaic disease in India is caused by association of a DNA β satellite with a begomovirus. Virol. 2003; 305(2), 310-317.
  5. Kabir A. H, Sarker K. K, Sharmin S. A, Islam M. S, and Alam M. F. Callus induction and plantlet regeneration in Abelmoschus esculentus (L.) Moench.  Agric. Sci. Technol. 2008; 4:193-204.
  6. Mamidwar R B, Nerkar Y S, and Jambhale  N D. Cytogenetics of interspecific hybrids in the genus Abelmoschus [okra, India]. Indian J.Hered1979; 11, 35-39.
  7. Meshram L . D and D.  K Dhapake. Cytogenetical studies on an inter-specific hybrid between esculentus (L.) Moench x A. tetraphyllus. In fourth International SABRAO Congress, Kulalampur. 1991.
  8. Prabu Studies on interspecific hybridization for resistance to yellow vein mosaic virus in okra (Doctoral dissertation, Mahatma Phule Krishi Vidyapeeth; Rahuri). 2005.
  9. Rajamony L, Chandran M  and Rajmohan  In vitro embryo rescue of interspecific crosses for transferring virus resistance in okra (Abelmoschus esculentus (L.) Moench). In International Symposium on In Vitro Culture and Horticultural Breeding 2004; 725, pp. 235-240.
  10. Rana S. C, Singh P. B, Pandita V. K and Sinha S. N. Evaluation of insecticides as seed treatment of control of early sucking pests in seed crop of Annf. Plant Protect. Sci. 2006. 14, 364-367.
  11. Rattan P, Kumar S, Slgotra R . K, Samnotra R. K and Sharma F. Development of interspecific F1 hybrids (Solanum melongena × khasianum) in eggplant through embryo rescue technique. Pl. Cell Tiss. Org. Cult. 2015; 120(1):379-386.
  12. Richardson M. J. An annotated list of seed borne di Third edition. C.M.I. Kew, Surrey, England. 1997; pp. 106- 107.
  13. Sengkhamparn N, Sagis L M, De Vries  R, Schols H A, Sajjaanantakul T, and Voragen A  .Physicochemical properties of pectins from okra (Abelmoschus esculentus (L.) Moench). Food Hydrocoll. 2010; 24(1): 35-41.
  14. Sheela M N. Evaluation of bhendi hybrids for yield and its components. M.Sc. (Agri.) Thesis, Kerala Agricultural University, Thrissur. 1986.
  15. Sindhu S. Inter-specific cross compatibility in the genus Abelmoschus. M.Sc. (Agri.) Thesis, Kerala Agricultural University, Thrissur. 1993.
  16. Thomas T. D. The role of activated charcoal in plant tissue culture. Biotechnol. Adv. 2008;  26(6): 618-63.
  17. Waseem K, Jilani, M. S, Jaskani, M. J, Khan  S, Kiran M,  and Khan G U. Significance of different plant growth regulators on the regeneration of chrysanthemum plantlets (Dendranthema morifolium L.) through shoot tip culture. Pak. J. Bot.  2011; 43(4): 1843-1848.
  18. Zayova E, Vassilevska-Ivanova R, Kraptchev B,  and Stoeva D. Indirect shoot organogenesis of eggplant (Solanum melongena). J. Cent. Eur. Agric. 2012; 13(3) :1-5.

Monometallic Zinc and Bimetallic Cu-Zn Nanoparticles Synthesis Using Stem Extracts of Cissusquadrangularis(Haddjod) and Proneness as Alternative Antimicrobial Agents

$
0
0

Introduction

Cissus quadrangularis belongs to family Vitaceae and have wide spread distribution in tropical parts of India. The plant is edible and is a succulent type of vine. It is found in Southeast Asia, Sri Lanka, Africa and Arabia. The plant is multipurpose and almost all plant parts are exploited for their pharmacological aspects. Stems have specific bone fracture healing properties and therefore named as “Haddjod” and Asthisamaharaka1. The roots and stems can be applied topically or can be prescribed as decoction, paste or in juice forms. Stem infusion have anti helmintic properties and fed to cattle for milk flow induction 2. Ash of plant is an alternative to baking powder while decoction with ginger and black pepper has been recommended in bodyache and muscular pain 3. The paste of stem is given in bowel infection related to indigestion and juice intake is relieving in menstrual disorders. The stem paste is also reported to be applied topically in snakebite, burns, wounds, and saddle sores of horses and camels 2. Literature is studded with reports of treatment of osteoarthritis, rheumatoid arthritis and osteoporosis.

Metallic nanoparticles biosynthesis has been reported earlier using leaf extracts from various plants such as Coffea Arabica, Azadirachta indica, and Agathosma betulina, Camellia sinensis, Hibiscuss abdariffa 4. Nanoparticle synthesis has been reported from leaves and stem of Cissus plant earlier for silver nanoparticles and depicted potent antimicrobial activity against bacteria 5. Antimicrobial aspects of zinc oxide nanoparticles have been further recommended for its usage in food preservation, a potent sanitizing agent for disinfecting and sterilizing food industry equipments and containers. Zinc oxide nanoparticles were synthesized using Parthenium hysterophorus leaf extracts and it revealed a quasi-spherical, radial, and cylindrical shape of nanoparticles with varied sizes, which were clustered together. The smaller size of nanoparticles has improved efficiency as antimicrobial agent and it covers the bacteria effectively causing better accumulation 6. Future prospects lie in synthesizing zinc oxide nanoparticles using living microorganisms and plants have wide range of applications in ceramics, electronics, rubber, paints, animal feed, cosmetics and pharmaceuticals industry. The zinc oxide nanoparticles are used in agriculture to provide nutrition to crop plants and it also provides resistance against pests 7. Moreover zinc oxide nanoparticle finds huge application in food industries as it is safe and has been reported in numerous marketable products 8. The most common nano-scale material present in food is silicon dioxide and titanium dioxide along with metallic silver. Silica/silicon dioxide acts as anti clumping agent to keep mixtures free flowing while titanium dioxide confer extra whiteness to white food items while nano-silver is used as disinfectant in clothing items. Fruits and vegetables are washed with nano-silver suspensions to make them more  shiny while sunscreens are available with SPF factors. The nano indicators are available with the product itself to tell the quality of food which deteriorate with time. Soluble material contains these nanoparticles which can come in contact with vital systems. Although, the synthesis process is quite challenging as compared to the wet synthesis via sol gel methods, precipitation method and decomposition 9. Considering the vast potential of zinc oxide nanoparticles present investigation was carried out to synthesize ZnO and bimetallic Cu-Zn nanoparticles using stem of Cissus quadrangularis which has been reported in treatment of bloody diarrhea, skin disorders, earache, hemorrhoid, irregular menstruation and as a potent bone setter 10. Our present investigation is an insight into the synthesis of monometallic zinc and bimetallic Cu-Zn nanoparticles from Cissus stem to be a potent reducing and capping agent which is rare as leaves have been recommended to contribute for nanoparticles synthesis and here stem is used as reducing and capping agent.

Materials and Methods

Plant and Culture Collection

The stem of Cissus quadrangularis used in the present study for antimicrobial activity were procured from Tau Devi Lal Herbal Park, Khizrabad Highway, Yamunanagar, Haryana and identified from Botany Department of Kurukshetra University, Kurukshetra, Haryana, India. The various human pathogenic microorganisms were procured from Microbial Type Culture Collection (MTCC): Institute of Microbial Technology (IMTECH), Chandigarh; which included Gram- negative bacteria: Escherichia coli (MTCC-5704), Pseudomonas aeruginosa (MTCC -2295) and two gram positive bacteria: Bacillus subtilis (MTCC-121) and Staphylococcus aureus (MTCC- 3160) along with Staphylococcus mutans (MTCC-497). The Muller Hilton broth was made for preservation of the cultures. All the test tubes containing broths were kept at 4ºC in the refrigerator for further studies.

Preparation of Plant Stems Extract

The stems of Cissus quadrangularis were thoroughly washed with water then allowed for oven drying at 50-65 ºC till moisture fully evaporated and grounded into fine powder. The 5 gm of this powder was soaked in 50 ml of de-ionized water and heated at 70 ºC for 30 minutes. The extract was filtered with Whatman filter paper No.-1. The extract after filtration was stored at 4° C till further use and was used within a week for synthesis according to Shah and his coworkers (2015) with minor modification 11.

Preparation of Monometallic Zinc Nanoparticles Solution

Very simple and cost effective combustion method was employed for synthesis of Zinc oxide nanoparticles under laboratory conditions. Approximately 100 ml of aqueous solution of zinc nitrate (0.1 M) was prepared and mixed with leaf extract in a ratio of 1:2 (Plant Extract : Zinc nitrate solution). The 50 ml of zinc nitrate solution(dissolved) was added drop wise into 12.5 ml of plant extract and further the solution was incubated in water bath at 700 C for complete one hour according Ramesh et al., (2014) with minor modifications. The prepared solution was analyzed further for antimicrobial analysis 12.

Confirmation of Monometallic Zinc Nanoparticles

Synthesized ZnO nanoparticles were confirmed by visual observation i.e. by the color change of original solution to creamish colored solution and taking absorption maxima at the wavelength range of (300-600). The nanoparticles were extracted by heating the solution at 70° C using on stirrer heater until solution get converted to zinc oxide nanoparticle in deep yellow colored paste and then to powder. The nanoparticles were further kept in hot Muffle Furnance for two hours at 400° C for calcination 12  (Fig. 1).

Figure 1: Peaks observed using UV spectrophotometer for zinc nanoparticles using Cissus stem. Figure 1: Peaks observed using UV spectrophotometer for zinc nanoparticles using Cissus stem. 

Click here to View figure

Preparation of Bimetallic Cu-Zn Nanoparticles Solution

Approximately 5 gram of copper sulphate pentahydrate (20 mM) and 6 gram of zinc nitrate (20 mM) were dissolved in 90 ml of de-ionized water  and incubated at ambient temperature in  water bath till solution became homogeneous. The 90 ml of this dissolved copper zinc solution was added drop wise into 10 ml of plant extract and the solution was incubated in water bath at 70° C for complete one hour. The prepared solution was analyzed further for antimicrobial analysis 13(Fig 2).

Figure 2: Peaks observed using UV spectrophotometer for Cu-Zn solution. Figure 2: Peaks observed using UV spectrophotometer for Cu-Zn solution.

Click here to View figure

Confirmation of Bimetallic Cu-Zn Nanoparticles

Synthesized Cu-Zn nanoparticles were confirmed by visual observation via color change of original bluish colored solution to dark green colored solution and taking absorption maxima at the wavelength range of (300-600)13 (Fig.3).

Figure 3: Peaks observed using UV spectrophotometer after CU-ZN nanoparticle synthesis using Cissus stem as plant extract Figure 3: Peaks observed using UV spectrophotometer after CU-ZN nanoparticle synthesis using Cissus stem as plant extract

Click here to View figure

Antimicrobial activity of plant extracts by Agar Well Diffusion Assay Method

The antimicrobial activities of plant extracts were evaluated by agar well diffusion assay 14. The microbial inoculums were inoculated aseptically spread uniformly on surface of pre solidified Mueller Hinton Agar (MHA) plates with the help of sterile glass spreader or sterile cotton swabs. A well of about 6.0 mm approximately diameter was aseptically punctured using a sterile cork borer. The cut agar disc was carefully removed by the use of sterile forceps. Plant extract was used as control. The Petri Plates were kept in laminar for 30 minutes for pre-diffusion to occur then Petri Plates were incubated overnight at 37° C for 24 hours. The antimicrobial spectrum of extract was determined in terms of zone sizes (diameters of inhibition zone) around each well. Zones were measured by high media zone scale.

Results and Discussion

The visual change in the color of the colloidal solution from greenish to light cream color confirmed the synthesis of zinc oxide nanoparticles which is expected to be due to coherent oscillation of electron gas at the surface of nanoparticles. The synthesis was further confirmed using UV–spectral analysis in range of (300-600) which resulted in an optical absorption band peak at 393 nm. However XRD analysis revealed the average particle size calculated using XRD pattern by applying Scherrer formula is about 31.94=32nm (Table-1). The X-ray diffraction (XRD) pattern of as synthesized ZnO nanoparticles obtained is as shown in (Figure 4) while bimetallic copper zinc nanoparticles were confirmed by visual color change of solution from green to bluish green colored solution.(Figure 5)

Figure 4: XRD analysis showing zinc nanoparticle peaks of Cissus Quadrangularis. Figure 4: XRD analysis showing zinc nanoparticle peaks of Cissus Quadrangularis.

Click here to View figure


Figure 5: Color Change during Nanoparticle synthesis Figure 5: Color Change  during Nanoparticle synthesis

Click here to View figure

Table 1: The size of ZnO nanoparticles synthesized using Scherer formula deduced using XRD data.

S. No. Pos.[°2θ] FWHM(°2θ) D(nm)
1. 10.7623 0.6496 12.83 nm
2. 12.8315 0.4913 17.00 nm
3. 13.4951 0.1494 55.95 nm
4. 13.4951 0.1866 44.79 nm
5. 19.0937 0.4031 20.88 nm
6. 20.3492 0.1596 52.84 nm
7. 21.6475 0.2860 29.55 nm
8. 23.9531 0.3773 22.49 nm
9. 24.9780 0.5290 16.07 nm
10. 28.6392 0.2044 41.91 nm
11. 29.7127 0.4178 20.55 nm
12. 31.7874 0.3426 25.19 nm
13. 34.4190 0.3053 28.46 nm
14. 36.2564 0.3427 25.49 nm
15. 37.8857 1.1061 7.93 nm
16. 40.2291 0.4655 18.99 nm
17. 43.7759 0.1834 48.78 nm
18. 46.6622 0.0340 265.89 nm
19. 47.5456 0.4021 22.56 nm
20. 51.5453 0.2418 38.12 nm
21. 53.1446 0.3486 26.63 nm
22. 56.5671 0.5239 17.99 nm
23. 62.8280 0.5352 18.18 nm
24. 66.3616 0.3061 32.40 nm
25. 67.9170 0.6028 16.60 nm
26. 69.0369 0.6045 16.67 nm
27. 76.9626 0.7173 14.79 nm

Antimicrobial Analysis

Any zone of size more than 2 mm is considered significant for antimicrobial activity. Our investigation for antimicrobial activity after zinc nanoparticle synthesis resulted in significant zones of inhibition against standard pathogens. The extracts were tested at four different concentrations of 25, 50, 100, and 150 µl as shown in Table-2. Although a lower concentration of 25 µl was tried against all bacterial pathogens. As the stem of Cissus has well known literature in bone fractures so antimicrobial concept against Streptococcus mutans a cariogenic pathogen was also tested. The zinc nanoparticles synthesized using Cissus stem resulted in a zone of diameter 13 mm at 50 µl followed by a zone of 18 mm at 100 µl and finally a zone of diameter 21 mm at a higher concentration of 150 µl against Streptococcus mutans. In comparison to zinc bimetallic copper-zinc nanoparticles resulted in zone of size 17 mm followed by 20 mm and 23 mm at three different concentrations of 50,100 and 150 µl respectively (Table-2).As Staphylococcus aureus have been observed to be major cause of many pathogenic disorders the present extracts were tested to consider the propensity of Cissus stem extracts. The extracts at 50 µl resulted in a zone of size 14 mm followed by 18 mm at 100 µl which in turn was followed by a zone of size 20mm at higher concentration of 150 µl concentration. The zone size goes on increasing in correlation to increased volume of extract considering zinc nanoparticles while bimetallic copper zinc nanoparticles resulted in zones of sizes 17 mm, 22 mm, 24 mm at three concentrations of 50,100 and 150 µl. The zone size showed a linear relationship with increasing concentration. Similar observation was reported by 14 and it revealed that zinc nanoparticles had more potential against gram positive bacteria Staphylococcus aureus and Bacillus subtilis. The research reported higher zones of inhibition against Escherichia coli, and Staphylococcus aureus using agar well diffusion assay. The investigation further revealed that nanoparticles are more potent against gram positive bacteria (Staphylococcus aureus) than gram negative (Escherichia coli.). Toxicity of zinc oxide nanoparticles was reported on Staphylococcus aureus and Escherichia coli and also on primary human immune cells 15. The 13 mm zinc oxide nanoparticles were potent enough to inhibit Escherichia coli at a concentration of 1 mM by loss of cell viability while immune cells were least affected at same concentration which inhibited gram positive and negative strains.

Table 2: Antimicrobial Activity of monometallic zinc oxide and bimetallic Cu-Zn nanoparticles synthesized using Cissus stem against selected pathogens.

Pathogens Volume of extract(µl) Cissus (Zn-Np) Cissus (Cu-Zn)
S. mutans 25
50 13 17
100 18 20
150 21 23
S. aureus 25
50 14 17
100 18 22
150 20 24
B.subtilis 25
50 11 25
100 18 29
150 19 31
E.coli. 25
50 18 23
100 20 27
150 22 29
P. aeruginosa 25
50 14 23
100 18 28
150 23 30

Sarkar et al.,(2018) evaluated antimicrobial assay at four different concentrations of 25,50, 75, and 100 mg against Staphylococcus aureus and Escherichia coli using methanol as solvent system. Methanolic extracts were also found to be more potent against these bacteria in comparison to other solvents employed and were capable of inhibiting both strains significantly 16. The zones of inhibition were comparable to that of standard drugs. One observation was with an increase in concentration the inhibition capability also goes on increasing. Considering B. subtilis a gram positive bacteria the zone size were comparable to zones observed against previous two bacterial pathogens S. mutans and S. aureus giving zones of 11 mm, 18 mm and 19 mm (Figure 6) at three standard concentrations of 50,100 and 150 µl but the bimetallic extract synthesized using Cissus stem showed prominent activity against this bacteria specifically resulting in bigger zones of diameter 25 mm, 29 mm and 31 mm at same three concentrations of 50, 100 and 150 µl (Figure 7). The results can open new horizons to study bimetallic nanoparticles in inhibiting disease responsible due to Bacillus. Our results well corroborate with that of  Tayal et al.,(2011) 17 who evaluated the comparative analysis of antimicrobial potential of zinc oxide nanoparticles against bacterial strains (mostly food borne pathogens) using qualitative and quantitative assays. Gram positive bacteria were more sensitive to zinc oxide nanoparticles than gram negative bacteria.

Figure 6: Zone of inhibition using zinc nanoparticles synthesized from Cissus stem against selected pathogens E.coli, P.aeruginosa and B.subtilis. Figure 6:  Zone of inhibition using zinc nanoparticles synthesized from Cissus stem against selected pathogens E.coli, P.aeruginosa and B.subtilis.

Click here to View figure


Figure 7: Prominent zones of inhibition using bimetallic Cu-Zn nanoparticles using stem extracts against Bacillus subtilis, Pseudomonas aeruginosa and Escherichia coli Figure 7: Prominent zones of inhibition using bimetallic Cu-Zn nanoparticles using stem extracts against Bacillus subtilis, Pseudomonas aeruginosa and Escherichia coli

Click here to View figure

Most of the nanoparticles have been reported to be negligible in inhibiting gram negative Escherichia coli bacteria. But present results were remarkable as  zones of inhibition of 18, 20 and 22 mm diameter were observed using zinc nanoparticles at three concentrations of 50,100 and 150 µl (Figure 6) while zones of greater size of 23, 27 and 29 mm were observed using bimetallic copper zinc nanoparticles during present investigation at three different concentrations of 50,100 and 150µl (Table-2)and(Figure-7).Antimicrobial assay of synthesized ZnONPs using fruit pulp of Aegles marmelos was tested against two fungal species, Fusarium solani and Aspergillus niger and three bacterial species representing both ‘Gram’ species namely Staphylococcus aureus, Pseudomonas aeruginosa and Escherichia coli. ZnO NPs exhibited very worthy antibacterial activity against Gram-positive bacteria Staphylococcus aureus with better inhibition zone contributed by 100 µg equivalent of ZnO suspension. In Gram-negative species, zone of inhibition was found less prominent compared to Gram positive. With Pseudomonas aeruginosa the effect was still prominent compared with Escherichia coli. It was noticed that E. coli showing (16 mm) 53.3% inhibition (at 100 µg of NPs), P. aeruginosa showing least inhibition of (5 mm) 16.6% (at 75 µg of NPs) and S. aureus is showing maximum inhibition of about (30 mm) 93.3% (at 100 µg of NPs) which is nearly equal to standard antibiotic used in research. 

Merinal and Stella, (2012) reported three solvent extracts (diethyl ether, ethanol and aqueous) using stem of Cissus quadrangularis against E. coli, K. pneumoniae and S.aureus along with anti-fungal activity against A. flavis, C. albicans and Fusarium solani along with two standard antibiotics tetracycline and flucanozole. The zone of inhibition ranged from a minimum of (4 mm) in diethyl ether extracts against Staphylococcus aureus to a maximum of 10 mm using ethanolic extracts against Escherichia coli while antifungal activity ranged from 8 mm to 12 mm being lowest against Fusarium solani using ethanolic extracts while highest against A. flavis using diethyl ether extracts18. Kashikar and George (2003) reported antibacterial activity of Cissus quadrangularis against different gram negative and positive strains. Stem extracts were extracted using different solvent system such as petroleum ether, ethanol, methanol, ethyl acetate, acetone and aqueous extracts against B. subtilis , P. aeruginosa, S. aureus, S. typhi and S. pyogenes19. The methanolic and ethanolic extracts resulted in potent activity against bacterial pathogens contradictory to that petroleum ether, acetone ethyl acetate and aqueous extracts were failed to inhibit any bacteria. Escherichia coli did not respond to any of the extracts. MIC value of different solvent extracts against different pathogens ranged from a minimum of 0.465 mg/ml using acetone and methanol extracts against E. coli and S.aureus respectively to a maximum of 6.25 mg/ml using ethyl acetate fractions against S. typhi. Liu et al., (2009) reported the antimicrobial activity of zinc oxide nanoparticles of size 70 nm at different concentrations of 0, 3, 6, 12 m/mol against  E. coli. A higher concentration of 12 m/mol inhibited E. coli completely and suggested the possible mechanism of zinc nanoparticles to distort and damage the bacterial cell membrane which in turn results in leakage of intracellular contents and eventually death of the cells 20.

In comparison to previous reports of nanoparticles the zone size observed against P. aeruginosa were also equivalent to that observed against other pathogens. A zone size of 14, 18 and 23 mm were observed using zinc nanoparticles at three concentrations of 50,100 and 150 µl (Fig. 6)while bimetallic copper-zinc nanoparticles were subsequently efficient in inhibiting the pathogens by producing zones of 23, 28 and 30 mm at three concentrations of 50,100 and 150 µl respectively (Fig 7). Evaluation of antimicrobial activity of Cissus quadrangularis against B. subtilis, E. coli, P. aeruginosa and S. aureus gave affirmative response; it can be assumed that the Zn nanoparticles have a higher antimicrobial activity even at the lower concentration in Haddjod. Shah et al(2017) reported Similar quite results stating that the ZnO nanoparticles produces a maximum zone of inhibition against Pseudomonas aeruginosa followed by Proteus mirabilis, Bacillus cereus, Escherichia coli and Staphylococcus aureus 11. The green synthesized ZnO nanoparticles are often used as an alternative to existing antimicrobial agents. Increased concentrations of zinc nanoparticles distort and damage the bacterial cell membrane which in turn results in leakage of intracellular contents and eventually leading to mortality of the cells. Still the mystery/mechanism behind the possible procedure is under investigation 21. The zinc nitrate ions can form intermediate complexes with OH groups of glucuronic acids which in turn are present in hydrolysable tannins, which subsequently undergoes oxidation to quinine forms with consequent reduction of zinc to ZnO nanoparticles, the ZnO nanocrystal are formed through nucleation and growth processes. Tannins were present in phytochemical analysis in both plant species so water soluble glucuronic acids are believed to play a major role in green reaction. The presence of alkaloids, carbohydrates, glycosides, Tannins, Phenolic compounds,, protein and amino acids, Gums and mucilage flavones, Saponins and flavonoids, steroids and sterols, ethyl acetate fraction was reported to consist of phytosterols, flavonoids and triterpenoids while hydroalcoholic fractions showed carbohydrates, tannins, amino acids and Vitamin C 22. The flavonoids and triterpenoids were found to be active constituents in plant stem which are key route for antimicrobial activities. The chloroform and acetone extracts resulted in zones from 12 mm to 14mm in comparison to aqueous extracts which gave zones of 11 to 13 mm.

Phytochemical analysis revealed the presence of sterols in all the fractions while methanolic and ethanolic extracts showed presence of phenols and flavonoids. In comparison acetone and aqueous extracts revealed alkaloids as major components 7. The antimicrobial analysis carried out using nanoparticles resulted in a maximum zone of 36 mm against Enterobacter aerogenes while moderate activity was reported against S.aureus and E. coli. The possible mechanism behind antimicrobial activity was estimated as electrostatic interaction between negatively charged cell membranes of micro organisms and positively charged nanoparticles. The zinc nanoparticles penetrate the membrane and in turn induce cell signaling pathways by dephosphorylation of peptide on tyrosine residues. ZnO nano- particles in the bacterial membrane causing a change in membrane integrity, interference in DNA replication, production of Reactive oxygen species etc., and exerts stress on membrane leads to depolarization of bacterial membrane and cellular content will ooze out 23,24. It was reported that ZnO NPs effect is more marked against Gram positive bacterial strains compared to Gram negative bacterial strains 25 Negative charged ZnO NPs interacted with Gram positive bacteria by electrostatic forces, hence causing inhibition 26. Various methods had been adopted for synthesis of ZnO NPs using green approach. Although Cissus stem has been used by Kalpana et al (2017) for zinc oxide nanoparticle synthesis and they reported pure spherical shaped 23-64 nm sized nanoparticles and further evaluated antibacterial, anti-helmintic, antioxidant and anti arthritic activities. Their study well corroborate with our present research in observing maximum zone of inhibition against E. coli a gram negative bacteria of 21 mm followed by S. aureus (15 mm and below 10 mm zones for Listeria, Salmonella and Klebsiella 27. So, Cissus stem extracts were capable of synthesizing zinc nanoparticles and break the persistent myth of nanoparticles to be more selective and specific in activity against gram positive strains in comparison to gram negative E. coli and P. aeruginosa. Our present research is one step ahead to synthesize bimetallic cu-zinc nanoparticles which were confirmed by visual change in color and further revealed zones of greater than 20mm size as shown in Fig. 6 and Fig. 7. So we propose that in future nanoparticles will be used as alternative to existing antimicrobial agents.

Conclusion

In conclusion, the present investigation devised a very economical and eco-friendly method to biosynthesize phytogenic monometallic ZnO and bimetallic Cu-Zn Nanoparticles using aqueous stem extracts of Cissus quadrangularis without use of toxic and hazardous chemicals. The characterization results revealed that biosynthesized ZnO NPs have an average size of 32 nm and exhibit good antimicrobial properties. Thus, biosynthesized ZnONPs could prove as an effective photo catalyst to be utilized for the degradation of harmful and toxic pollutants persisting in aquatic environment. One step Combustion synthesis of nanoparticles by using plants provides cost effectiveness and environmental protection. In this context, ZnO NPs were synthesized using Cissus stem which acts as both reducing and capping agents in synthesis part. XRD pattern show fine nanoparticles of size of minimum of 7.93 nm to 55.95 nm while larger size of 265.89 nm showed agglomerate formation of nanoparticles. ZnONPs showed excellent results with both gram positive and gram negative bacterial species, contradiction to previous reports which selectively inhibit gram positive strains in comparison to gram negative. Thus, the study demonstrates easy, effective way of using natural products as an energy fuels for the preparation of desired multifunctional ZnO nanoparticles with very good properties. The bimetallic synthesis of Cu-Zn nanoparticles in present investigation opens the doors to researchers to synthesize bimetallic nanoparticles in lieu of enhanced zones of inhibition and future potential to use as an alternative to antimicrobial agents.

Acknowledgment 

We thank the Department of Biotechnology, University Institute of Engineering and Technology for the lab facilities provided for the completion of the project.

Conflict of Interest

The author declares no Conflict of Interest.

References

  1. Shirwaikar A., Khan S. and Malinib S. Antiosteoporotic effects of ethanol extracts of Cissus quadrangularis On ovariectomized rat. Journal of Ethnopharmacology. 2003; 89(2–3):245–250.
    CrossRef
  2. Basker S. and Kottamparambath M.Y. Antibacterial efficacy of Cissus quadrangularis from different provinces. Research in Pharmacy. 2013; 3(6).
  3. Balasubramaniana P, Jayalakshmib K, Vidhyab N, Prasada R, Khaleefathullah Sheriff A, Kathiravana G, Rajagopala K, Sripathi and Sureban M. Antiviral activity of ancient system of ayurvedic medicinal plant Cissus quadrangularis (Vitaceae). Journal of Basic and Clinical Pharmacy. 2010; 001(001):37-40.
  4. Salam H.A., Rajiv P., Kamraj M., JagadeesWaran , and Gunalan S. et al. Plants: Green route for nanoparticle synthesis. Int. Res. J. Biol. Sci. 2012; 1:85-90.
  5. Gopinath V, Priyadarshini S, Meera Priyadharsshini N, Pandian K, Velusamy P. Biogenic synthesis of antibacterial silver chloride nanoparticles using leaf extracts of Cissus quadrangularis Materials Letters. 2013; 91:224–227.
    CrossRef
  6. Datta A, Patra C, Bhardwaj H., Kaur S., Dimri N, and Khajuria R.C. Green synthesis of zinc oxide nanoparticles using Parthenium hysterophorus leaf extracts and evaluation of their antimicrobial properties. J of Biotechnology and biomaterials. 2012.
  7. Sindhura, K. Sri, Prasad, T.N.V.K.V. and Hussain, O.M. Synthesis and characterization of phytogenic zinc nanoparticles and their antimicrobial activity. Proceeding of the international conf. on Advanced nanomaterial and emerging engineering tech.(ICANMEET-2013).Sathybama Univ., Chennai, India in association with DRDO,NewDelhi,India(24th-26thJuly,2013).
  8. Tayal A.A. ,El-Tras F., Moussa S., El-Baz A.F., Mahrous H. ,et al.Antibacterial action of zinc oxide nanoparticles against food borne pathogens. J Food Safety. 2011; 31:211-218.
    CrossRef
  9. Suntako, R. Effects of zinc oxide nanoparticle synthesized by precipitationmethod on mechanical and morphological properties of the CR foam. Mater. Sci. 2015; Vol 38(4).pp 1033-1038.
    CrossRef
  10. Murthy C., Vanitha K.N., Swamy M.M. and Ravishankar G.A. Antioxidant and antimicrobial activity of Cissus quadrangularis. Med. Food. 2003; 6:99.
    CrossRef
  11. Shah R.K., Boruah F. and Parween N..Synthesis, characterization of Zno nanoparticles using leaf extracts of Camellia chinensis and evaluation of their antimicrobial efficacy. J. Curr. Microbiol. Appl. Sci. 2015; 4(8), 444-450
  12. Ramesh P., Rajendran A., and Meenakshisundram M. Green synthesis of zinc oxide nanoparticle susing flower extract of cassia auriculata. of nanoscience and nanotechnology. 2014; 2(1), 41-45.
  13. Minal SP, Prakash S. Cu-Zn and Ag-Cu bimetallic nanoparticles as larvicide to control malaria parasite vector: a comparative analysis. In 2016 IEEE Region 10 Humanitarian Technology Conference (R10-HTC) 2016 Dec 21 (pp. 1-6).IEEE.
    CrossRef
  14. Perez, M. Pauli and P. Bazerque, “An antibiotic assay by agar well diffusion method”, ActaBiologiaet Medicine Experimentalia. 1990; 15:113-115.
  15. Getie S., Belay A., Reddy A.R. and Belay Z. Synthesis and characterization of zinc oxide nanoparticles for antibacterial applications. Journal of Nanomedicines and nanotechnology. 2017; S8:004 doi:10.4172/2157-7439.
    CrossRef
  16. Reddy K.M., Feris K, Bell J, Wingett DG , Hanley C et al. Selective toxicity of zinc oxide nanoparticles to prokaryotic and eukaryotic systems. Phys. Lett 2007.
    CrossRef
  17. Sarkar BK ,Kumar  R, Kumar V, Reeta , Shasipal C., Murti Krishna, Verma SC, Singh R., and Ramaiah M. Antimicrobial and phytochemical evaluation of Cissus quadrangularis Int. J. OF Ayurveda and Pharma Research. 2018; 6(7):24-28.
  18. Tayal A.A., El-Tras W.F., Moussa S., El-Baz A.F, Mahrous H. et al. Antibacterial action of zinc oxide nanoparticles against food borne pathogens. J Food Safety. 2011;31:211- 218.
    CrossRef
  19. Merinal S and Viji S. In vitro screening of antimicrobial potential of Cissus quadrangularis Asian J. of Plant Science and Research. 2012; 2(1):58-62.
  20. Kashikar N.D, and George I .Antibacterial activity of Cissus quadrangularis Indian  J of Pharma Sci. 2003; 68(2).244-247.
  21. Liu, L. He, A. Mustapha, H. Li, Hu ZQ and M. Lin, “Antibacterial activities of zinc oxide nanoparticles against Escherichia coli O157:H7”. Journal of Applied Microbiology. 2009;107(4):1193-1201.
    CrossRef
  22. Teware K, Singh P, and Mehta R. Phytochemical extraction and analysis of medicinally important plant Cissus quadrangularis(Haddjod). Biomedical and Pharmacology J. 2011; 4(1):175-179.
    CrossRef
  23. Dobrucka R. and Długaszewska J. Biosynthesis and antibacterial activity of ZnO nanoparticles using Trifolium pratense flower extract. Saudi J. Biol. Sci. 2016, 23, 517–523.
    CrossRef
  24. Díaz-Visurraga J., Gutiérrez C., Von Plessing C. and Garcí A. Metal nanostructures as antibacterial agents, science and technology against microbial pathogens: research, development and evaluation. Formatex, Badajoz. 2011, pp. 210–218
  25. Oves. Antimicrobial activity of metal oxide nanoparticles against Gram-positive and Gram-negative bacteria: a comparative study. Int. J. Nanomed. 2012, 7, 6003.
    CrossRef
  26. Raghupathi K.R., Koodali R.T. and Manna A.C. Size-dependent bacterial growth inhibition and mechanism of antibacterial activity of zinc oxide nanoparticles. Langmuir. 2011, 27, 4020–4028.
    CrossRef
  27. Kalpana V. N., Patra R. P. and Rajeshwari Devi V. Green synthesis of zinc oxide nanoparticles using fresh stem of Cissus quadrangularis extract and its various in vitro studies .Asian J. of chemistry. 2017, 29(6).1323-1327.
    CrossRef

A Correlational Study of Hepatic Steatosis (Fatty Liver Disease) and Liver Enzymes (ALT, AST, GGT) In The Scenario of Insulin Resistance Among Young Medicos

$
0
0

Introduction

Nowadays Nonalcoholic fatty liver disease (NAFLD) has become an emerging health issue in adultsand children. It is a condition with similar histology with alcoholic liver disease but without any history of alcohol intake and the disease,the spectrum includes nonalcoholic fatty liver, nonalcoholic steatohepatitis, liver cirrhosis, and hepatocellular carcinoma1-3. In western countries, at least one-quarter of the general population is being affected by NAFLD. Adaptation of sedentary lifestyle like west and increasing frequency of obesity contributes to increased prevalence of NAFLD in the Asia-pacific region over the past two decades4,5and India is no exception to this scenario.6,7. Though it is more common in adults, now it is affecting children and young adults, especially obese ones1.

The pathogenesis of NAFLD has been proposed as a two-hit model by Day and James. The “first hit” takes place with the accumulation of lipids in the hepatocytes and insulin resistance is the main contributor to hepatic steatosis8-10.The “second hit” leads to hepatocyte injury, inflammation, and fibrosis. Oxidative stress and subsequent lipid peroxidation, pro-inflammatory cytokines, adipokines, and mitochondrial dysfunction are behind the “second hit”8.

NAFLD is often diagnosed after the finding of mildly abnormal LFTs. It happens to be the most common cause of elevated Transaminases other than viral and alcoholic hepatitis. However, liver Transaminase levels rarely reach beyond 3 or 4 times the upper normal limit. Serum Transaminases elevation is linked with higher body mass index, waist circumference, serum triglycerides, and fasting insulin, and lower HDL cholesterol1,11.The Alanine Transaminases (ALT) levels are higher than the Aspartate Transaminases (AST) levels in most instances1,12. It has also been found that Gamma-Glutamyl-Transferase (GGT) is elevated in persons having NAFLD13,14 and it is frequently associated with insulin resistance and higher BMI15,16.

In healthy individuals, some amount of cytoplasmic enzyme, like ALT, AST (within the reference range) are present in the circulation mainly due to cell leakage. In pathological conditions, Cell injury allows more leakage of cytoplasmic enzymes from cells, but a minimal release of other types of enzymes. Synthesis of GGT also increases in diseased human liver16.The mechanism of release of membrane-bound enzymes such as GGT into the circulation is less well understood. Elevated Serum GGT level probably reflects ongoing chronic inflammation; often associated with low levels of anti-inflammatory hormones e.g. adiponectin or with reduced effectiveness of insulin as a modulator of cytokine action.17,18 GGT is often found to be high in hepatic steatosis associated with insulin resistance presenting with chronic inflammation due to oxidative stress.17

The medicos who are nowadays habituated toa sedentary lifestyle are the population at risk because of the intense stress they go through before and after joining the curriculum. So they easily fall prey to metabolic derangement which has long-term adverse effects. But these harms can be prevented early, simply by changing lifestyle, regular exercise, weight reduction19,20. Justification for selecting young medicos lies in the fact that; as they are representing the medical fraternity as well as the youth, through their awareness about the risk factors of NAFLD, can be spread to society so that more severe complications developing from this can be avoided.

In this context, the present study is aiming to correlate hepatic steatosis with IR, ALT, AST, and GGT and to find out the Enzyme better correlating with hepatic steatosis than others in the Scenario of Insulin Resistance among young medicos of North Bengal Medical College and Hospital.

Materials and Methods

STUDY DESIGN: The present study is an institution-based observational study with a mixed design for a one-year duration.The study was conducted after approval from the Ethics committee of North Bengal Medical College and Hospital from April-2015 to March-2016 in the department of Biochemistry of North Bengal Medical College and hospital.

132 apparently healthy young medicos of North Bengal Medical College aged between 18-25 years were included in the study after detailed history taking. Informed consent was taken from all the subjects under the study.

Inclusion Criteria

AGE: 18-30 years

GENDER: both male and female.

Both under- graduate& post-graduate of North Bengal Medical College.

Apparently healthy individuals

Exclusion Criteria

Exclusion criteria for selection are the following Persons with a history of Habitual alcohol intake (Daily ingestion of less than 20 g ethanol has been suggested as the maximum alcohol intake compatible with a diagnosis of NAFLD) 16. Smoking, any other addiction or drug abuse like Cannabis, Opioids, Sedatives, etc. Any medication like lipid-lowering drugs, Paracetamol, Methotrexate, Barbiturates, Oral Contraceptives, Persons with any kind of liver, renal, or thyroid disorders, cardiovascular diseases (e.g. h/o Acute myocardial infarction, ischemic heart disease etc.), chronic obstructive pulmonary disease, pancreatic pathologies, gall bladder pathologies, febrile illness, Acute inflammatory conditions like Juvenile Rheumatoid Arthritis, Systemic Lupus Erythematosus, etc.

For all the subjects, thorough physical examinations including anthropometry were performed. Among laboratory investigations, fasting blood glucose and fasting insulin, liver enzymes were of paramount importance as per the study was concerned. 5-6 ml fasting blood sample was collected. Fasting blood glucose, ALT, AST were measured in an automated analyzer(Transasia- XL-600) using ERBA XL- system packs. GGT was measured in Transasia-CHEM 5X Semi-automated analyzer using reagents from (CORAL: Clinical systems).Insulin was assayed by the ELISA method using kits from Accubind in Robonik ELISA Washer and Reader. Quality assurance of the parameters under study was maintained by internal quality assurance. Insulin resistance was calculated with the help of the HOMA IR calculator. Ultrasonography was done for every case. Both subcostal and inter-costal scanning were done. Normal liver parenchyma is seen as solid homogenous echotexture which is midway between the renal cortex and pancreatic echogenicity. The findings of hepatic steatosis at sonography include increased echogenicity and sound attenuation.

Analysis of Data

The data obtained were analyzed by SPSS 20 software for Windows. Results obtained were arranged in tabular and graphical forms.

Cut off value of Insulin resistance in this study population is determined by ROC (receiver operating characteristics) curve using the same software. (State variables were: normal denoted by 0 and NAFLD group denoted by 1). The area under the ROC curve ranges from 0.5 to1.

The area under the curve 1 suggests a perfect test, 0.9-0.99 is an excellent one, 0.8-0.89 suggests a good test, 0.7-0.79 is fair test, 0.51-0.69 suggests poor one and <0.5 is a worthless test. Cut off value of IR was determined by fitting the highest value of sensitivity with the lowest value of 1- specificity. (Vide figure-1)

Figure 1: ROC curve for determination of cut-off value of Insulin Resistance Figure 1: ROC curve for determination of cut-off value of Insulin Resistance.

Click here to View figure

Results And Analysis

The study population consisted of 132 medicos aged between 18 to 25 years of North Bengal Medical College. A sample size of 122 was estimated taking prevalence as 10 percent, with 95 percent level of confidence using modified Cochran formula.  We have screened all the medicos of the age group 18-25, of our teaching institution, in the study period and included 132 individuals into our study fitting with study criteria.

From the total number of 132 subjects, 89 (67.4%) were male and 43 (32.6%) were female. Among all the subjects 92 subjects (67.4%) were normal, 30 (25%) had grade 1 fatty change, 10 (7.6%) had grade 2 fatty change. Furthermore,the frequency distribution of the hepatic sonographic findings among male & female subjects was done which is shown in tabular format (vide Table-1). Anthropometric details of the study population is given in a table-2(vide table-2)

Table1: Distribution of gender variable in case of normal findings, Grade 1 fatty change, Grade 2 fatty change

Normal Male Female Total
63

(71%)

29

(67.4%)

92

(69.7%)

Grade 1 fatty grade 19

(20%)

11

(25.6%)

30

(22.7%)

Grade 2 fatty grade 7

(9%)

3

(7 %)

10

(7.6%)

Total 89

(100%)

43

(100%)

132

(100%)

Table 2: Distribution (Mean ± SD) of the following Anthropometric variables in case of normal findings,Grade 1 fatty change, Grade 2 fatty change.

Anthropo-metric Variable

Normal

Mean ± S.D.

Grade1fatty change

Mean ± S.D.

Grade 2 fatty change

Mean ± S.D.

Height (cm) 162.144±8.392 167.054±9.375 169.625±7.227
Weight (kg) 62.430±10.719 74.070±9.327 73.750±6.702

BMI

(kg/ m2)

23.616±2.865 26.357±2.530 25.628±0.940

Using Chi-Square (χ2) test for independence, it was found that there is no significant association between hepatic steatosis and sex distribution p-value-0.238).

For further ease of analysis, both grade -1 and grade-2 fatty change are combined under NAFLD. As subjects having grade 2 fatty liver is less innumber, we have merged both grade 1 and grade 2 fatty liver under the broad heading NAFLD group.

It is observed that in the NAFLD group AST: ALT is 0.9 which is less than 1. This finding is more in favor of a diagnosis of NAFLD than alcoholic liver disease and other advanced liver disease21. In alcoholic liver disease synthesis of a mitochondrial isoform of AST is increased which has longer half-life than the cytoplasmic isoform of AST. So, in alcoholic liver disease, AST to ALT ratio is usually greater than 114.

Cut off value of Insulin resistance in this study population is determined by ROC (Receiver Operating Characteristic) curve. The area under the curve is 0.937 which is nearer to 1. So, the accuracy of the test is very good.The cut-off value of IR in the present study population is determined to be 1.525 by matching the highest value of sensitivity with the lowest value of 1- sensitivity (p-value < 0.001). (Vide figure-1)

Using unpaired student’s t-test it has been found that there are significant differences between the mean values of ALT, AST, GGT, IR in normal subjects and subjects having NAFLD. Difference is significant at the (p < 0.001) level (Vide table-3).

Table 3: Comparison of the mean values of Liver enzymes (ALT, AST, GGT) & IR (HOMA-IR) between Normal and NAFLD group (unpaired Student’s t test)


Parameters

Normal (92)

Mean ±SD

NAFLD (40)

Mean ± SD


t value


P value

ALT (IU/ lt) 28.599 ±15.491 51.450 ±18.134 -7.389 <0.001**
AST (IU/ lt) 27.323 ±15.626 43.675 ±18.148 -5.257 <0.001**
GGT (IU/ lt) 12.349 ± 4.878 23.168 ± 11.179 -7.763 <0.001**
IR (HOMA-IR) 1.164 ± 0.548 2.057± 0.595 -8.389 <0.001**

Another grouping was done using the cutoff value of Insulin Resistance (1.525) among study subjects and significant differences are found between the mean values of ALT, AST, and GGT among the two groups. (I.e. without Insulin Resistance and Those who have Insulin Resistance more than the Cut-Off). Difference is significant at the (p < 0.001) level (Vide table-4).

Table 4: Comparison of the mean values of Liver enzymes (ALT, AST, GGT) between groups (IR ≥ 1.525) & (IR<1.525) (unpaired Student’s t test).

Parameters IR ≥ 1.525 (42) Mean ±SD IR<1.525 (90) Mean ± SD t value P value
ALT (IU/ lt) 51.024 ±18.130 28.291 ±15.340 7.476 <0.001**
AST(IU/ lt) 43.905 ±18.319 26.852 ±15.152 5.627 <0.001**
GGT(IU/ lt) 22.725± 11.012 12.316±5.002 7.485 <0.001**

By both Kendall’s tau_b and Spearman’s rho correlation test, it is found that there is significant positive concordance between liver enzymes ALT, GGT, and hepatic steatosis in subjects having insulin resistance ≥ 1.525 (Vide table-5).

Table5: Showing correlation between Hepatic Steatosis& Liver enzymes (ALT, AST, GGT) in subjects having insulin resistance ≥ 1.525

  Hepatic

  Steatosis

  Kendall’stau_b   Correlation coefficient (r)

ALT AST GGT

0. 350**


0.140 0.426**

Significance

(p) 2- tailed

0.007 0.281 0.001
Spearman’s rhoCorrelation coefficient (r) 0.421** 0.169 0.514**
Significance

(p) 2- tailed

0.005 0.286 0.001

Binary logistic regression analysis with stepwise adjustment added more strength to the findings of the correlation study. It was found that the odds of developing hepatic steatosis with One-unit higher ALT values in the total study population (n = 132) was 1.072 whereas for GGT it was 1.3, with the predictability 78.8 % vs 85.6 % for ALT to GGT. When the statistical model further narrowed that down to the population with Insulin Resistance (i.e. n = 42), the Odds for GGT increases significantly to 1.532 (p = 0.03) with the predictability of developing hepatic fatty changes 92.29% which is better than the same adjustment for ALT i.e. 90.2%. Hence it can be said that within our study population, in presence of insulin resistance, subjects having higher GGT values, rather ALT, can possess a greater risk of developing Steatotic changes, comparing the Odds (GGT to ALT 1.532 vs 1.067) (vide table-6).

Table 6: Showing Odds ratio for development of fatty changes in different statistical models using Binary Logistic regression.

Parameters Odds for Developing Hepatic Fatty changes Significance

(P value)

Nagelkerke Rfor Model Summary Predictability Percentage

ALT (n= 132)

1.072 < 0.001 0.376

78.8%

GGT(n= 132)

1.3 < 0.001 0.469

85.6%

ALT in presence of IR

( > 1.525)

(n= 42)

1.067 0.19 0.525 90.2%
GGT in presence of IR

( > 1.525)

(n= 42)

1.532 0.03* 0.572 92.29%

Discussion

Prevalence of NAFLD is increasing in adolescents and the young population nowadays. Previous studies have been shown that NAFLD may advance to more severe hepatic conditions like cirrhosis, liver failure, and hepatocellular carcinoma. A strong association of NAFLD and metabolic syndrome has been found1-3so that often NAFLD is addressed as a hepatic presentation of metabolic syndrome.

NAFLD also represent as an important self-governing risk for the development of Cardiovascular disease (CVD). Several recent longitudinal studies have shown that CVD and atherosclerosis are important causes of morbidity and mortality in patients with NAFLD14. The liver is the center forthe production of classical biomarkers of inflammation and endothelial dysfunction. It has been shown that fibrinogen and CRP levels, which, known CVD risk factors, are increased in NAFLD patients, particularly in those with NASH 22.

Insulin resistance plays a major role in both NAFLD and metabolic syndrome. Both peripheral and hepatic insulin resistance is present in patients with NAFLD, irrespective of the coexistence of impaired glucose tolerance or obesity. Insulin resistance contributes to increased blood glucose level which in turn produces free fatty acids (FFA). Excess FFAs are not taken up by peripheral adipocytes and myocytes, instead of stored as diacyl and triacyl-glycerol in hepatocytes leading to the development of steatosis 23. Such Insulin resistance is regulated by both genetic and acquired factors which in turn influence the complications developed from insulin resistance19. It is associated with many serious medical conditions such as type 2 diabetes mellitus, cerebrovascular and coronary artery diseases, neurodegenerative disorders, etc. The association between insulin resistance and increased cardiovascular disease is mediated mainly at the genetic level. Insulin resistance leading to impaired nitric oxide-mediated vasorelaxation may contribute to hypertension and increased risk of atherosclerosis24.

The study population includes 132 medicos aged between 18 to 25 years. Details of the demographic distribution of the study population are discussed in the results and analysis section.

Though Ludwig in the definition of NAFLD stated that it is more common in women than in men25and in older studies also NAFLD was more frequent in women, the present study is not in agreement with this finding. In the present study, it has been seen that there is no significant association between hepatic steatosis and sex distribution.“TheDionysos study” also states that gender is not a risk factor for NAFLD in the general population1,4.

In the present study, it has been observed that healthy individuals had lower values of AST, ALT, GGT& IR than subjects having hepatic steatosis.  [ (AST- 27.323 ± 15.626 vs 43.675 ± 18.148 IU/lt), (ALT- 28.599 ± 15.491 vs 51.450 ± 18.134 IU/lt), (GGT- 12.349 ± 4.878 vs 23.168 ± 11.179 IU/lt), (IR- 1.164± 0.548 vs 2.057 ± 0.595). The difference between the mean values of AST, ALT, GGT & IR among the two groups is significant at the level of P-value <0.01.

The further grouping was done using the cutoff value of Insulin Resistance (1.525) and a significant difference was found between the means values of ALT, AST, GGT among two groups (i.e. with Insulin Resistance ≥ 1.525 and those having Insulin Resistance < 1.525). [ (AST- 43.905 ± 18.319 vs 26.852 ± 115.152 IU/lt), (ALT- 51.024 ± 18.130vs 28.291± 15.340 IU/lt), (GGT- 22.725 ± 11.012 vs 12.316 ± 5.002 IU/lt)] The difference between the mean values of AST, ALT&GGT among two groups are significant at the level of P-value <0.01.

A good number of studies were conducted in western countries as well as in India which established that NAFLD is frequently associated with higher values of liver enzymes. R. Haring, H. Wallaschofski et al. in 2009 found in their study that GGT is frequently elevated in NAFLD and may also be a marker of increased mortality13. S. Akila, R. Deepti et al also concluded in their study in 2014 that NAFLD with MetS had increased serum GGT level 26. Both studies support the finding of the present study. Iqbal MurshedKabir et al also found in their study that the mean values of ALT and AST were much higher than the reference range in patients with NAFLD12. But the study of A. Wieckowska, A.E. Feldstein et al contradict the finding of the present study. In their study, more than two-thirds of NAFLD patients were found to have normal aminotransferase levels27. In another study, it was found that the entire histological spectrum of NAFLD can be observed in patients with normal ALT values28.In many previous studies, it was reported that MetS which is also known as Insulin Resistance syndrome is associated with abnormal liver function tests.  AST, ALT, and GGT levels are high in patients of MetS, especially with high BMI15.Results from the cross-sectional study of S. Perera, V. Lohsoonthorn is also unison29.

Further statistical analysis has been done to find out is there any Enzyme better correlating with hepatic steatosis than others in the Scenario of Insulin Resistance and an interesting finding came into the light. Let’s explore that in further discussion.

When both Kendall’s tau_b and Spearman’s rho correlation test performed it was found that there is significant concordance (p value<0.01) between liver enzymes ALT and GGT and hepatic steatosis in subjects having insulin Resistance (>1.525) but not with AST (p-value = 0.286). The correlation coefficient (i.e. r) is found to be higher incase of GGT than ALT in both the test (vide Table-5).The finding implies that GGT has more positive concordance with NAFLD than ALT in the scenario of insulin resistance.

Having ALT and GGT positively correlating with hepatic steatosis in presence of insulin resistance, further Binary Logistic Regression with stepwise adjustment has been performed to ascertain which one of them predicts better about the development of fatty changes in this scenario. It has been observed that with Higher GGT values stronger predictability was found with hepatic steatosis than ALT among subjects having insulin resistance > 1.525 (p-value 0.03). A very few studies are found to directly or indirectly support the finding of the present study. R. Haring, H. Wallaschofski et al. in 2009 found in their study that GGT is frequently elevated in NAFLD and may also be a marker of increased mortality13. S. Akila, R. Deepti et al also concluded in their study in 2014 that NAFLD with MetS had increased serum GGT level26. Oxidative stress is pretty high in hepatic steatosis mediated by fat accumulation inside hepatocytes and been associated with hepatic insulin resistance. GGT is a cell-surface enzyme which primarily maintains intracellular defense against oxidative stress. So GGT is often found to be chronically elevated in NAFLD. Increased GGT level not only reflects the hepatic oxidative stress but also its association with insulin resistance. In studies of Koushik GG, Sharm S et al. (2009), it was concluded there is a significant positive correlation between GGT and Insulin resistance among all the liver enzymes, and monitoring GGT and fasting insulin levels might help to prevent the development of diabetes in obese children30. In a few previous studies elevated GGT level has been reported to be of prognostic significance of coronary artery disease which is an important complication of long-standing NAFLD. A positive correlation between elevated GGT level and Framingham cardiovascular risk scoring system has also been observed.Tara M. WallaceKristina M. Utzschneide et al also found in their study, that GGT was positively correlated with hepatic steatosis and associated with insulin sensitivity and glucose tolerance in both men and women. They also concluded that although GGT has been widely used as a specific biomarker of alcoholic liver disease, it has recently been found to be related to an increased risk of development of type 2diabetes,  irrespective of alcohol intake as well as an increased risk of hypertension and cardiovascular mortality31.

Conclusion

Not only a good positive correlation found between Liver enzymes ALT and GGT with hepatic steatosis but also an interesting finding was established that subjects having higher GGT values rather than ALT possessa greater risk of developing steatohepatic changes in insulin-resistant background. Such observations add an extra edge to the pathophysiological understanding of NAFLD.

Although GGT has been widely used as a marker of severity of alcoholic liver disease, the present study observes that it has a potential to be used as a novel marker for assessing the severity of NAFLD in context with the insulin-resistant condition. On the other-hand, these observations also raise a question that can GGT be considered as the specific marker only for Alcoholic liver disease or it should be generalized as a marker for assessing the severity of fatty liver disease irrespective of the etiopathogenesis.

Considering the present study as a pilot one, further studies can be done on the general population to establish ranges and changes in GGT levels in fatty liver diseases of different etiologies and correlating them with previous observations. Moreover, studies can also be conducted in favor of GGT as a marker for monitoring the risks of cardiovascular, cerebrovascular, and severe hepatic complications in patients of NAFLD along with Insulin Resistance.

Acknowledgement

We take the opportunity to express our sincere gratitude to Dr. Asit Chandra Roy, Associate Professor, Department of Radio-diagnosis, North Bengal Medical College & Hospitalfor his advice and assistance in the radiological data. We also extend our extreme gratefulness to all the medicos who volunteered themselves for our study. This study would not have been possible without their kind co-operations.

Financial Support and Sponsorhip

There are no Financial support

Conflict of Interest

Authors declare there is no conflict of interest

References

  1. Paschos P, Paletas K. Nonalcoholic fatty liver disease and metabolic syndrome. Hippokratia. 2009;13(1):9.
  2. Bugianesi E, Leone N, Vanni E, Marchesini G, Brunello F, Carucci P, Musso A, De Paolis P, Capussotti L, Salizzoni M, Rizzetto M. Expanding the natural history of nonalcoholic steatohepatitis: from cryptogenic cirrhosis to hepatocellular carcinoma. Gastroenterology. 2002;123(1):134-40.
    CrossRef
  3. Adams LA, Lymp JF, Sauver JS, Sanderson SO, Lindor KD, Feldstein A, Angulo P. The natural history of nonalcoholic fatty liver disease: a population-based cohort study. Gastroenterology. 2005;129(1):113-21.
    CrossRef
  4. Bedogni G, Miglioli L, Masutti F, Tiribelli C, Marchesini G, Bellentani S. Prevalence of and risk factors for nonalcoholic fatty liver disease: the Dionysos nutrition and liver study. Hepatology. 2005;42(1):44-52.
    CrossRef
  5. Singh SP, Singh A, Misra D, Misra B, Pati GK, Panigrahi MK, Kar SK, Bhuyan P, Pattnaik K, Meher C, Agrawal O. Risk factors associated with non-alcoholic fatty liver disease in Indians: a case–control study. Journal of clinical and experimental hepatology. 2015;5(4):295-302.
    CrossRef
  6. Singh SP, Nayak S, Swain M, Rout N, Mallik RN, Agrawal O, Meher C, Rao M. Prevalence of nonalcoholic fatty liver disease in coastal eastern India: a preliminary ultrasonographic survey. Tropical gastroenterology: official journal of the Digestive Diseases Foundation. 2004;25(2):76-9.
  7. Madan K, Batra Y, Gupta SD, Chander B, AnandRajan KD, Tewatia MS, Panda SK, Acharya SK. Non-alcoholic fatty liver disease may not be a severe disease at presentation among Asian Indians. World journal of gastroenterology. 2006;12(21):3400.
    CrossRef
  8. Day CP. james OF. Steatohepatitis: a tale of two “hits. 1998; 842-5.
    CrossRef
  9. Bajaj S, Nigam P, Luthra A, Pandey RM, Kondal D, Bhatt SP, Wasir JS, Misra A. A case-control study on insulin resistance, metabolic co-variates & prediction score in non-alcoholic fatty liver disease. Indian Journal of Medical Research. 2009;129(3):285.
  10. Sanyal AJ, Campbell–Sargent C, Mirshahi F, Rizzo WB, Contos MJ, Sterling RK, Luketic VA, Shiffman ML, Clore JN. Nonalcoholic steatohepatitis: association of insulin resistance and mitochondrial abnormalities. Gastroenterology. 2001;120(5):1183-92
    CrossRef
  11. Patell R, Dosi R, Joshi H, Sheth S, Shah P, Jasdanwala S. Non-alcoholic fatty liver disease (NAFLD) in obesity. Journal of clinical and diagnostic research: JCDR. 2014;8(1):62.
    CrossRef
  12. Kabir IM, Alam M, Mahmuduzzaman M, Al Mamoon A, Ahmed MU, Safwath SA. Correlation between bright echogenic liver, elevated liver enzymes and liver histology. Journal of Dhaka National Medical College & Hospital. 2011;17(1):8-13.
    CrossRef
  13. Haring R, Wallaschofski H, Nauck M, Dörr M, Baumeister SE, Völzke H. Ultrasonographic hepatic steatosis increases prediction of mortality risk from elevated serum gamma‐glutamyltranspeptidase levels. Hepatology. 2009;50(5):1403-11.
    CrossRef
  14. Ghouri N, Preiss D, Sattar N. Liver enzymes, nonalcoholic fatty liver disease, and incident cardiovascular disease: a narrative review and clinical perspective of prospective data. Hepatology. 2010;52(3):1156-61.
    CrossRef
  15. Hsieh MH, Ho CK, Hou NJ, Hsieh MY, Lin WY, Yang JF, Chiu CC, Huang JF, Chang NC, Wang CL, Dai CY. Abnormal liver function test results are related to metabolic syndrome and BMI in Taiwanese adults without chronic hepatitis B or C. International journal of obesity. 2009;33(11):1309.
    CrossRef
  16. Burtis CA, Ashwood ER, Bruns DE. Tietz textbook of clinical chemistry and molecular diagnostics-e-book. Elsevier Health Sciences; 2012.
  17. Kaushik GG, Sharm S, Sharma R, Mittal P. Association between gamma glutamyl transferase and insulin resistance markers in healthy obese children. J Assoc Physicians India. 2009;57;695-8.
  18. Campos SP, Baumann H. Insulin is a prominent modulator of the cytokine-stimulated expression of acute-phase plasma protein genes. Molecular and cellular biology. 1992;12(4):1789-97.
    CrossRef
  19. Sivapackianathan R, Asivatham AJ, Al-Mahtab M, Chowdhury TA. Association between non-alcoholic fatty liver disease and metabolic syndrome. International Journal of Hepatology. 2010;1(4):17-24.
  20. Bae JC, Suh S, Park SE, Rhee EJ, Park CY, Oh KW, Park SW, Kim SW, Hur KY, Kim JH, Lee MS. Regular exercise is associated with a reduction in the risk of NAFLD and decreased liver enzymes in individuals with NAFLD independent of obesity in Korean adults. PloS one. 2012;7(10)e46819.
    CrossRef
  21. Angulo P, Keach JC, Batts KP, Lindor KD. Independent predictors of liver fibrosis in patients with nonalcoholic steatohepatitis. Hepatology. 1999;30(6):1356-62.
    CrossRef
  22. Yoneda M, Mawatari H, Fujita K, Iida H, Yonemitsu K, Kato S, Takahashi H, Kirikoshi H, Inamori M, Nozaki Y, Abe Y. High-sensitivity C-reactive protein is an independent clinical feature of nonalcoholic steatohepatitis (NASH) and also of the severity of fibrosis in NASH. Journal of gastroenterology. 2007;42(7):573-82.
    CrossRef
  23. Day C. Non-alcoholic steatohepatitis (NASH): where are we now and where are we going?Gut 2002; 50: 585-88.
    CrossRef
  24. Abel ED, O’Shea KM, Ramasamy R. Insulin resistance: metabolic mechanisms and consequences in the heart. Arteriosclerosis, thrombosis, and vascular biology. 2012;32(9):2068-76.
    CrossRef
  25. Ludwig J, Viggiano TR, Mcgill DB, Oh BJ. Nonalcoholic steatohepatitis: Mayo Clinic experiences with a hitherto unnamed disease. Mayo Clinic Proceedings 1980; (Vol. 55, No. 7, pp. 434-438).
  26. Akila S, Deepti R, Ramesh L, Saritha B. The impact of increased serum GGT levels and NAFLD on the components of Metabolic Syndrome. Journal of current trends in clinical medicine & laboratory Biochemistry. 2014;2(4):34-38.
  27. Wieckowska A, Feldstein AE. Diagnosis of nonalcoholic fatty liver disease: invasive versus noninvasive. InSeminars in liver disease 2008; (Vol. 28, No. 04, pp. 386-395).
    CrossRef
  28. Mofrad P, Contos MJ, Haque M, Sargeant C, Fisher RA, Luketic VA, Sterling RK, Shiffman ML, Stravitz RT, Sanyal AJ. Clinical and histologic spectrum of nonalcoholic fatty liver disease associated with normal ALT values. Hepatology. 2003;37(6):1286-92.
    CrossRef
  29. Perera S, Lohsoonthorn V, Jiamjarasrangsi W, Lertmaharit S, Williams MA. Association between elevated liver enzymes and metabolic syndrome among Thai adults. Diabetes & Metabolic Syndrome: Clinical Research & Reviews. 2008;2(3):171-8.
    CrossRef
  30. Kaushik GG, Sharm S, Sharma R, Mittal P. Association between gamma glutamyl transferase and insulin resistance markers in healthy obese children. J Assoc Physicians India. 2009;57;695-8.
  31. Wallace TM, Utzschneider KM, Tong J, Carr DB, Zraika S, Bankson DD, Knopp RH, Kahn SE. Relationship of liver enzymes to insulin sensitivity and intra-abdominal fat. Diabetes care. 2007;30(10):2673-8.
    CrossRef


Viewing all 1376 articles
Browse latest View live