Introduction
Molecular analysis of a plant’s response to extreme salt stress conditions paved the way for the improvement of agricultural productivity worldwide (Wang et al., 2009; Sailaja et al., 2014; Cao et al., 2018). Next-generation sequencing (NGS) technology using RNA-Seq promotes the study of organism transcriptomes, including transcriptomes of Jojoba(Simmondsia chinensis) (link) Schneider, an organism for which genome sequencing data is scarce (Martin and Wang, 2011; Garber, 2011; Jain, 2012; Nejat et al., 2018). Understanding thephysiological, biochemical, and molecular dynamics of salinity tolerance can help in the development of new genotypes with enhanced salinity tolerance via molecular breeding and plant genetic transformation (Bafeelet al., 2016). Salt stress is one of the abiotic stresses challenging or burdening cultivated plants (Liang et al., 2018). Jojoba is a candidate plant for biodiesel production and is also identified as a potential candidate for several other applications, including medicinal projects, cosmetics, and personal care formulations (Passerini and Lombardo, 2000; Al-Obaidi et al., 2017). Unfortunately, there is a paucity of reports investigating the mechanisms by which this important plant species tolerates abiotic stresses. Such mechanisms and responses to salt stress were previously studied via RNA-Seq in other plant species, including Rhazya stricta (Hajrah et al., 2017), Arabidopsis (Kawa and Testerink, 2017), barley, and rice (Ueda et al., 2006).
Abiotic stresses, including salinity, drought, and heavy metals, are major barriers that adversely impact plant growth, development, and productivity (Mittler, 2006;Assahaet al., 2016; Wangsawanget al., 2018). Under such conditions, reactive oxygen species (ROS) accumulate, thereby resulting in the manifestation of a secondary stress termed oxidative stress (Assahaet al., 2017a,b;Abdelaziz et al., 2018; Yassin et al., 2019). Recent reports indicate that the overproduction of ROS is extremely toxic, leading to the oxidation of biomolecules with different chemical structures, such as lipids, proteins, and nucleic acids. Oxidative stress results in peroxidation of lipids, membrane injury, and inactivation of enzymes. The consequence of these reactions impacts various processes, such as membrane transport mechanisms and metabolic pathways (Zhang et al., 2007). Major defensive mechanisms to mitigate the deleterious effects of ROS in plants include the production of ROS-detoxifying enzymes, such as superoxide dismutase (SOD), and the production of antioxidants with a low molecular mass, such as metallothioneins (MTs) (Mittler, 2002; Jinet al., 2010; 2017).
The present study seeks to investigate the expression patterns of salt-related genes in the leaf transcriptome of jojoba to enhance understanding of the molecular mechanisms underlying salt stress tolerance in this plant species.
Materials and Methods
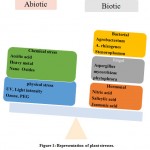
Salt Stress Experiment
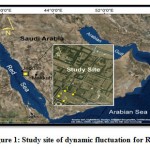
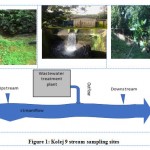
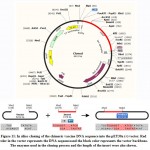
A salt stress experiment was conducted at the laboratories of the Department of Biological Sciences, King Abdulaziz University, Jeddah, Saudi Arabia. jojoba seeds were grown in pots (9 cm, 3 seeds/pot) filled with a soil mix (1 soil: 1 vermiculite) and watered with deionized double distilled water under standard growth conditions. Specifically, they were grown at 21 ± 2°C (day/night), with a light intensity of approximately175 µmoles m-2sec-1, and a 16 h-light/8 h-dark cycle. The description of the experiment is detailed in Figure 1. Generated seedlings were watered with distilled water until day 19, then plantlets were morphologically screened for homozygosity and the number of plantlets per pot was narrowed from three to one as previously described (Bahieldin et al., 2015). The pots were divided into two groups. The first group continued to be irrigated every five days with deionized double distilled water (control), while the second group was exposed to salt stress. The plantlets were irrigated three times at intervals of five days. Salt stressed plantlets were first irrigated with 50 mM NaCl (on day 24), followed by 50mM NaCl (on day 29), and 100 mM NaCl (on day 34).Incremental increases in salt stress were applied as recommended by Munns (2002). Leaf samples from the control and salt-stressed plantlets were harvested on the second day of salt treatments. For example, on days 25, 30 and 35, respectively, where salt concentrations reached 50, 100, and 200 mM NaCl, respectively.
![Vol18No1_Mol_Bud_fig1]() |
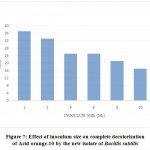
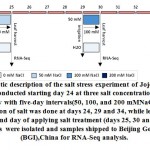
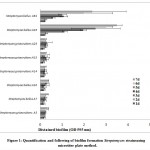
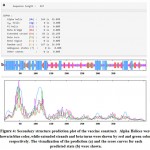
Figure 1: Schematic description of the salt stress experiment of Jojoba (Simmondsia chinensis) conducted starting day 24 at three salt concentrations increased incrementally with five-day intervals(50, 100, and 200 mMNaCl) in Jojoba plant.
Click here to view figure |
Application of salt was done at days 24, 29 and 34, while leaf samples were harvested the second day of applying salt treatment (days 25, 30 and 35, respectively) and total RNAs were isolated and samples shipped to Beijing Genome Institute (BGI),China for RNA-Seq analysis.
RNA-Seq analysis
Total RNA was extracted from three similar-sized (10 mm2) flash-frozen plantlets. Subsequently, the leaf material (approximately 50 mg tissue) was crushed using Trizol (Invitrogen) and then treated with RNase-free DNase (Promega Inc.) to remove contaminating DNA. The yield and quality of RNA were determined using a Nanodrop-8000 spectrophotometer (Thermo Scientific, Wilmington, DE, USA). 30 µg (400 ng/µl) of the extracted RNA was then shipped to the Beijing Genome Institute (BGI), China, for deep sequencing using an Illumina MiSeq. The raw read data on thejojobaleaves were provided in FASTQ format. The reads were submitted to the National Center for Biotechnology Information (NCBI) for reviewing and allocating accession numbers. Next, the raw transcriptomic data was filtered and trimmed to remove the adaptor and primer sequences. Reads of less than 40 bp were removed using Trimmomatic v0.30 (Bolger et al., 2014), and sequencing data with a Phred quality score ofQ≥20 was used in the assembly. Generated read counts were used to detect differential expression via EdgeR (version 3.0.0, R version 2.1.5). Approximately 5 million reads per sample were recovered using RNA-Seq, and de novo assembly was performed using the Trinity RNA-Seq Assembly package (r2013-02-25) with optimized parameters and a K-mer size set to 25 (Zhang et al., 2015). Validation of assembled transcript contigs was performed using the CLC Genomics workbench (CLC Bio, Boston, MA 02108 USA). All high-quality reads were subsequently mapped back to the assembled transcript contigs. Coding DNA sequences (CDSs) from the assembled transcript contigs were identified using the online tool ORF-Predictor (Min et al. 2005) (http://proteomics. ysu.edu/ tools/ OrfPredictor. html) using the default parameters. Blastx was then performed (with an E-value cut off of 1e-5) and the fold change values of differentially expressed transcripts were measured via EdgeR (version 3.0.0, R version 2.1.5) and by usingactin as the housekeeping gene. Significant Pearson correlation was determined during permutation analysis. Assembled transcripts in different clusters were annotated, and gene ontology (GO) terms were detected using Blast2GO (http://www.blast2go.org/). Next, the CDSs were categorized by WEGO analysis, which involved sketching a WEGO plot based on the GO hits. To retrieve GO terms for the annotated CDS, the GO mapping used the following parameters: (i) Blastx result accession IDs to retrieve gene names or symbols, (ii) UniProt IDs, and (iii) a direct search of the dbxref table of the GO database. UniProt IDs were retrieved using the Protein Information Resource (PIR). PIR includes the protein sequence database (PSD), UniProt, SwissProt, TrEMBL, RefSeq, GenPept, and PDB databases. Accordingly, all predicted CDSs were annotated against the protein database to help assign the putative function of the unmapped transcriptome following its translation into protein.
Validation of RNA-Seq data
RNA-Seq datasets of jojoba were validated using qRT-PCR of four randomly selected genes that were highly upregulated (≥5-fold change or FC)at the three time points (days 25, 30, and 35). Expression levels of the transcripts were detected by real-time PCR using the Agilent Mx3000P qPCR Systems (Agilent Technology, USA). The MaximaTM SYBR Green/ROX qPCR procedure was performed as detailed in Bahieldin et al. (2015). First-strand cDNA was synthesized using reverse primers of each gene, and all synthesized cDNA was amplified using the forward and reverse primers of different genes listed in Table S1. Data were collected and amplification plots of DRn versus the cycle number were generated for analysis. The actin gene (Table S1) was used as the housekeeping gene. The data for the housekeeping gene was used in the established calculations to detect the expression level of each gene.
Results
Data Statistics and Quality
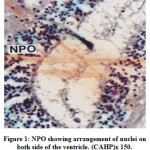
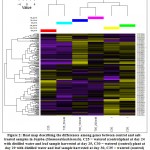
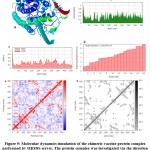
The results of the jojoba RNA-Seq data indicate that over 500 transcripts were detected, of which the number of differentially expressed (DE) transcripts were 164 (Table 1). However, the number of highly DE (≥5 FC) transcripts was 156 (Table S2). Hierarchical cluster analysis of gene expression of jojobausing the Pearson correlation as the distance metric based on the log ratio RPKM data and a multi-dimensional scaling plot showed a close relationship for transcriptomes at day 25 regardless of salt stress (50 mM NaCl) (Figure 2). This indicates that this concentration induced a few salt-related genes. The heat map also indicated no significant DE transcripts between days 30 and 35 under salt stress (100 and 200 mM NaCl, respectively), on the one hand, or alternatively, between the same two days under control conditions. Accordingly, these findings indicate that neither prolonged exposure to salt stress beyond six days (day 30) nor use of salt concentrations higher than 100 mM NaCl can result in more DE transcripts. The RNA-Seq datasets were validated by performing qRT-PCR on two randomly selected highly (≥5 FC) upregulated transcripts (cluster 12) and two downregulated (cluster 19) transcripts under salt stress conditions. Theoutcomes of this analysis perfectly aligned with those of the RNA-Seq data for the transcripts used in the validation (Figure S2).
![Vol18No1_Mol_Bud_fig2]() |
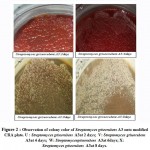
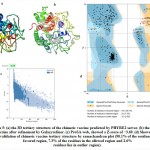
Figure 2: Heat map describing the differences among genes between control and salt-treated samples in Jojoba (Simmondsia chinensis).
Click here to view figure |
C25 = watered (control)plant at day 24 with distilled water and leaf sample harvested at day 25, C30 = watered (control) plant at day 29 with distilled water and leaf sample harvested at day 30, C35 = watered (control) plant at day 34 with distilled water and leaf sample harvested at day 35, T25_50mM = treated plant at day 24 with 50mM salt and leaf sample harvested at day 25, T30_100mM = treated plant at day 29 with 100mM salt and leaf sample harvested at day 30, T35_200mM = treated day 34 watered with 200mM salt and leaf sample harvested at day 35.
GO classification
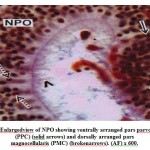
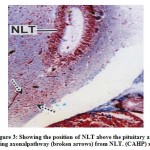
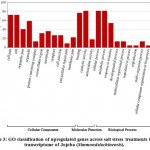
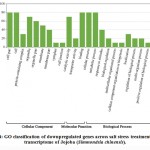
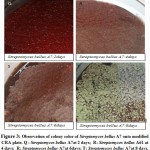
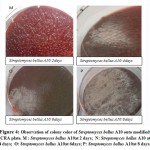
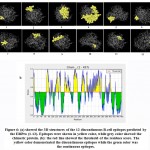
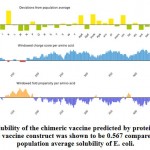
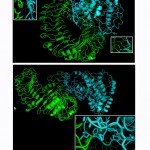
Some of the annotated jojobatranscripts were not assigned to any of the three main categories of gene expression,of which 37 were upregulated and 42 were downregulated genes (Table 1). However, the numbers of upregulated genes assigned to the three main categories, namely, “biological process”, “cellular component” and “molecular function”, were as little as 10, 8, and 9, respectively (Table 1). The numbers of downregulated genes assigned to the three main categories were 20, 18, and 20, respectively (Table 1). In the three categories, highly expressed genes under salt stress were found in the subcategories of “cell part”, “cell”, “organelle part”, and “organelle” for the “cellular component” category, and the subcategories “binding” and “catalytic activity” for the “molecular function” category. The subcategories of “cellular process”, “metabolic process” and “response to stimulus” were established for the “biological process” category (Figure 3). In contrast, highly suppressed genes under salt stress were found in the subcategories of “cell part”, “cell”, “organelle part”, “organelle” and “membrane” for the “cellular component” category, and the subcategories of “binding”, and “catalytic activity” for the “molecular function” category.While the “cellular process”, “metabolic process” and “response to stimulus” subcategories were noted for the “biological process” category (Figure 4).
![Vol18No1_Mol_Bud_fig3]() |
Figure 3: GO classification of upregulated genes across salt stress treatments in the transcriptome of Jojoba (Simmondsia chinensis).
Click here to view figure |
![Vol18No1_Mol_Bud_fig4]() |
Figure 4: GO classification of downpregulated genes across salt stress treatments in the transcriptome of Jojoba (Simmondsia chinensis).
Click here to view figure |
Table 1: Number of differentially expressed genes of Jojoba (Simmondsia chinensis)across the three GO categories due to salt stress.
| Expression |
upregulated |
downregulated |
Total |
| Annotated genes |
37 |
42 |
79 |
| GO Terms |
Biological process |
10 |
20 |
30 |
| Cellular component |
8 |
18 |
26 |
| Molecular function |
9 |
20 |
29 |
| Total |
69 |
95 |
164 |
Cluster analysis
Cluster analysis indicated the occurrence of 26 clusters, of which only two clusters refer to downregulation with nine (cluster 3), six (cluster 19) and one (cluster 20) transcripts (Figure S1 and Table S2). The results of cluster analysis barely indicate a significant increase in the expression levels of transcripts at 200 mM NaCl compared with those at 100 mM NaCl. As little as three out of the 26 clusters were downregulated, and most of the other clusters showed upregulation in one or more time points (days 25, 30, and 35) of salt stress. The three clusters with downregulated genes include numbers of 10 (cluster 6), two (cluster 8), and two (cluster 13) transcripts, of which either one of the two transcripts in cluster 8 or cluster 13 refers to the transcripts of the same gene. For example, glutathione S-transferase (for cluster 8) and GDSL esterase/lipase (for cluster 13). These results support our previous claim that prolonged exposure to salt stress does not necessarily result in higher expression levels of salt-related genes. These results confirm that this plant species moderately tolerates salt stress.Thus, it harbors a high number of genes expressed under moderate levels of salt stress and a low number of genes expressed specifically under high levels of salt stress (for example 200 mM NaCl).
As previously indicated, 26 clusters harboring 156 transcripts were detected following analysis of the read data (Table S2). Among this set, six clusters (nos. 4, 5, 12, 15, 16, and 21) were selected for further analysis (Table 2). Criteria for selecting clusters were based on the annotation data and the feasibility of gene expression patterns. Clusters 4 and 16 indicate upregulation of transcripts under 100 and 200 mM NaCl at days 30 and 35, respectively.Clusters 5 and 15 indicate upregulation under 100 mM NaCl at day 30, and clusters 12 and 21 indicate upregulation under 50, 100 and 200 mM NaCl at each of the three time points (days 25, 30 and 35), respectively(Figure S1). Accordingly, the genes in clusters 5 and 15 seemed necessary for a short time under salt stress, while those in the other four clusters were indicated as necessary for a longer period or until the stress conditions had ended. The total number of transcripts selected in the six clusters (nos. 4, 5, 12, 15, 16, and 21) was 15 (Table 2). These transcripts refer to 13 genes, as three transcripts were detected in cluster 5 for only one gene encoding metallothionein-like protein type 3. The number of transcripts studied in these clusters were three, four, four, two, one, and one, respectively. A description of these transcripts is detailed in Tables 2 and S2, while the expression patterns of these transcripts are illustrated in Figures 5-10, respectively.
Table 2: List of regulated salt-related gene-encoded proteinsof Jojoba (Simmondsia chinensis)and gene codes.
| Cluster |
Protein encoded |
Gene code |
| Cluster 4 |
Miraculin |
G1 |
| Protein ROS1A |
G2 |
| Germin-like protein subfamily 3 member 3 |
G3 |
| Cluster 5 |
Metallothionein-like protein type 3 isoform1 |
G4 |
| Metallothionein-like protein type 3 isoform 7 |
G5 |
| Ankyrin repeat domain-containing protein 2B |
G6 |
| Metallothionein-like protein type 3 isoform 21 |
G7 |
| Cluster 12 |
Gibberellin-regulated protein 2 |
G8 |
| Sucrose-phosphate synthase |
G9 |
| 1-aminocyclopropane-1-carboxylate oxidase homolog 1 |
G10 |
| Callose synthase 3 |
G11 |
| Cluster 15 |
Cysteine proteinase inhibitor 12 |
G12 |
| ubiquitin-conjugating enzyme E2 24 |
G13 |
| Cluster 16 |
xyloglucan endotransglucosylase/hydrolase protein 7 |
G14 |
| Cluster 21 |
BURP domain protein RD22 |
G15 |
Discussion
Differentially expressed genes in jojobaunder salt stress were upregulated in six clusters. The roles of a set of these genes in conferring salt stress tolerance are discussed below:
Miraculin and cysteine proteinase inhibitor 12
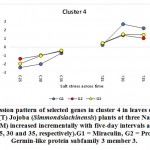
The miraculin-encoding gene is upregulated in the present study under 100 and 200 mM NaCl on days 30 and 35, while the cysteine proteinase inhibitor 12-encoding gene is upregulated under 100 mM NaCl only on day 30 (Figures 5 and 8, respectively). Miraculin was discovered in the red berries of the miracle fruit (Richadelladulcifica) as a taste modifier that can change sour tastes to sweet (Masuda et al., 1995). Under salt stress, the gene encoding this protein was highly expressed in tomatoes and, essentially, this was a consequence of fruit miniaturization (Hirai et al., 2011). Moreover, this increase resulted in anelevationin the level of the encoded protein and the content of all other soluble proteins. Although the functions of miraculin proteins under salt stress remains unclear, this protein was proposed to play a defensive role against biotic and abiotic stresses by limiting cell damage (Tsukudaet al., 2006). The latter process might be explained by this protein’s high degree of amino acid sequence homology and that of the Kunitz family of proteinase inhibitors. Studies have reported that proteinase inhibitors, such as cysteine proteinase inhibitor 12, are generally involved in hypersensitive cell death execution in tobacco leaves (Montilletet al., 2005; Xu et al., 2012). The latter action leads to the regulation of ROS production, thereby leading to the production of a strong antioxidant defense system (Grant and Loake, 2000; Zhang et al., 2010). Dombrowski (2003) indicated that salt stress-induced accumulation of proteinase inhibitors in tomato plants was jasmonic acid-dependent. Interestingly, the higher the expression of the gene encoding miraculin in citrus, the higher the level of tolerance to salt stress (Mouhayaet al., 2010).
Protein ROS1A
The gene encoding the REPRESSOR OF SILENCING protein (ROS1A) was shown to be upregulated in jojobaleaves under salt stress (100 and 200 mM NaCl) (Figure 5). ROS1A was reported to participate in the demethylation of vegetative cells in plants, rice (Ono et al., 2012; Lanciano and Mirouze 2017; Kim et al., 2019b; Parrilla-Doblaset al., 2019).The plant methylation/demethylation process is involved in many physiological processes, including seed development and germination, fruit ripening and plant responses to biotic and abiotic stresses (Parrilla-Doblaset al., 2019). Environmental stresses are known to impact genome stability and epigenetic mechanisms. Moreover, DNA methylation was reported to be involved in both adaptation and agronomic performances (Kim et al., 2019b). In rice, active DNA demethylation has been proven to assist in salt tolerance and responses to salt stress. Salt-tolerant rice showed decreased DNA methylation levels following exposure to salt stress. Accordingly, reduced levels of DNA methylationareconsidered to be an adaptive mechanism to salt stress. Furthermore, a recent study also proposed that DNA demethylation during environmental stresses is involved in the intergenerational transmission of a “stress memory”. It is believed that the process of intergenerational transmission facilitates rapid adaptation to short-term environmental fluctuations, a phenomenon known as ‘priming’ (Serrano et al., 2019). Thus, this memory is remembered upon subsequent exposure to the same stress. Stress memory is thought to resemble the “memory cell” in our immune system that allows our bodies to remember the pathogen, thereby enabling the launching of a more rapid response. Through studies on Arabidopsis, researchers established that stress memory in plants exposed to salt stress is associated with changes in DNA methylation and that this memory was transmitted to subsequent generations (Wibowo et al., 2016). Interestingly, salt stress tolerance and changes in DNA methylation levels are preferentially transmitted through the female germline. Active DNA demethylation is also involved in the plant response to abscisic acid (ABA). The latter phytohormone accumulates as a result of biotic and abiotic stresses. ABA is known to play a crucial role in coordinating cascades of signal transduction during abiotic stresses (Parrilla-Doblaset al., 2019). Thus, ArabidopsisROS1 mutants are hypersensitive to ABA during early seedling development (Kim et al., 2019a). Moreover, ROS1 is required to demethylate and activate a subset of ABA-inducible genes (Kim et al., 2019a).Generally speaking, a better understanding of epigenetic regulations in plants is required to enhance understanding of how demethylation governed by genes encoding ROS1 contributes to improving plant adaptation to a changing environment.
Germin-like protein subfamily 3 member 3
The gene encoding germin-like protein subfamily 3 member 3(GLP3) was shown to be upregulated in jojobaleaves under salt stress (100 and 200 mM NaCl) (Figure 5). Members of the germin-like proteins (GLPs)contribute to the defense mechanisms launched following a pathogenic attack. Moreover, they can produce proteins with superoxide dismutase (SOD) activity in cereals and soybeans, among others (Schweizer et al. 1999; Christensen et al. 2004; Godfrey et al. 2007; Davidson et al. 2009, Lu et al., 2010a). Under normal conditions, plants express the natural formation/removal process of O2. Under stress conditions, the defense system is accompanied by increased ROS formation and is eventually overwhelmed. Nevertheless, SOD is considered to be the first line of defense against ROS (Davidson et al., 2010). In the sunflower (Helianthus annuus), GLPs were reported to prevent oxidative damage due to salt stress in plantsthrough the pathways of protein oxidation and lipid peroxidation (Davenport et al., 2003).
![Vol18No1_Mol_Bud_fig5]() |
Figure 5: Expression pattern of selected genes in cluster 4 in leaves of non-salinized (C) and salinized (T) Jojoba (Simmondsia chinensis) plants at three NaCl concentrations (50, 100 and 200 mM) increased incrementally with five-day intervals and harvested at the second day (days 25, 30 and 35, respectively).G1 = Miraculin, G2 = Protein ROS1A, G3 = Germin-like protein subfamily 3 member 3.
Click here to view figure |
Metallothionein-like protein type 3
Metallothioneins (MTs) are proteins that contribute to metal chelation in plants. In the metal-thiolate cluster, MTs bind to metal ions and detoxify them, thus resulting in the buffering of the cytosolic metal concentration (Mekawyet al., 2020). Several studies have reported the positive effects of MTs on plants subjected to various abiotic stresses (Lee et al., 2004; Jinet al., 2017; Patankaret al., 2019). The MT family of proteins is a low molecular weight (7–10 kDa), cysteine- (Cys)-rich metal-chelating protein. The family comprises four types: MT1, MT2, MT3, and MT4 (Cobbett and Goldsbrough, 2002). The four types differ by the arrangement of their preserved cysteine residue. Moreover, their tissue-specific expression demonstrates the differences in their functions (Freisinger, 2011; Leszczyszyn et al., 2013). In the present study, the upregulation of three MT transcripts under salt stress (50, 100, and 200 mM NaCl) proves that three typesof MTsare expressed in the leaves of jojobaand that they likely promote the plant’s ability to tolerate salt stress (Figure 6). A recent study indicated that the overproduction of MTs resulted in an increased activity of antioxidant enzymes, such as catalase and ascorbate peroxidase (Mekawyet al., 2020). Thus, MTs act as potential antioxidants that reduce cellular injury due to ROS overproduction (Chiaverini and De Ley, 2010). Specifically, the thio group (–SH) of the MT’s cysteine residues acts to eliminate the overproduced ROS, thereby reducing the cellular level of ROS to the required level and maintainingthecell’s equilibrium (Hassinen, et al., 2011). Earlier reports indicate that MTs can promote homeostasis,the tolerance of metal ions (Cobbett and Goldsbrough, 2002; Zimeriet al., 2005), and oxidative stress mitigation (Akashi et al. 2004).
Ankyrin Repeat Domain-Containing Protein 2B
Gene encoding ankyrin (ANK) repeat domain-containing protein 2B was shown to be upregulated in jojobaleaves under salt stress (50, 100, and 200 mM NaCl) (Figure 6). ANK is a repeat domainand is one of the most commonly conserved protein domains in all organisms (Sedgwick and Smerdon, 1999; Lopez-Ortiz et al., 2020). Study findings have reported ANKrepeats as mediators of protein–protein interactions (Michaely and Bennett, 1992; Li et al., 2006). Furthermore, they highlighted their function as molecular chaperones that work to maintain other protein structures under abiotic stresses (Chen et al., 2002).ANK domain-containing proteins are frequently found participating in crucial physiological and developmental processes such as signaling (Yuan et al., 2013), chloroplast biogenesis (Bae et al., 2008), and leaf morphogenesis (Ha et al., 2004). These studies supported earlier reports that indicated how ANK repeat-containing proteins are involved in diverse cellular functions, including cell cycle regulation, signal transduction, and ion transport (Sedgwick and Smerdon, 1999; Yan et al., 2002).Additionally, the ANK repeat-containing proteins play important roles in the cell’s response to both biotic and abiotic stresses (Zhanget al., 2016). Other reports indicated the role of these proteins indrought tolerance (Sakamoto et al., 2013) and ABA-mediated regulation of ROS levels under saltstress (Sakamoto et al., 2008).Nodzonet al. (2004) proved that the expression of certain ANK genes in plants is induced by auxin (IAA), abscisic acid (ABA), and jasmonic acid (SA), which mediate the responses to biotic and abiotic stresses. Other reports indicate that the promoter elements of ANK genes are also induced by gibberellic acid (GA) (Batlang, 2008) and ethylene (Seonget al., 2007). The proteins interacting with the ANK domain were predicted to exist in the membrane and in chloroplasts at the intracellular level.
![Vol18No1_Mol_Bud_fig6]() |
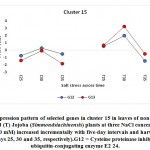
Figure 6: Expression pattern of selected genes in cluster 5 in leaves of non-salinized (C) and salinized (T) Jojoba (Simmondsia chinensis) plants at three NaCl concentrations (50, 100 and 200 mM) increased incrementally with five-day intervals and harvested at the second day (days 25, 30 and 35, respectively).
Click here to view figure |
G4 = Metallothionein-like protein type 3 isoform 1, G5 = Metallothionein-like protein type 3 isoform 7, G6 = Ankyrin repeat domain-containing protein 2B, G7 = Metallothionein-like protein type 3 isoform 21.
Gibberellin-regulated protein 2
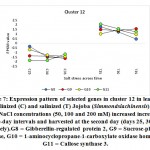
The gene encoding gibberellin-regulated protein 2 was shown to be upregulated in jojobaleaves under the three salt stress concentrations (50, 100, and 200 mM NaCl) (Figure 7). Gibberellin-regulated protein 2 is among the gibberellic acid-stimulated Arabidopsis protein family (GASAs). They areidentified as a class of cysteine-rich small peptides or CRPs (cysteine-rich peptides) (Silverstein et al., 2007). Numerous GASA genes have been isolated and identified from several plant species (Wigodaet al., 2006; Sun et al., 2013; Zhang and Wang, 2017). GASA proteins play an important role in the regulation of plant growth and development, including participation in the biotic and abiotic stress responses and in hormonal signal transduction (Wigodaet al., 2006; Zhang and Wang, 2008; Sun et al., 2013). One study reported the interaction of GASA proteins with other proteins in their regulation of plant hormone signal transduction (Zhang and Wang, 2017). For example, GASA5 in Arabidopsis participates in the heat stress response by regulating SA signaling toward the accumulation of heat shock protein (Zhang and Wang, 2008). Additionally, GASA4 over-expression was proven to inhibit ROS accumulation, thereby contributing to the antioxidant process and promoting tolerance to high salt stress (Zhang and Wang, 2017). The latter conclusion was supported by the loss-of-function mutant gasa14,which resulted in sensitivity to high salt stress in Arabidopsis.
Sucrose-Phosphate Synthase
Gene encoding sucrose-phosphate synthase (SPS) was shown to be upregulated in jojobaleaves under the three salt stress concentrations (50, 100, and 200 mM NaCl) (Figure 7). The functions of sucrose-metabolizing enzymes provide an alternative avenue to the plant’s salt stress response (Lu et al., 2010b). Examples of these enzymes include sucrose synthase (SS), sucrose-phosphate synthase (SPS),and invertase (INV). SS plays a vital role in regulating the phloem loading process, while SPS catalyzes the synthesis of sucrose phosphate during the last step of CO2 fixation in plants (Azevedo-Neto et al., 2004).
Methyl jasmonate (MeJA) is identified as an important phytohormone that participates in diverse processes, including plant response to salinity and water stresses (Kang et al., 2005). MeJA triggers the reprogramming of gene expression to help plant cells adapt to environmental stresses such as drought, low temperature, and salinity (Wolucka and Goossens, 2005).Moreover, MeJA participates in alleviating the damage caused by salt stress through sucrose synthesis regulation and its metabolism, which contribute toward maintaining normal growth under such harsh conditions (Yu et al., 2019).One study reported that this hormone promoted thegene expression of the APS protein and that this appeared to constitute the rate-limiting step in sucrose synthesis, thus providing the greatest effect on the sucrose accumulation rate (Daiet al., 2020).
Interestingly, the activation of SPS appears to concurrently result in the elimination of the sucrose-degrading enzyme INV’s activity. Collectively, these responses result in a high rate of sucrose accumulation. Such effects are specific responses to salt stress and constitute a strategy for maintaining balanced sucrose content under stress conditions (Yu et al., 2019). Additionally, under conditions of salt stress, the osmotic balance between the cell’s interior and its exterior is achieved by the regulation of the accumulation rate of compatible solutes. Such regulation promotes the reduction of intracellular inorganic ions, and this decreased intracellular ion pool is responsible for the reduced levels of sucrose accumulation as a result of lowered SPS activity and increased INV activity(Kirsch et al., 2018).
1-aminocyclopropane-1-carboxylate oxidase
The gene encoding the enzyme 1-aminocyclopropane-1-carboxylate (ACC) oxidase was shown to be upregulated in jojobaleaves under the three salt stress concentrations (50, 100, and 200 mM NaCl) (Figure 7). ACC oxidase is an ethylene-forming enzyme that mediates the second step of the two-step reaction of ethylene biosynthesis,while ACC synthase mediates the first step (Kende, 1993; Steffens, 2014). A plant’s adaptation to abiotic and biotic stresses is regulated by small endogenous signaling molecules, of which the gaseous phytohormone ethylene and ROS play important roles in mediating responses to numerous aspects of growth or cell death (Kende, 1993; Li et al., 2014; Trinh et al., 2014).
Upregulation of the ACC oxidase transcripts has been found under high salt stress in Saccharum arundinaceumand Oryza brachyantha. Conversely, they have been reported to be down regulated in the homolog of Arabidopsis thaliana. One study explained these conflicting results by potentially attributing them to the differential perception of emitted ethylene under salt stress (Steffens, 2014). Downstream signaling cascades due to ethylene perception include the ion transporter EIN2 (Ethylene-insensitive protein 2), the transcription factor EIN3, and members of the APETALA2/Ethylene Response Factor (AP2/ERF) multi gene family (Chen et al., 2002). Generally, ethylene represents an internal signal that promotes the plants’ ability to coordinate other downstream signals and that acts as an adaptive survival response to salt stress (Wang et al., 2002). Ethylene signaling is also necessary for ROS accumulation inconditions of salt stress (Li et al., 2014). In addition to ethylene signaling, ethylene homeostasis is required for conferring salinity tolerance upon plants (Dong et al., 2011). Occasionally, a plant may die as a result of abiotic stresses, but such death may be prevented by the triggering of processes by ethylene and ROS (Dong et al., 2011).
Callose synthase 3
The gene encoding callose synthase (CalS) was found to be upregulated in jojobaleaves under the three salt stress concentrations (50, 100, and 200 mM NaCl) (Figure 7). Callose synthase (CalS) is an enzyme that regulates the accumulation of callose at theplasmodesmal channels and their subsequent disposition in the plasmodesmata (Cui and Lee, 2016). The processing of callose in this manner is commonly used to alter plasmodesmal permeability under biotic and abiotic stresses. Several callose synthase genes have been proven to be involved in this process in Arabidopsis. There are numerous cell communication strategies. However, molecular trafficking between adjacent cells through plasma membrane channels represents a potentially universal signaling mechanism (Abounit and Zurzolo, 2012; Gerdes et al., 2013; Lee, 2014). Plasmodesmata-mediated trafficking of nutrients among adjacent cells is critical for normal plant growth and development and for plant tolerance to abiotic stresses (Lucas et al., 2009; Benitez-Alfonso et al., 2011; Burch-Smith and Zambryski, 2012; Sevilemet al., 2013; Sager and Lee, 2014). The modulation of plasmodesmal permeability under stress occurs by hyper- or hypo-accumulation of a β-1,3 glucan termed callose, with the changes in callose levels often correlating negatively with the plasmodesmal permeability (Zavalievet al., 2011; De Storme and Geelen, 2014). The latter process is dependent on the callose synthase expression level or of the β-1,3-glucanase genes that are presumed to be implicated in plasmodesmal permeability (Vaténet al., 2011; Benitez-Alfonso et al., 2013). During this process, cellular signals are transduced to the molecular machinery that regulates plasmodesmal callose deposition, thus impacting the plasmodesmal permeability (Cui and Lee, 2016). Moreover, the accumulation of callose at the plasmodesmata by CalS is a key mechanism in regulating the molecular movement taking place between adjacent cells through the plasmodesmata. Recent reports connect specific abiotic and biotic signals to callose-dependent plasmodesmal regulation (De Storme and Geelen, 2014; Sager and Lee, 2014; Cui and Lee, 2016).
![Vol18No1_Mol_Bud_fig7]() |
Figure 7: Expression pattern of selected genes in cluster 12 in leaves of non-salinized (C) and salinized (T) Jojoba (Simmondsia chinensis) plants at three NaCl concentrations (50, 100 and 200 mM) increased incrementally with five-day intervals and harvested at the second day (days 25, 30 and 35, respectively).G8 = Gibberellin-regulated protein 2, G9 = Sucrose-phosphate synthase, G10 = 1-aminocyclopropane-1-carboxylate oxidase homolog 1, G11 = Callose synthase 3.
Click here to view figure |
Ubiquitin-Conjugating Enzyme E2 24
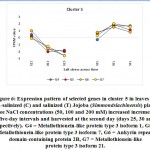
The gene encoding ubiquitin-conjugating enzyme E2 24 was shown to be upregulated in jojobaleaves under a salt stress concentration of 100 mM NaCl (Figure 8). The ubiquitin-conjugating enzyme E2 is found in the second step of ubiquitination. The first step involves the ubiquitin-activating enzyme E1, which catalyzes the activation of ubiquitin. In the second step, ubiquitin is transferred to the ubiquitin-conjugating enzyme (UBC) E2. The final ubiquitination step involves the ligation of ubiquitin to the protein substrate by the direct transfer of ubiquitin from E2 or from the protein ligase E3 (Chung et al., 2013). The ubiquitin/proteasome system represents the original pathway for selective protein degradation in plants (Kornitzer and Ciechanover, 2000). Protein degradationcontributes to the signal transduction pathways during plant responses to abiotic stresses (Hellmann and Estelle, 2002). Ubiquitination has important functions in numerous biological processes in plants, including light signaling, embryogenesis, leaf senescence, and plant stress tolerance (Chung et al., 2013).All forms of theubiquitin-conjugating enzyme E2 contain a conserved protein domain of approximately 16 kDa with a 150-amino-acid catalytic core termed theubiquitin-conjugating enzyme (UBC) domain (Sung et al., 1990). Upregulation of the gene encoding UBC E2 results in high expression levels of stress-responsive genes such as P5CS,which encodes the proline biosynthetic key enzyme (Zhou et al., 2010), and the genes encoding brassinosteroid-mediated signaling (Cui et al., 2012), the ion antiporter (NHX1 and CLCa), and the copper chaperone (superoxide dismutase gene) (Zhou et al., 2010). The activity of UBCE2 also results in a higher sensitivity to ABA and to the upstream ABA-responsive bZIP transcription factors (Chung et al., 2013).
![Vol18No1_Mol_Bud_fig8]() |
Figure 8: Expression pattern of selected genes in cluster 15 in leaves of non-salinized (C) and salinized (T) Jojoba (Simmondsia chinensis) plants at three NaCl concentrations (50, 100 and 200 mM) increased incrementally with five-day intervals and harvested at the cond day (days 25, 30 and 35, respectively). G12 = Cysteine proteinase inhibitor 12, G13 = ubiquitin-conjugating enzyme E2 24.
Click here to view figure |
Xyloglucan endotransglucosylase/hydrolase protein 7
The gene encoding xyloglucan endotransglucosylase/hydrolase (XTH) protein 7 was also found to be upregulated in jojobaleaves under two salt stress concentrations (100 and 200 mM NaCl) (Figure 9). Xyloglucan (XyG) is a hemicellulose polymer involved in the formation of the primary cell wall of plants (Yan et al., 2019). XyGbinds to cellulose microfibrils by hydrogen bonding during cell elongation, thus causing the loosening of the cell wall (Hayashi and Kaida, 2011; Park and Cosgrove, 2015; Pauly and Keegstra, 2016). Simultaneously, the gene encoding XTH acts to modulate the production of tracheary elements in leaves (Matsui et al., 2005) andcellulose deposition inplant roots (Liu et al., 2007). The gene is involved in plant salt tolerance and in a subset of physiological responses to counteract dehydration (Cho et al., 2006; Choi et al., 2011). Furthermore, XTH also participates in cell wall loosening to increase the walls’ flexibility and to enable its rapid remodeling when cells are subjected to abiotic stresses (Yan et al., 2019). It also strengthens the cell wall layers, thereby enhancing the protection of the mesophyll cells from salt stress. Overall, XTH governs the primary cell wall architecture by cleaving and rejoining the XyG chains to alter the size and shape of XyG, thereby acting as an adaptive response to salt and dehydration stresses (Park and Cosgrove, 2015).
![Vol18No1_Mol_Bud_fig9]() |
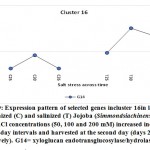
Figure 9: Expression pattern of selected genes incluster 16in leaves of non-salinized (C) and salinized (T) Jojoba (Simmondsia chinensis) plants at three NaCl concentrations (50, 100 and 200 mM) increased incrementally with five-day intervals and harvested at the second day (days 25, 30 and 35, respectively). G14 = xyloglucan endotransglucosylase/hydrolase protein 7.
Click here to view figure |
BURP domain protein RD22
The gene encoding the BURP domain protein RD22 was shown to be upregulated in jojobaleaves under the three salt stress concentrations (50, 100, and 200 mM NaCl) (Figure 10). The RD22 protein belongs to the BURP domain protein family (Hattori et al., 1998). The BURP domain consists of approximately 230 amino acids and is named for the first four identified members of the group, namely, BNM2, USP, RD22, and PG1beta. Under conditions of salt stress, the overexpression of the gene encoding RD22 results in enhanced growth and a higher chlorophyll content (Jamoussiet al., 2014). Simultaneously, the plant was able to accumulate lower levels of sodium (Na+) in leaves and chloride (Cl-) in all organs due to the action of theRD22 gene. Ion analysis of plants overexpressing the RD22 gene demonstrated the occurrence of osmotic adjustment due to the overproduction of total soluble sugars (Jamoussiet al., 2014). Other reports also showed that expression of the RD22 gene is induced by water deficit, salinity stress, and abscisic acid application (Shunwuet al., 2004). The RD22 gene helps in the production of lignin in plant leaves, which acts as another protective mechanism (Wang et al., 2012). Expression of the RD22 gene is induced by the two stress-responsive transcription factors MYC and MYB, acting as cis-elements in the RD22 promoter (Abe et al., 2003). The latter action reduces the adverse effects of stress on overall plant growth (Roxaset al., 2000). In conclusion, the jojoba plant initiates numerous physiological and molecular mechanisms to combat salt stress. These include mechanisms that limit cellular damage by regulating ROS production, methylation/demethylation mechanisms followed by an intergenerational transmission of a “stress memory,” and the production of proteins with superoxide dismutase (SOD) activity. Additional mechanisms include detoxification of metal ions and the production of molecular chaperones, the regulation of signal transductionand ion transport processes, the reprogramming of selective gene expression,andthe maintenance ofa balanced sucrose content. Furthermore, ethylene signaling and homeostasis, the regulation of plasmodesmal permeability, ubiquitination,and selective protein degradation are all mechanisms that also work toward reducing the impact of salt stress. The jojoba plant also employs cell wall remodeling, alleviating the chlorophyll content, reducing the levels of sodium (Na+) and chloride (Cl-) accumulation and lignin production as means of combatting salt stress. These findings will aid the utilization of jojoba in various ways, including its use in breeding programs and/or its mass production. Knowledge of these mechanisms will secure the quality and yield of its economically important chemical compounds.
![Vol18No1_Mol_Bud_fig10]() |
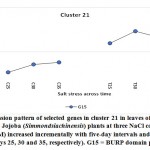
Figure 10: Expression pattern of selected genes in cluster 21 in leaves of non-salinized (C) and salinized (T) Jojoba (Simmondsiachinensis) plants at three NaCl concentrations (50, 100 and 200 mM) increased incrementally with five-day intervals and harvested at the second day (days 25, 30 and 35, respectively). G15 = BURP domain protein RD22.2.
Click here to view Figure |
Acknowledgment
The authors are grateful to King Abdulaziz University and Subol Almarefah Trading Company for funding this project.
Conflict of interest
The authors declare that there is no conflict of interests regarding the publication of this paper.
References
- Abdelaziz, M. N., Xuan, T. D., Mekawy, A. M. M., Wang, H., &Khanh, T. D. (2018). Relationship of salinity tolerance to Na+ exclusion, proline accumulation, and antioxidant enzyme activity in rice seedlings. Agriculture, 8(11), 166.
CrossRef
- Abe, H., Urao, T., Ito, T., Seki, M., Shinozaki, K., & Yamaguchi-Shinozaki, K. (2003). Arabidopsis AtMYC2 (bHLH) and AtMYB2 (MYB) function as transcriptional activators in abscisic acid signaling. The Plant Cell, 15(1), 63-78.
CrossRef
- Abounit, S., &Zurzolo, C. (2012). Wiring through tunneling nanotubes–from electrical signals to organelle transfer. Journal of cell science, 125(5), 1089-1098.
CrossRef
- Akashi, K., Nishimura, N., Ishida, Y., & Yokota, A. (2004). Potent hydroxyl radical-scavenging activity of drought-induced type-2 metallothionein in wild watermelon. Biochemical and Biophysical Research Communications, 323(1), 72-78.
CrossRef
- Al-Obaidi, J. R., Halabi, M. F., AlKhalifah, N. S., Asanar, S., Al-Soqeer, A. A., & Attia, M. F. (2017). A review on plant importance, biotechnological aspects, and cultivation challenges of jojoba plant. Biological research,
CrossRef
- Assaha, D. V. M., Liu, L., Ueda, A., Nagaoka, T. &Saneoka, H. (2016). Effects of drought stress on growth, solute accumulation and membrane stability of leafy vegetable, huckleberry (Solanum scabrum). J. Environ. Biol., 37, 107-114
- Assaha, D. V., Ueda, A., Saneoka, H., Al-Yahyai, R., &Yaish, M. W. (2017a). The role of Na+ and K+ transporters in salt stress adaptation in glycophytes. Frontiers in physiology, 8, 509.
CrossRef
- Assaha, D. V. M., Mekawy, A. M. M., Liu, L., Noori, M. S., Kokulan, K. S., Ueda, A., … &Saneoka, H. (2017b). Na+ retention in the root is a key adaptive mechanism to low and high salinity in the glycophyte, Talinum paniculatum (Jacq.) Gaertn.(Portulacaceae). Journal of Agronomy and Crop Science, 203(1), 56-67.
CrossRef
- Azevedo Neto, A. D. D., Prisco, J. T., Enéas-Filho, J., Lacerda, C. F. D., Silva, J. V., Costa, P. H. A. D., & Gomes-Filho, E. (2004). Effects of salt stress on plant growth, stomatal response and solute accumulation of different maize genotypes. Brazilian Journal of Plant Physiology, 16(1), 31-38.
CrossRef
- Bae, W., Lee, Y. J., Kim, D. H., Lee, J., Kim, S., Sohn, E. J., & Hwang, I. (2008). AKR2A-mediated import of chloroplast outer membrane proteins is essential for chloroplast biogenesis. Nature cell biology, 10(2), 220-227.
CrossRef
- Bafeel, S. O., Galal, H. K., & Basha, A. Z. (2016). Effect of seawater irrigation on growth and some metabolites of jojoba plants.-Eurasian J. Agric. Environ. Sci., 16, 49-59.
- Bahieldin, A., Atef, A., Sabir, J. S., Gadalla, N. O., Edris, S., Alzohairy, A. M., … & Hassan, S. M. (2015). RNA-Seq analysis of the wild barley ( spontaneum) leaf transcriptome under salt stress. Comptesrendusbiologies, 338(5), 285-297.
CrossRef
- Batlang, U. (2008). Benzyladenine plus gibberellins (GA4+ 7) increase fruit size and yield in greenhouse-grown hot pepper (Capsicum annuum). J. Biol. Sci, 8(3), 659-662.
CrossRef
- Benitez-Alfonso, Y., Faulkner, C., Pendle, A., Miyashima, S., Helariutta, Y., & Maule, A. (2013). Symplastic intercellular connectivity regulates lateral root patterning. Developmental cell, 26(2), 136-147.
CrossRef
- Benitez-Alfonso, Y., Jackson, D., & Maule, A. (2011). Redox regulation of intercellular transport. Protoplasma, 248(1), 131-140.
CrossRef
- Bolger, A. M., Lohse, M., &Usadel, B. (2014). Trimmomatic: a flexible trimmer for Illumina sequence data.Bioinformatics, 30(15), 2114-2120.
CrossRef
- Burch-Smith, T. M., &Zambryski, P. C. (2012). Plasmodesmata paradigm shift: regulation from without versus within. Annual review of plant biology, 63, 239-260.
CrossRef
- Cao, D., Liu, Y., Ma, L., Jin, X., Guo, G., Tan, R., … & Liu, W. (2018). Transcriptome analysis of differentially expressed genes involved in selenium accumulation in tea plant (Camellia sinensis).PloS one, 13(6), e0197506.
CrossRef
- Chen, Y. F., Randlett, M. D., Findell, J. L., & Schaller, G. E. (2002). Localization of the ethylene receptor ETR1 to the endoplasmic reticulum of Arabidopsis. Journal of Biological Chemistry, 277(22), 19861-19866.
CrossRef
- Chiaverini, N., & De Ley, M. (2010). Protective effect of metallothionein on oxidative stress-induced DNA damage. Free radical research, 44(6), 605-613.
CrossRef
- Christensen, A. B., Thordal-Christensen, H., Zimmermann, G., Gjetting, T., Lyngkjær, M. F., Dudler, R., & Schweizer, P. (2004). The germin-like protein GLP4 exhibits superoxide dismutase activity and is an important component of quantitative resistance in wheat and barley. Molecular Plant-Microbe Interactions, 17(1), 109-117.
CrossRef
- Chung, E., Cho, C. W., So, H. A., Kang, J. S., Chung, Y. S., & Lee, J. H. (2013). Overexpression of VrUBC1, a mung bean E2 ubiquitin-conjugating enzyme, enhances osmotic stress tolerance in Arabidopsis. PloS one, 8(6), e66056.
CrossRef
- Cho, S. K., Kim, J. E., Park, J. A., Eom, T. J., & Kim, W. T. (2006). Constitutive expression of abiotic stress-inducible hot pepper CaXTH3, which encodes a xyloglucan endotransglucosylase/hydrolase homolog, improves drought and salt tolerance in transgenic Arabidopsis plants. FEBS letters, 580(13), 3136-3144.
CrossRef
- Choi, J. Y., Seo, Y. S., Kim, S. J., Kim, W. T., & Shin, J. S. (2011). Constitutive expression of CaXTH3, a hot pepper xyloglucan endotransglucosylase/hydrolase, enhanced tolerance to salt and drought stresses without phenotypic defects in tomato plants (Solanum lycopersicum cv. Dotaerang). Plant Cell
CrossRef
- Cobbett, C., &Goldsbrough, P. (2002). Phytochelatins and metallothioneins: roles in heavy metal detoxification and homeostasis. Annual review of plant biology, 53(1), 159-182.
CrossRef
- Cui, F., Liu, L., Zhao, Q., Zhang, Z., Li, Q., Lin, B., … &Xie, Q. (2012). Arabidopsis ubiquitin conjugase UBC32 is an ERAD component that functions in brassinosteroid-mediated salt stress tolerance. The Plant Cell, 24(1), 233-244.
CrossRef
- Cui, W., & Lee, J. Y. (2016). Arabidopsis callose synthases CalS1/8 regulate plasmodesmal permeability during stress. Nature plants, 2(5), 1-9.
CrossRef
- Dai, Z., Yuan, Y., Huang, H., Hossain, M. M., Xiong, S., Cao, M., … & Tu, S. (2020). Methyl jasmonate mitigates high selenium damage of rice via altering antioxidant capacity, selenium transportation and gene expression. Science of The Total Environment, 143848.
CrossRef
- Davenport, S. B., Gallego, S. M., Benavides, M. P., &Tomaro, M. L. (2003). Behaviour of antioxidant defense system in the adaptive response to salt stress in Helianthus annuus cells. Plant Growth Regulation, 40(1), 81-88.
CrossRef
- Davidson, R. M., Manosalva, P. M., Snelling, J., Bruce, M., Leung, H., & Leach, J. E. (2010). Rice germin-like proteins: allelic diversity and relationships to early stress responses. Rice, 3(1), 43-55.
CrossRef
- Davidson, R. M., Reeves, P. A., Manosalva, P. M., & Leach, J. E. (2009). Germins: A diverse protein family important for crop improvement. Plant Science, 177(6), 499-510.
CrossRef
- De Storme, N., &Geelen, D. (2014). Callose homeostasis at plasmodesmata: molecular regulators and developmental relevance. Frontiers in plant science, 5, 138.
CrossRef
- Dombrowski, J. E. (2003). Salt stress activation of wound-related genes in tomato plants. Plant Physiology, 132(4), 2098-2107.
CrossRef
- Dong, H., Zhen, Z., Peng, J., Chang, L., Gong, Q., & Wang, N. N. (2011). Loss of ACS7 confers abiotic stress tolerance by modulating ABA sensitivity and accumulation in Arabidopsis. Journal of Experimental Botany, 62(14), 4875-4887.
CrossRef
- Freisinger, E. (2011). Structural features specific to plant metallothioneins. JBIC Journal of Biological Inorganic Chemistry, 16(7), 1035-1045.Leszczyszyn, O. I., Imam, H. T., &Blindauer, C. A. (2013). Diversity and distribution of plant metallothioneins: a review of structure, properties and functions. Metallomics, 5(9), 1146-1169.
CrossRef
- Garber, M., Grabherr, M. G., Guttman, M., &Trapnell, C. (2011). Computational methods for transcriptome annotation and quantification using RNA-seq.Nature methods, 8(6), 469-477.
CrossRef
- Gerdes, H. H., Rustom, A., & Wang, X. (2013). Tunneling nanotubes, an emerging intercellular communication route in development. Mechanisms of development, 130(6-8), 381-387.
CrossRef
- Godfrey, D., Able, A. J., & Dry, I. B. (2007). Induction of a grapevine germin-like protein (VvGLP3) gene is closely linked to the site of Erysiphe necator infection: a possible role in defense?. Molecular Plant-Microbe Interactions, 20(9), 1112-1125.
CrossRef
- Grant, J. J., &Loake, G. J. (2000). Role of reactive oxygen intermediates and cognate redox signaling in disease resistance. Plant physiology, 124(1), 21-30.
CrossRef
- Ha, C. M., Jun, J. H., Nam, H. G., & Fletcher, J. C. (2004). BLADE-ON-PETIOLE1 encodes a BTB/POZ domain protein required for leaf morphogenesis in Arabidopsis thaliana. Plant and Cell Physiology, 45(10), 1361-1370.
CrossRef
- Hajrah, N. H., Obaid, A. Y., Atef, A., Ramadan, A. M., Arasappan, D., Nelson, C. A., … &Makki, R. M. (2017). Transcriptomic analysis of salt stress responsive genes in Rhazya stricta.PloS one, 12(5), e0177589.
CrossRef
- Hattori, J., Boutilier, K. A., Campagne, M. L., & Miki, B. L. (1998). A conserved BURP domain defines a novel group of plant proteins with unusual primary structures. Molecular and General Genetics MGG, 259(4), 424-428.
CrossRef
- Hassinen, V. H., Tervahauta, A. I., Schat, H., &Kärenlampi, S. O. (2011). Plant metallothioneins–metal chelators with ROS scavenging activity?. Plant Biology, 13(2), 225-232.
CrossRef
- Hayashi, T., &Kaida, R. (2011). Functions of xyloglucan in plant cells. Molecular Plant, 4(1), 17-24.
CrossRef
- Hellmann, H., & Estelle, M. (2002). Plant development: regulation by protein degradation. Science, 297(5582), 793-797.
CrossRef
- Hirai, T., Duhita, N., Hiwasa-Tanase, K., &Ezura, H. (2011). Cultivation under salt stress increases the concentration of recombinant miraculin in transgenic tomato fruit, resulting in an increase in purification efficiency. Plant Biotechnology, 28, 387–392.
CrossRef
- Jamoussi, R. J., Elabbassi, M. M., JOUIRA, H. B., Hanana, M., Zoghlami, N., Ghorbel, A., &Mliki, A. (2014). Physiological responses of transgenic tobacco plants expressing the dehydration-responsive RD22 gene of Vitis vinifera to salt stress. Turkish Journal of Botany, 38(2), 268-280.
CrossRef
- Jain, M. (2012). Next-generation sequencing technologies for gene expression profiling in plants.Briefings in functional genomics, 11(1), 63-70.
CrossRef
- Jin, H., Sun, Y., Yang, Q., Chao, Y., Kang, J., Jin, H., … & Margaret, G. (2010). Screening of genes induced by salt stress from Alfalfa. Molecular biology reports, 37(2), 745-753.
CrossRef
- Jin, S., Xu, C., Li, G., Sun, D., Li, Y., Wang, X., & Liu, S. (2017). Functional characterization of a type 2 metallothionein gene, SsMT2, from alkaline-tolerant Suaeda salsa. Scientific reports, 7(1), 1-11.
CrossRef
- Kang, D. J., Seo, Y. J., Lee, J. D., Ishii, R., Kim, K. U., Shin, D. H., … & Lee, I. J. (2005). Jasmonic acid differentially affects growth, ion uptake and abscisic acid concentration in salt‐tolerant and salt‐sensitive rice cultivars. Journal of Agronomy and Crop Science, 191(4), 273-282.
CrossRef
- Kawa, D., &Testerink, C. (2017). Regulation of mRNA decay in plant responses to salt and osmotic stress.Cellular and Molecular Life Sciences, 74(7), 1165-1176.
CrossRef
- Kende, H. (1993). Ethylene biosynthesis. Annual review of plant biology, 44(1), 283-307.
CrossRef
- Kim, J. S., Lim, J. Y., Shin, H., Kim, B. G., Yoo, S. D., Kim, W. T., & Huh, J. H. (2019a). ROS1-dependent DNA demethylation is required for ABA-inducible NIC3 expression. Plant physiology, 179(4), 1810-1821.
CrossRef
- Kim, M. Y., Ono, A., Scholten, S., Kinoshita, T., Zilberman, D., Okamoto, T., & Fischer, R. L. (2019b). DNA demethylation by ROS1a in rice vegetative cells promotes methylation in sperm. Proceedings of the National Academy of Sciences, 116(19), 9652-9657.
CrossRef
- Kirsch, F., Luo, Q., Lu, X., & Hagemann, M. (2018). Inactivation of invertase enhances sucrose production in the cyanobacterium Synechocystis PCC 6803. Microbiology, 164(10), 1220-1228.
CrossRef
- Kornitzer, D., & Ciechanover, A. (2000). Modes of regulation of ubiquitin‐mediated protein degradation. Journal of cellular physiology, 182(1), 1-11.
CrossRef
- Lanciano, S., &Mirouze, M. (2017). DNA methylation in rice and relevance for breeding. Epigenomes, 1(2), 10.
CrossRef
- Lee, J., Donghwan, S., Won-yong, S., Inhwan, H., &Youngsook, L. (2004). Arabidopsis metallothioneins 2a and 3 enhance resistance to cadmium when expressed in Vicia faba guard cells. Plant Molecular Biology, 54(6), 805-815.
CrossRef
- Lee, J. Y. (2014). New and old roles of plasmodesmata in immunity and parallels to tunneling nanotubes. Plant Science, 221, 13-20.
CrossRef
- Li, J., Mahajan, Mahajan, A. & Tsai, M.-D. (2006). Ankyrin repeat: A unique motif mediating protein–protein interactions. Biochemistry, 45, 15168–15178.
CrossRef
- Li, C. H., Wang, G., Zhao, J. L., Zhang, L. Q., Ai, L. F., Han, Y. F., … & Sun, Y. (2014). The receptor-like kinase SIT1 mediates salt sensitivity by activating MAPK3/6 and regulating ethylene homeostasis in rice. The Plant Cell, 26(6), 2538-2553.
CrossRef
- Liang, W., Ma, X., Wan, P., & Liu, L. (2018). Plant salt-tolerance mechanism: A review.Biochemical and biophysical research communications, 495(1), 286-291.
CrossRef
- Liu, Y. B., Lu, S. M., Zhang, J. F., Liu, S., & Lu, Y. T. (2007). A xyloglucan endotransglucosylase/hydrolase involves in growth of primary root and alters the deposition of cellulose in Arabidopsis. Planta, 226(6), 1547-1560.
CrossRef
- Lopez-Ortiz, C., Peña-Garcia, Y., Natarajan, P., Bhandari, M., Abburi, V., Dutta, S. K., … & Reddy, U. K. (2020). The ankyrin repeat gene family in Capsicum spp: Genome-wide survey, characterization and gene expression profile. Scientific reports, 10(1), 1-16.
CrossRef
- Lu, M., Han, Y. P., Gao, J. G., Wang, X. J., & Li, W. B. (2010a). Identification and analysis of the germin-like gene family in soybean. Bmc Genomics, 11(1), 620.
CrossRef
- Lu, S., Li, T., & Jiang, J. (2010b). Effects of salinity on sucrose metabolism during tomato fruit development. African Journal of Biotechnology, 9(6), 842-849.
CrossRef
- Lucas, W. J., Ham, B. K., & Kim, J. Y. (2009). Plasmodesmata–bridging the gap between neighboring plant cells. Trends in cell biology, 19(10), 495-503.
CrossRef
- Martin, J. A., & Wang, Z. (2011). Next-generation transcriptome assembly.Nature Reviews Genetics, 12(10), 671-682.
CrossRef
- Martin, J. A., & Wang, Z. (2011). Next-generation transcriptome assembly.Nature Reviews Genetics, 12(10), 671-682.
CrossRef
- Masuda, Y., Nirasawa, S., Nakaya, K., &Kurihara, Y. (1995). Cloning and sequencing of a cDNA encoding a taste-modifying protein, miraculin. Gene, 161(2), 175-177.
CrossRef
- Matsui, A., Yokoyama, R., Seki, M., Ito, T., Shinozaki, K., Takahashi, T., … &Nishitani, K. (2005). AtXTH27 plays an essential role in cell wall modification during the development of tracheary elements. The Plant Journal, 42(4), 525-534.
CrossRef
- Mekawy, A. M. M., Assaha, D. V., & Ueda, A. (2020). Constitutive overexpression of rice metallothionein-like gene OsMT-3a enhances growth and tolerance of Arabidopsis plants to a combination of various abiotic stresses. Journal of plant research, 133(3), 429-440.
CrossRef
- Michaely, P., & Bennett, V. (1992). The ANK repeat: a ubiquitous motif involved in macromolecular recognition. Trends in cell biology, 2(5), 127-129.
CrossRef
- Min, X. J., Butler, G., Storms, R., & Tsang, A. (2005). OrfPredictor: predicting protein-coding regions in EST-derived sequences. Nucleic acids research, 33(suppl_2), W677-W680.
CrossRef
- Mittler, R. (2002). Oxidative stress, antioxidants and stress tolerance. Trends in plant science, 7(9), 405-410.
CrossRef
- Mittler, R. (2006). Abiotic stress, the field environment and stress combination. Trends in plant science, 11(1), 15-19.
CrossRef
- Montillet, J. L., Chamnongpol, S., Rustérucci, C., Dat, J., Van De Cotte, B., Agnel, J. P., … &Triantaphylidès, C. (2005). Fatty acid hydroperoxides and H2O2 in the execution of hypersensitive cell death in tobacco leaves. Plant physiology, 138(3), 1516-1526.
CrossRef
- Mouhaya, W., Allario, T., Brumos, J., Andrés, F., Froelicher, Y., Luro, F., … &Morillon, R. (2010). Sensitivity to high salinity in tetraploid citrus seedlings increases with water availability and correlates with expression of candidate genes. Functional plant biology, 37(7), 674-685.
CrossRef
- Munns, R. (2002). Comparative physiology of salt and water stress.Plant, cell & environment, 25(2), 239-250.
CrossRef
- Nejat, N., Ramalingam, A., & Mantri, N. (2018). Advances in transcriptomics of plants. InPlant Genetics and Molecular Biology (pp. 161-185), Springer, Cham.
CrossRef
- Nodzon, L. A., Xu, W. H., Wang, Y., Pi, L. Y., Chakrabarty, P. K., & Song, W. Y. (2004). The ubiquitin ligase XBAT32 regulates lateral root development in Arabidopsis. The Plant Journal, 40(6), 996-1006.
CrossRef
- Ono, A., Yamaguchi, K., Fukada‐Tanaka, S., Terada, R., Mitsui, T., & Iida, S. (2012). A null mutation of ROS1a for DNA demethylation in rice is not transmittable to progeny. The Plant Journal, 71(4), 564-574.
CrossRef
- Park, Y. B., & Cosgrove, D. J. (2015). Xyloglucan and its interactions with other components of the growing cell wall. Plant and Cell Physiology, 56(2), 180-194.
CrossRef
- Parrilla-Doblas, J. T., Roldán-Arjona T., Ariza R. R. & Córdoba-Cañero, D. (2019). Active DNA demethylation in plants. International Journal of Molecular Sciences, 20, 4683.
CrossRef
- Passerini, E., & Lombardo, P. (2000). Cosmetics.Cosmet News, 22
- Patankar, H. V., Al-Harrasi, I., Al Kharusi, L., Jana, G. A., Al-Yahyai, R., Sunkar, R., &Yaish, M. W. (2019). Overexpression of a Metallothionein 2A gene from date palm confers abiotic stress tolerance to yeast and Arabidopsis thaliana. International journal of molecular sciences, 20(12), 2871.
CrossRef
- Pauly, M., &Keegstra, K. (2016). Biosynthesis of the plant cell wall matrix polysaccharide xyloglucan. Annual review of plant biology, 67, 235-259.
CrossRef
- Roxas, V. P., Lodhi, S. A., Garrett, D. K., Mahan, J. R., & Allen, R. D. (2000). Stress tolerance in transgenic tobacco seedlings that overexpress glutathione S-transferase/glutathione peroxidase. Plant and Cell Physiology, 41(11), 1229-1234.
CrossRef
- Sager, R., & Lee, J. Y. (2014). Plasmodesmata in integrated cell signalling: insights from development and environmental signals and stresses. Journal of experimental botany, 65(22), 6337-6358.
CrossRef
- Sailaja, B., Mangrauthia, S. K., Sarla, N., &Voleti, S. R. (2014). Transcriptomics of heat stress in plants. InImprovement of crops in the era of climatic changes (pp. 49-89). Springer, New York, NY.
CrossRef
- Sakamoto, H., Matsuda, O., &Iba, K. (2008). ITN1, a novel gene encoding an ankyrin‐repeat protein that affects the ABA‐mediated production of reactive oxygen species and is involved in salt‐stress tolerance in Arabidopsis thaliana. The Plant Journal, 56(3), 411-422.
CrossRef
- Sakamoto, H., Nakagawara, Y., &Oguri, S. (2013). The expression of a novel gene encoding an ankyrin-repeat protein, DRA1, is regulated by drought-responsive alternative splicing. J. Biol. Veterinary Agr. Food Engin, 7, 12.
- Schweizer, P., Christoffel, A., &Dudler, R. (1999). Transient expression of members of the germin‐like gene family in epidermal cells of wheat confers disease resistance. The Plant Journal, 20(5), 541-552.
CrossRef
- Sedgwick, S. G., &Smerdon, S. J. (1999). The ankyrin repeat: a diversity of interactions on a common structural framework. Trends in biochemical sciences, 24(8), 311-316.
CrossRef
- Seong, E. S., Choi, D., Cho, H. S., Lim, C. K., Cho, H. J., & Wang, M. H. (2007). Characterization of a stress-responsive ankyrin repeat-containing zinc finger protein of Capsicum annuum (CaKR1). Journal of biochemistry and molecular biology, 40(6), 952.
CrossRef
- Serrano, N., Ling, Y., Bahieldin, A., & Mahfouz, M. M. (2019). Thermopriming reprograms metabolic homeostasis to confer heat tolerance. Scientific reports, 9(1), 1-14.
CrossRef
- Sevilem, I., Miyashima, S., &Helariutta, Y. (2013). Cell-to-cell communication via plasmodesmata in vascular plants. Cell adhesion & migration, 7(1), 27-32.
CrossRef
- Shen, G., Kuppu, S., Venkataramani, S., Wang, J., Yan, J., Qiu, X., & Zhang, H. (2010). ANKYRIN REPEAT-CONTAINING PROTEIN 2A is an essential molecular chaperone for peroxisomal membrane-bound ASCORBATE PEROXIDASE3 in Arabidopsis. The Plant Cell, 22(3), 811-831.
CrossRef
- Shunwu, Y., Zhang, L., Zuo, K., Li, Z., & Tang, K. (2004). Isolation and characterization of a BURP domain‐containing gene BnBDC1 from Brassica napus involved in abiotic and biotic stress. Physiologia Plantarum, 122(2), 210-218.
CrossRef
- Silverstein, K. A., Moskal Jr, W. A., Wu, H. C., Underwood, B. A., Graham, M. A., Town, C. D., &VandenBosch, K. A. (2007). Small cysteine‐rich peptides resembling antimicrobial peptides have been under‐predicted in plants. The Plant Journal, 51(2), 262-280.
CrossRef
- Steffens, B. (2014). The role of ethylene and ROS in salinity, heavy metal, and flooding responses in rice. Frontiers in plant science, 5, 685.
CrossRef
- Sun, S., Wang, H., Yu, H., Zhong, C., Zhang, X., Peng, J., & Wang, X. (2013). GASA14 regulates leaf expansion and abiotic stress resistance by modulating reactive oxygen species accumulation. Journal of experimental botany, 64(6), 1637-1647.
CrossRef
- Sung, P., Prakash, S., & Prakash, L. (1990). Mutation of cysteine-88 in the Saccharomyces cerevisiae RAD6 protein abolishes its ubiquitin-conjugating activity and its various biological functions. Proceedings of the National Academy of Sciences, 87(7), 2695-2699.
CrossRef
- Tsukuda, S., Gomi, K., Yamamoto, H., & Akimitsu, K. (2006). Characterization of cDNAs encoding two distinct miraculin-like proteins and stress-related modulation of the corresponding mRNAs in Citrus jambhiriPlant molecular biology, 60(1), 125-136.
CrossRef
- Trinh, N. N., Huang, T. L., Chi, W. C., Fu, S. F., Chen, C. C., & Huang, H. J. (2014). Chromium stress response effect on signal transduction and expression of signaling genes in rice. Physiologia plantarum, 150(2), 205-224.
CrossRef
- Ueda, A., Kathiresan, A., Bennett, J., &Takabe, T. (2006). Comparative transcriptome analyses of barley and rice under salt stress.Theoretical and Applied Genetics, 112(7), 1286-1294.
CrossRef
- Vatén, A., Dettmer, J., Wu, S., Stierhof, Y. D., Miyashima, S., Yadav, S. R., … &Lehesranta, S. (2011). Callose biosynthesis regulates symplastic trafficking during root development. Developmental cell, 21(6), 1144-1155.
CrossRef
- Wang, H., Zhou, L., Fu, Y., CHEUNG, M. Y., WONG, F. L., PHANG, T. H., … & LAM, H. M. (2012). Expression of an apoplast‐localized BURP‐domain protein from soybean (GmRD22) enhances tolerance towards abiotic stress. Plant, Cell & Environment, 35(11), 1932-1947.
CrossRef
- Wang, K. L. C., Li, H., & Ecker, J. R. (2002). Ethylene biosynthesis and signaling networks. The plant cell, 14(suppl 1), S131-S151.
CrossRef
- Wang, Z., Gerstein, M., & Snyder, M. (2009). RNA-Seq: a revolutionary tool for transcriptomics.Nature reviews genetics, 10(1), 57-63.
CrossRef
- Wangsawang, T., Chuamnakthong, S., Kohnishi, E., Sripichitt, P., Sreewongchai, T., & Ueda, A. (2018). A salinity‐tolerant japonica cultivar has Na+ exclusion mechanism at leaf sheaths through the function of a Na+ transporter Os HKT 1; 4 under salinity stress. Journal of Agronomy and Crop Science, 204(3), 274-284.
CrossRef
- Wibowo, A., Becker, C., Marconi, G., Durr, J., Price, J., Hagmann, J., … & Weigel, D. (2016). Hyperosmotic stress memory in Arabidopsis is mediated by distinct epigenetically labile sites in the genome and is restricted in the male germline by DNA glycosylase activity. Elife, 5, e13546.
CrossRef
- Wigoda, N., Ben‐Nissan, G., Granot, D., Schwartz, A., & Weiss, D. (2006). The gibberellin‐induced, cysteine‐rich protein GIP2 from Petunia hybrida exhibits in planta antioxidant activity. The Plant Journal, 48(5), 796-805.
CrossRef
- Wolucka, B. A., Goossens, A., &Inzé, D. (2005). Methyl jasmonate stimulates the de novo biosynthesis of vitamin C in plant cell suspensions. Journal of experimental Botany, 56(419), 2527-2538.
CrossRef
- Xu, Q. F., Cheng, W. S., Li, S. S., Li, W., Zhang, Z. X., Xu, Y. P., … & Cai, X. Z. (2012). Identification of genes required for Cf-dependent hypersensitive cell death by combined proteomic and RNA interfering analyses. Journal of experimental botany, 63(7), 2421-2435.
CrossRef
- Yan, J., Huang, Y., He, H., Han, T., Di, P., Sechet, J., … & Ni, L. (2019). Xyloglucan endotransglucosylase-hydrolase30 negatively affects salt tolerance in Arabidopsis. Journal of experimental botany, 70(19), 5495-5506.
CrossRef
- Yan, J., Wang, J., & Zhang, H. (2002). An ankyrin repeat‐containing protein plays a role in both disease resistance and antioxidation metabolism. The Plant Journal, 29(2), 193-202.
CrossRef
- Yassin, M., El Sabagh, A., Mekawy, A. M. M., Islam, M. S., Hossain, A., Barutcular, C., … &Saneoka, H. (2019). Comparative performance of two bread wheat (Triticum aestivum) genotypes under salinity stress. Applied Ecology and Environmental Research, 17(2), 5029-5041.
CrossRef
- Yu, X., Fei, P., Xie, Z., Zhang, W., Zhao, Q., & Zhang, X. (2019). Effects of methyl jasmonate on growth, antioxidants, and carbon and nitrogen metabolism of Glycyrrhiza uralensis under salt stress. Biologia plantarum, 63(1), 89-96.
CrossRef
- Yuan, X., Zhang, S., Liu, S., Yu, M., Su, H., Shu, H., & Li, X. (2013). Global analysis of ankyrin repeat domain C3HC4-type RING finger gene family in plants. PloS one, 8(3), e58003.
CrossRef
- Zavaliev, R., Ueki, S., Epel, B. L., &Citovsky, V. (2011). Biology of callose (β-1, 3-glucan) turnover at plasmodesmata. Protoplasma, 248(1), 117-130.
CrossRef
- Zhang, D., Wan, Q., He, X., Ning, L., Huang, Y., Xu, Z., … & Shao, H. (2016). Genome-wide characterization of the ankyrin repeats gene family under salt stress in soybean. Science of the Total Environment, 568, 899-909.
CrossRef
- Zhang, F. Q., Wang, Y. S., Lou, Z. P., & Dong, J. D. (2007). Effect of heavy metal stress on antioxidative enzymes and lipid peroxidation in leaves and roots of two mangrove plant seedlings (Kandeliacandel and Bruguieragymnorrhiza). Chemosphere, 67(1), 44-50.
CrossRef
- Zhang, S., & Wang, X. (2008). Expression pattern of GASA, downstream genes of DELLA, in Arabidopsis. Chinese Science Bulletin, 53(24), 3839-3846.
CrossRef
- Zhang, S., & Wang, X. (2017). One new kind of phytohormonal signaling integrator: Up-and-coming GASA family genes. Plant Signaling & Behavior, 12(2), e1226453.
CrossRef
- Zhang, X., Allan, A. C., Li, C., Wang, Y., & Yao, Q. (2015). De novo assembly and characterization of the transcriptome of the Chinese medicinal herb, Gentiana rigescens. International journal of molecular sciences, 16(5), 11550-11573.
CrossRef
- Zhang, X. Y., Hu, C. G., & Yao, J. L. (2010). Tetraploidization of diploid Dioscorea results in activation of the antioxidant defense system and increased heat tolerance. Journal of plant physiology, 167(2), 88-94.
CrossRef
- Zimeri, A. M., Dhankher, O. P., McCaig, B., & Meagher, R. B. (2005). The plant MT1 metallothioneins are stabilized by binding cadmiums and are required for cadmium tolerance and accumulation. Plant molecular biology, 58(6), 839-855.
CrossRef
- Zhou, G. A., Chang, R. Z., &Qiu, L. J. (2010). Overexpression of soybean ubiquitin-conjugating enzyme gene GmUBC2 confers enhanced drought and salt tolerance through modulating abiotic stress-responsive gene expression in Arabidopsis. Plant molecular biology, 72(4-5), 357-367.
CrossRef


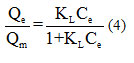
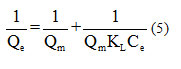
 based on
 , the slope line is