Introduction
In 2001, Food and Agriculture Organization of the United Nations/World Health Organization (FAO/WHO) defined probiotics as “live microorganisms, which, when administered in adequate amounts, confer a health benefit on the host”1. However, probiotic food consumption has been a part of different cultures around the world for many centuries. Probiotic organisms generally belong to LAB (lactic acid producing bacteria) and include Lactobacillus, Lactococcus, Bifidobacterium and many other organisms2. Microorganisms of various other genera such as Bacillus, not belonging to LABs, have been identified and declared as probiotics as they exhibited probiotic characteristics3. In recent times, researchers have focussed on benefits of probiotics and many have established their health and nutritional benefits in humans. Beneficial effects of probiotics include improvement of gut health, reduction in symptoms of Irritable Bowel Syndrome (IBS)4, antibiotic associated diarrhoea5,6, infectious diarrhoea caused by rotavirus7-9, traveller’s diarrhoea10 and necrotizing enterocolitis11.
Many studies have been performed on bioremediation of heavy metals by microorganisms12-14 and have reported an interesting observations that probiotics such as Lactobacillus spp. and Bacillus spp. also have the ability to bioremediate heavy metals15-19. This has been attributed to the structural components of their cell wall such as teichoic acid, lipoteichoic acid and peptidoglycan20.
Heavy metals such as lead, chromium, nickel, cadmium, mercury and arsenic reach human gut through food and water laden with them. These heavy metals enter the food chain as a result of anthropogenic activities and cause varying levels of toxicity in humans21. Hence, these microorganisms are the best and most effective agents to reduce toxicity caused by heavy metals since they are safe in terms of human usage, are ingested via diet, show gut remediation and can eliminate the heavy metals by defaecation22.
In this study, B. clausii was evaluated for tolerance and survival capacity in presence of Cr (VI), Pb (II), Cd (II) and Ni (II) and the effect of exposure of these heavy metals on it.
Materials and Methods
Materials
Commercially available probiotic Bacillus clausii was procured from local chemist. It is marketed by Sanofi Synthelabo Pvt Ltd. Powai, Mumbai, India as a spore suspension under the name “Enterogermina®”. Potassium dichromate, lead nitrate, cadmium sulphate and nickel sulphate are the salts of heavy metals which have been selected for this study and were used as sources of Cr (VI), Pb (II), Cd (II) and Ni (II), respectively. Antibiotic discs were procured from HiMedia, India for kanamycin (30 μg), norfloxacin (10 μg), chloramphenicol (30 μg), amoxycillin (10 μg), ciprofloxacin (5 μg), and ampicillin (10 μg).
Methods
Minimum Inhibitory Concentration (MIC)
MIC of Cr (VI), Pb (II), Cd (II) and Ni (II) for B. clausii was assessed by method of Mistry et al23 with some modifications. Spores were germinated in nutrient broth (NB) and inoculated on nutrient agar (NA) plates supplemented with two-fold concentration of respective heavy metals ranging from 1-512 ppm. These plates were incubated at 37o C for 24 hrs. The lowest concentration of the respective heavy metal which inhibited the growth of probiotic was considered as the MIC of that heavy metal for B. clausii.
Characterization of Heavy Metal Resistant B. Clausii
Various characterization parameters of B. clausii were evaluated before and after 24 hrs. exposure to Cr (VI), Pb (II), Cd (II) and Ni (II). This was done to assess whether the respective heavy metal exposure affects characteristics of the test organism.
Morphological Characterization
Observations on cell size, shape, colony characteristics and staining properties were performed on B. clausii before and after exposure to test heavy metals.
Biochemical Characterization
Catalase Test
Unexposed and exposed cultures of B. clausii for Cr (VI), Pb (II), Cd (II) and Ni (II) were cultured on NA slants. Few drops of H2O2 were added to the slant after 24 hrs. and observed for immediate bubbling24.
Methyl Red and Voges Proskauer (MRVP) Test
MRVP test was performed to determine glucose fermentation products. MR test was done according to methodology of Clark and Lub25 while for VP test method of Voges and Proskauer26 modified by Barritt27 was followed. This was done on unexposed and exposed B. clausii to Cr (VI), Pb (II), Cd (II) and Ni (II) respectively, in sets of glucose phosphate broth tubes. The tubes were inoculated and incubated for 72-96 hrs. Methyl red was added to one tube of the set to check development of acid. To the other tube, 12 drops of reagent VP-I was added followed by 2-3 drops of reagent VP-II. The tubes were exposed to air and were shaken intermittently. One tube remained uninoculated and acted as control.
Sugar Fermentation Test
Sugar fermentation test was performed according to procedure of Cappuccino and Sherman28. A set of sugar fermentation tubes were prepared with different sugars (lactose, sucrose, glucose, sorbitol and mannitol). Phenol red was added to the broth as pH indicator to check for acid production and Durham’s tube were placed in the broth to check for gas production. The broth was inoculated with unexposed and exposed B. clausii to each heavy metal respectively. An uninoculated tube was kept as control.
Antibiotic Sensitivity Test
To analyse whether Cr (VI), Pb (II), Cd (II) and Ni (II) exposure caused any change in antibiotic sensitivity of B. clausii, Kirby-Bauer disc diffusion method was performed using antibiotic discs29. Zone of inhibition was measured after 24 hrs. for the unexposed and exposed cultures of B. clausii.
Probiotic Characterization
Efficacy of B. clausii as a probiotic was studied by acid and bile tolerance assays after exposure to heavy metals under study. For both assays, methodology of Hassanzadazar et al30 was followed with some modifications.
For acid tolerance assay, B. clausii exposed to Cr (VI), Pb (II), Cd (II) and Ni (II) respectively, was added to different broths of pH 2, 3 and 4. Growth of exposed B. clausii was monitored by viable cell count that was performed by pour plate technique for every hour for 3 hrs. Prior to plating, ten- fold serial dilution of the inoculum was prepared in 0.1% peptone water. All the experiments were done in triplicates. Cell counting was done after 24 hrs. of incubation at 37o C.
For bile tolerance assay, NB with bile salt concentration of 0.2, 0.3 and 0.4% were prepared. B. clausii after 24 hrs. exposure to Cr (VI), Pb (II), Cd (II) and Ni (II) was added to the respective broths. Viable cell count was performed by pour plate technique. The inoculum was prepared hourly for 3 hrs. by ten- fold serial dilution in 0.1% peptone water. Colony count was done after 24 hrs. incubation at 37o C.
Results and Discussion
Minimum Inhibitory Concentration (MIC)
In presence of nickel and chromium, B. clausii showed growth till 128 ppm and hence MIC was obtained as 256 ppm. In case of cadmium exposure, MIC was obtained at 64 ppm. However, after lead exposure, B. clausii showed good growth till 512 ppm and thus no MIC was recorded.
Earlier, environmental species of genus Bacillus have shown bioremediation of Cr (VI)31, Pb (II)32, Cd (II)33 and Ni (II)34. The genetic determinants for heavy metal tolerance might be borne either on plasmids, transposons or genomic DNA35,36. In fact, these determinants are responsible for increased tolerance of microorganisms for heavy metals and are reported more in heavy metal polluted sites rather than in unpolluted sites37.
The results of the assay for MIC indicate combined resistance of B. clausii and high MIC values for the heavy metals tested. The earlier studies conducted by Silver38 and Alam and Imran39 also have reported similar combined resistance of B. clausii. Further studies have reported that bacteria which are multi-heavy metal resistant have greater MIC values as compared to bacteria showing resistance to a single heavy metal39-41.
According to WHO, the guideline values for Cr (VI), Pb (II), Cd (II) and Ni (II) in drinking water are 0.05 mg/L, 0.01 mg/L, 0.003mg/L and 0.07mg/L, respectively42. B. clausii has shown MIC values much above the permissible values of these heavy metals in drinking water, indicating that it has the potential for bioremediation of the above mentioned heavy metals.
Morphological and Biochemical Characterization
Vegetative cells of B. clausii exposed to heavy metal stress did not exhibit any change in their various morphological characteristics like cell shape, cell size, colony characters etc. Similar observations were made when heavy metal exposure did not affect the biochemical properties test organism. These results indicate that 24 hrs. exposure of B. clausii to Cr (VI), Pb (II), Cd (II) and Ni (II) could not modify or transform the organism’s basic characteristics as depicted in Table 1.
Table 1: Comparison of morphological and biochemical characteristics of B. clausii before and after exposure to Cr (VI), Pb (II), Cd (II) and Ni (II)
| S.no. | Characteristics | Unexposed B. clausii | B. clausii exposed to Cr (VI), Pb (II), Cd (II) and Ni (II) |
| 1. | Colony characteristics | Creamish, opaque, small | Creamish, opaque, small |
| 2. | Gram’s staining | Gram positive | Gram positive |
| 3. | Endospore staining | Endospore present | Endospore present |
| 4. | Catalase test | Positive | Positive |
| 5. | Glucose fermentation | Acid formation and gas production | Acid formation and gas production |
| 6. | Sucrose fermentation | Acid formation and gas production | Acid formation and gas production |
| 7. | Lactose fermentation | No acid and gas production | No acid and gas production |
| 8. | Mannitol fermentation | Acid formation and gas production | Acid formation and gas production |
| 9. | Sorbitol fermentation | Acid formation and gas production | Acid formation and gas production |
| 10. | Methyl red test | Positive | Positive |
| 11. | Voges-Proskauer test
|
Negative | Negative |
Antibiotic Sensitivity Test
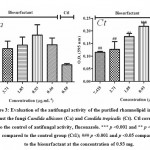
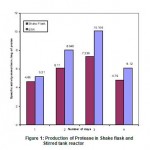
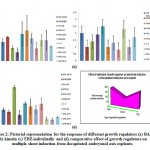
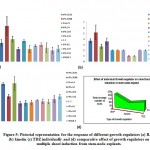
An organism can be either tolerant or resistant to antibiotics. For an organism to be resistant, it must grow in constant presence of low concentration of antibiotic. If an organism is categorized as tolerant, it means that it can survive for short duration of high concentration of antibiotic43. This helps to determine the successful clinical use of antibiotics. In this study, upon exposure to heavy metal stress, a marked increase was observed in antibiotic sensitivity of B. clausii for the antibiotics used (Fig 1). Against amoxicillin, Pb (II) exposed B. clausii showed maximum change (from 9 mm to 33 mm) (Fig 2, Fig 4) while minimum change was recorded for Ni (II) (Fig 2, Fig 5) exposed and Cd (II) exposed culture (from 9 mm to 17 mm) (Fig 2, Fig 6b). Lead exposed culture recorded maximum (from 15 mm to 34 mm) (Fig 2, Fig 4) and cadmium exposed culture recorded minimum (from 15 mm to 21 mm) change against ciprofloxacin (Fig 2, Fig 6a). After exposure to lead, B. clausii showed doubling of antibiotic sensitivity (from 11 mm to 22 mm) against norfloxacin (Fig 2, Fig 4) while minimum was for chromium exposed culture (from 11 mm to 17 mm) (Fig 2, Fig 3). The zone of inhibition increased from 8 mm to 28 mm after lead exposure which was maximum for ampicillin (Fig 2, Fig 4) while minimum increase was for Cr (VI) (Fig 2, Fig 3) and Cd (II) (Fig 2, Fig 6c) exposed B. clausii (from 8 mm to 17 mm respectively). Pb (II) exposed test organism recorded maximum change against kanamycin (13 mm to 31 mm) (Fig 2, Fig 4) while Cd (II) exposed B. clausii showed negligible change (13 mm to 15 mm) (Fig 2, Fig 6b). For chloramphenicol, after exposure to nickel, B. clausii showed a tremendous increase in the zone of inhibition from 7 mm to 32 mm (Fig 2, Fig 5) while negligible change was found in Cd (II) exposed test probiotic (7 mm to 10 mm) (Fig 2, Fig 6a). This behaviour may be related to presence of proteins involved in chloramphenicol and kanamycin resistance have also been identified in proteome of B. clausii44. Thus, lead exposure caused maximum change in antibiotic sensitivity while cadmium exposure led to minimum change. According to above definition, B. clausii can be considered as resistant to the antibiotics tested against and can therefore be used to replenish the microflora of the gut after antibiotic treatment, even after heavy metal exposure. The results of above assay indicate that the antibiotic resistance of B. clausii decreases upon exposure to Cr (VI), Pb (II), Cd (II) and Ni (II). Similar results obtained by Tuckfield and McArthur45, Habi and Daba46 and Belapurkar et al19, which also support our findings. Various researchers have postulated multiple reasons for this observation. The reasons can be inactivation of enzymes and proteins by heavy metals involved in antibiotic resistance47, irreversible inhibition of ribosome function by heavy metals47 or chelation of antibiotics by heavy metals thus reducing their concentration48.
 |
Figure 1: Diameter of zone of inhibition (mm) for B. |
 |
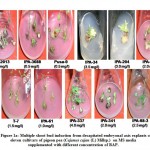
Figure 2: Zone of inhibition of B. clausii before exposure to heavy metals |
 |
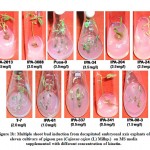
Figure 3: Zone of inhibition of B. clausii after exposure to Cr (VI) |
 |
Figure 4: Zone of inhibition of B. clausii after exposure to Pb (II) |
 |
Figure 5: Zone of inhibition of B. clausii after exposure to Ni (II) |
 |
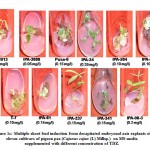
Figure 6: (a, b, c) Zone of inhibition of B. clausii after exposure to Cd (II) |
From the above results, it can also been concluded that B. clausii has potential to resist and tolerate both heavy metals and antibiotics. In bacteria, antibiotic resistance and heavy metal tolerance are genetically linked through R- plasmid49-51. According to the study of Alam and Imran39 selective pressure of the heavy metals causes co-selection of antibiotic resistance, albeit indirectly.
Probiotic Characterization
As B. clausii is a probiotic microorganism, it can survive low pH conditions of stomach as well as in presence of bile salts in the intestinal tract. To determine the effect of heavy metal stress on its probiotic efficacy of B. clausii, acid and bile tolerance assays were performed.
Acid Tolerance Assay
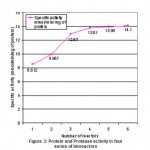
When Cr (VI) exposed B. clausii was inoculated in pH 2, 3 and 4 respectively and growth was monitored for 3 consecutive hours, it was observed that maximum CFU (colony forming units) were obtained at pH 3 after 3 hrs. (Fig. 7). Similar result was obtained for Pb (II), Cd (II) and Ni (II) exposed B. clausii (Fig. 8-10). This is in corroboration with a study conducted by Sahadeva et al52 which says that for an organism to be acid tolerant it must show maximum growth at pH 3 after 3 hrs.
 |
Figure 7: Acid tolerance of B. clausii after exposure to chromium |
 |
Figure 8: Acid tolerance of B. clausii after exposure to lead |
 |
Figure 9: Acid tolerance of B. clausii after exposure to cadmium |
 |
Figure 10: Acid tolerance of B. clausii after exposure to nickel |
Mechanisms of acid tolerance are more prominent in Gram positive bacteria like Bacillus spp. as they attain higher cell densities which enhance biofilm formation and communication amongst cells53. These mechanisms are (i) change in types of fatty acids of cell membrane54 (ii) exchange of proton for an amino acid in presence of amino acid carboxylase55,56 (iii) conserving structures of macromolecules like proteins with the help of chaperones54,57,58 and (iv) counteracting the low pH with production of alkaline molecules like ammonia59. Since the test organism belongs to genus Bacillus, it probably suggests use one or more of these mechanisms. Interestingly, despite high heavy metal stress, acid tolerance of B. clausii was not affected as concluded by the results of this assay.
Bile Tolerance Assay
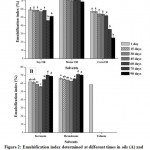
For a probiotic to be categorized as bile tolerant, it must have maximal growth at 0.3% bile salt concentration after 3 hrs.60,61 When B. clausii exposed to heavy metals under study was inoculated in bile salt concentrations of 0.2%, 0.3% and 0.4%, highest CFUs were observed at 0.3% bile after 3 hrs. Hence, subjection of B. clausii to heavy metal stress did not change its bile tolerance property (Fig. 11-14).
 |
Figure 11: Bile tolerance of B. clausii after exposure to chromium |
 |
Figure 12: Bile tolerance of B. clausii after exposure to lead |
 |
Figure 13: Bile tolerance of B. clausii after exposure to cadmium |
 |
Figure 14: Bile tolerance of B. clausii after exposure to nickel |
In contrast to defined mechanisms of acid tolerance, the methods by which bacterial cell counters bile stress is not well defined. One of the mechanism is with the use of enzyme bile salt hydrolase62. Apart from this, complex gene expression is also known to be responsible for bile tolerant property of bacteria63-66.
It may be noted that even under heavy metal stress, B. clausii is able to retain its probiotic efficacy by probable use of different mechanisms and can be applicable for bioremediation of heavy metal, in vivo.
Conclusion
Anthropogenic and natural activities are the causes of Cr (VI), Pb (II), Cd (II) and Ni (II) contamination of soil and water and air. These are toxic heavy metals which reach humans through the food chain and cause detrimental effects on their health. Chromium and lead are systemic toxicants while nickel and cadmium are carcinogens. When the effects of these heavy metals were tested on a probiotic microorganism, B. clausii, no change was observed in its morphological and biochemical properties and its probiotic efficacy. Hence, it can be concluded that B. clausii, a commercial probiotic has the potential for in vivo bioremediation of Cr (VI), Pb (II), Cd (II) and Ni (II) and can therefore benefit the society at large by reducing the toxicity of these heavy metals in the human gut.
Acknowledgements
The authors wish to thank Ar. Achal Choudhary, President and Dr. Sanjay Nagar, Head, Department of Biotechnology, IPS Academy, Indore for their valuable assistance regarding infrastructural and laboratory facilities.
Financial Support and Sponsorship/ Funding
Not applicable
Conflicts of Interest
There are no conflicts of interest among authors
References
- FAO/WHO. Health and Nutritional Properties of Probiotics in Food including Powder Milk with Live Lactic Acid Bacteria. Cordoba, Argentina: Report of a Joint FAO/WHO Expert Consultation. 2001; pp 5.
- Todar K. The Good, the Bad and the Deadly, 1st Wyoming, USA. 2004
- Elshaghabee F.M.F., Rokana N., Gulhane R.D., Sharma C., Panwar H. Bacillus as potential probiotics: status, concerns, and future perspectives. Microbiol. 2017; 8: 1-15.
- Marteau P., Seksik P., Jian R. Probiotics and intestinal health effects: a clinical perspective. J. Nutr. 2002; 88(1): 51-7.
- McFarland L.V. Meta-analysis of probiotics for the prevention of antibiotic associated diarrhea and the treatment of Clostridium difficile Am. J. Gastroenterol. 2006; 101(4): 812–22.
- Sazawal S., Hiremath G., Dhingra U., Malik P., Deb S., Black R. E. Efficacy of probiotics in prevention of acute diarrhoea: a meta-analysis of masked, randomised, placebo-controlled trials. Lancet Infect. Dis. 2006; 6(6): 374–82.
- Szajewska H., Mrukowicz J. Z. Probiotics in the treatment and prevention of acute infectious diarrhea in infants and children: a systematic review of published randomized, doubleblind, placebo-controlled trials. Pediatr. Gastroenterol. Nutr. 2001; 33(4): 17–25.
- Isolauri E., Kirjavainen P.V., Salminen S. Probiotics: a role in the treatment of intestinal infection and inflammation? 2002; 50(3): 54–9.
- Shah N.P. Functional cultures and health benefits. Dairy. J. 2007; 17(11): 1262–77.
- McFarland L.V. Meta-analysis of probiotics for the prevention of traveler’s diarrhea, Travel Med. Infect. Dis. 2007; 5(2): 97–105.
- Deshpande G., Rao S., Patole S. Probiotics for prevention of necrotising enterocolitis in preterm neonates with very low birth weight: a systemic review of randomized controlled trials. 2007; 369(9573): 1614–20.
- Syed S., Chinthala P. Heavy metal detoxification by different Bacillus species isolated from solar salterns. Scientifica 2015; 1-8.
- Imam S.A., Rajpoot I.K., Gajjar B., Sachdeva A. Comparative study of heavy metal bioremediation in soil by Bacillus subtilis and Saccharomyces cerevisiae. Indian J. Sci. Technol. 2016; 9(47): 1-7.
- Oaikhena E.E., Makaije D.B., Denwe S.D., Namadi M.M., Haroun A.A. Bioremediation potentials of heavy metal tolerant bacteria isolated from petroleum refinery effluent, J. Environ. Protect. 2016; 5(2): 29-34.
- Ibrahim F., Halttunen T., Tahvonen R., Salminen S., Probiotic bacteria as potential detoxification tools: assessing their heavy metal binding isotherms. J. Microbiol. 2006; 52(9): 877–85.
- Halttunen T., Finell M., Salminen S. Arsenic removal by native and chemically modified lactic acid bacteria. J. Food. Microbiol. 2007; 120(1–2): 173–8.
- Halttunen T., Collado M.C., El-Nezami H., Meriluoto J., Salminen S. Combining strains of lactic acid bacteria may reduce their toxin and heavy metal removal efficiency from aqueous solution. Appl. Microbiol. 2008; 46(2): 160–5.
- Belapurkar P., Goyal P., Kar A. In vitro evaluation of bioremediation capacity of a commercial probiotic, Bacillus coagulans, for chromium (VI) and lead (II) toxicity. J. Pharm. Bioallied Sci. 2016; 8(4): 272-6.
- Belapurkar P., Goyal P., Kar A. Potential assessment of Bacillus coagulans for bioremediation of Zn (II) and Ni (II): an in vitro study. Eur. J. Biomed. Pharm. Sci. 2018; 5(1): 627-32.
- Delcour J., Ferain T., Deghorain M., Palumbo E., Hols P. The biosynthesis and functionality of the cell-wall of lactic acid bacteria. Antonie Van Leeuwenhoek. 1999; 76(1-4): 159-84.
- Ahmed S., Islam M. R., Ferdousi J., Iqbal T. S. Probiotic Lactobacillus with bioremediation potential of toxic heavy metals. Bangladesh J. Microbiol. 2017; 34(1): 43-6.
- Robinson J.B., Tuovinen O.H. Mechanisms of microbial resistance and detoxification of mercury and organomercury compounds: physiological, biochemical, and genetic analyses. Rev. 1984; 48(2): 95–124.
- Mistry K., Desai C., Lal S., Patel K., Patel B. Hexavalent chromium reduction by Staphylococcus isolated from chromium (VI) contaminated landfill. Int. J. Biotechnol. Biochem. 2010; 6(1): 117‑29.
- MacFaddin J.F.: Biochemical Tests for Identification of Medical Bacteria, 3rd edn. Philadelphia, PA: Lippincott Williams & Wilkins. 2000; pp 113
- Clark W.M., Lubs H.A. The differentiation of bacteria of the colon-aerogenes family by the use of indicators. Infect. Dis. 1915; 17(1): 160–73.
- Voges O., Proskauer B. Beitraege zur ernaehrungsphysiologie und zur differential diagnose der bakterien der hemmorrhagischen septicamie. Hyg. 1898; 28: 20–32.
- Barritt M. M. The intensification of the Voges-Proskauer reaction by the addition of α-naphthol. Pathol. Bacteriol. 1936; 42(2): 441–54.
- Cappuccino J.G. Sherman N., Microbiology: A Laboratory Manual, 8th ed. Pearson Benjamin Cummings, San Francisco, CA, USA (2008)
- Bauer A.W., Kirby W.M.M., Sherris J.C., Turck M. Antibiotic susceptibility testing by a standardized single disk method. J. Clin. Pathol. 1966; 45(4): 493-6.
- Hassanzadazar H., Ehsani A., Mardani K., Hesari J. Investigation of antibacterial, acid and bile tolerance properties of lactobacilli isolated from Koozeh cheese. Res. Forum. 2012; 3(3): 181-5.
- Elahi A., Rehman A. Comparative behavior of two gram positive Cr6+ resistant bacterial strains Bacillus aerius S1 and Brevibacterium iodinum S2 under hexavalent chromium stress. Rep. (Amst.). 2019; 21: 1-8.
- Qiao W., Zhang Y., Xia H., Luo Y., Liu S., Wang S., Wang W.. Bioimmobilization of lead by Bacillus subtilis X3 biomass isolated from lead mine soil under promotion of multiple adsorption mechanisms. Soc. Open. Sci. 2019; 6(2): 1-10.
- Shameer S. Biosorption of lead, copper and cadmium using the extracellular polysaccharides (EPS) of Bacillus , from solar salterns. 3 Biotech. 2016; 6: 1-10.
- Uthra K., Kadirvelu K. Biosorption of nickel using mixed cultures of Pseudomonas aeruginosa and Bacillus subtilis. Def. Life. Sci. J. 2017; 2(4): 442-7.
- Cervantes C., Chavez K., Vaca S. Mechanisms of bacterial resistance to heavy metals. Latinoam. Microbiol. 1991; 33(1): 61-70.
- Carattoli A. Plasmid-mediated antimicrobial resistance in Salmonella enterica. Issues Mol. Biol. 2003; 5(4): 113-22.
- Coral M. U., Korkmaz H., Arikan B., Coral G. Plasmid mediated heavy metal resistances in Enterobacter isolated from Sofulu landfill, in Adana, Turkey. Ann. Microbiol. 2005; 55(3): 175-9.
- Silver S. Bacterial resistances to toxic metal ions-a review. 1996; 179(1): 9-19.
- Alam M., Imran M., Metal tolerance analysis of Gram negative bacteria from hospital effluents of Northern India. Appl. Pharm. Sci. 2017; 7(04): 174-80.
- Basu M., Bhattacharya S., Paul A.K., Isolation and characterization of chromium-resistant bacteria from tannery effluents. Environ. Contam. Toxicol. 1997; 58(4): 535-42.
- Karbasizaed V., Badami N., Emtiazi G., Antimicrobial, heavy metal resistance and plasmid profile of coliforms isolated from nosocomial infections in a hospital in Isfahan. Iran Afr. J. Biotechnol. 2003; 2(10): 379-83.
- World Health Organization. Guidelines for drinking-water quality: first addendum to the 4th ed. Geneva. 2017.
- Fridman O., Goldberg A., Ronin I., Shoresh N., Balaban N. Q. Optimization of lag time underlies antibiotic tolerance in evolved bacterial populations. 2014; 513(7518): 418-21.
- Khatri I., Sharma G., Subramanian S. Composite genome sequence of Bacillus clausii, a probiotic commercially available as Enterogermina®, and insights into its probiotic properties. BMC Microbiol. 2019; 19(1): 1-15.
- Tuckfield R.C., McArthur J.V. Spatial analysis of antibiotic resistance along metal contaminated streams. Ecol. 2008; 55(4): 595-607.
- Habi S., Daba H. Plasmid incidence, antibiotic and metal resistance among Entererobacteriaceae isolated from Algerian streams. J. Biol. Sci. 2009; 12(22): 1474-82.
- Hölzel C.S., Müller C., Harms, K.S., Mikolajewski S., Schäfer S., Schwaiger, K., Bauer J. Heavy metals in liquid pig manure in light of bacterial antimicrobial resistance. Environ. Res. 2012; 113: 21–7.
- Zhou Y., Xu Y.B., Xu J.X., Zhang X.H., Xu S.H., Du Q.P. Combined toxic effects of heavy metals and antibiotics on a Pseudomonas fluorescens strain ZY2 isolated from swine wastewater. Int. J. Mol. Sci. 2015; 16(2): 2839–50.
- Seget P.Z., Cycoń J., Kozdrój J. Metal tolerant bacteria occurring in heavily polluted soil and mine spoil. Soil. Ecol. 2005; 28(3): 237-46.
- Jayaprakashvel M., Vijay S., Karthigeyan C.P., Hussain A.J. Isolation and characterization of mercury resistant marine bacteria from the coastal area of Chennai, India. J. Adv. Res. Eng. App. Sci. 2015; 4(8): 64-76.
- Das S. N., Mandal M., Mandal S. Plasmid mediated antibiotic and heavy metal co-resistance in bacterial isolates from Mahananda river water (Malda, India). Med. (Sunnyvale). 2016; 6(4): 1-6.
- Sahadeva R.P.K., Leong S.F., Chua K.H., Tan C.H., Chan H.Y., Tong E.V., Wong S.Y.W., Chan H.K. Survival of commercial probiotic strains to pH and bile. Food Res. J. 2011; 18(4): 1515-22.
- Oh D.H., Marshall D. L..Monolaurin and acetic acid inactivation of Listeria monocytogenes attached to stainless steel. Food. Prot. 1996; 59(3): 249–52.
- Quivey R.G., Kuhnert W.L., Hahn K. Genetics of acid adaptation in oral Crit. Rev. Oral Biol. Med. 2001; 12(4): 301–14.
- Cotter P. D., Hill C. Surviving the acid test: responses of Gram-positive bacteria to low pH. Mol. Biol. Rev. 2003; 67(3): 429–53.
- Gale E.F.: The bacterial amino acid decarboxylases. In: Advances in Enzymology and Related Areas of Molecular Biology (Nord FF, ed). John Wiley & Sons, Inc. 2006; pp 1–32.
- Huesca M., Goodwin A., Bhagwansingh A., Hoffman P., Lingwood C.A. Characterization of an acidic-pH-inducible stress protein (hsp70), a putative sulfatide binding adhesin from Helicobacter pylori. Infect Immun. 1998; 66(9): 4061–67.
- Lau S.K., Fan R.Y., Ho T.C., Wong G.K., Tsang A.K., Teng J.L., Chen W., Watt R.M., Curreem S.O., Tse H., Yuen K.Y., Woo P.C. Environmental adaptability and stress tolerance of Laribacter hongkongensis: a genome-wide analysis. Cell Biosci. 2011; 1(1): 1- 27.
- Goswami G., Panda D., Samanta R., Boro R.C., Modi M.K., Bujarbaruah K.M., Barooah M. Bacillus megaterium adapts to acid stress condition through a network of genes: Insight from a genome-wide transcriptome analysis. Scientific Reports. 2018; 8(1): 1-12.
- Hyronimus B., Le Marrec C., Hadj Sassi A., Deschamps A. Acid and bile tolerance of spore-forming lactic acid bacteria. J. Food Microbiol. 2000; 61(2-3): 193-7.
- Zhou X.X., Pan Y.J., Wang Y.B., Li W.F. In vitro assessment of gastrointestinal viability of two photosynthetic bacteria, Rhodopseudomonas palustris and Rhodobacter J. Zhejiang Univ. Sci. B. 2007; 8(9): 686-92.
- Moser S.A., Savage D.C. Bile salt hydrolase activity and resistance to toxicity of conjugated bile salts are unrelated properties in lactobacilli. Environ. Microbiol. 2001; 67(8): 3476-80.
- Sánchez B., Champomier-Vergès M.C., Anglade P., Baraige F., De Los Reyes-Gavilán C.G., Margolles A., Zagorec M. Proteomic analysis of global changes in protein expression during bile salt exposure of Bifidobacterium longum NCIMB 8809. Bacteriol. 2005; 187(16): 5799-808.
- Sánchez B., Champomier-Vergès M.C., Stuer-Lauridsen B., Ruas-Madiedo P., Anglade P., Baraige F., De Los Reyes-Gavilán C.G., Johansen E., Zagorec M., Margolles A. Adaptation and response of Bifidobacterium animalis lactis to bile: A proteomic and physiological approach. Appl. Environ. Microbiol. 2007; 73(21): 6757-67.
- Andriantsoanirina V., Allano S., Butel M.J., Aires J. Tolerance of Bifidobacterium human isolates to bile, acid and oxygen. Anaerobe. 2013; 21: 39-42.
- Ruiz L., Margolles A., Sánchez B. Bile resistance mechanisms in Lactobacillus and Front. Microbiol.2013; 4: 1-8.


 Cyanophytic Filamentous Forms
 Microphotograph from FC Hill